. 2023 Jan 31;120(5):e2204427120.
doi: 10.1073/pnas.2204427120. Epub 2023 Jan 24.

Metabolic reprogramming underlies cavefish muscular endurance despite loss of muscle mass and contractility

Affiliations

Metabolic reprogramming underlies cavefish muscular endurance despite loss of muscle mass and contractility

Luke Olsen et al. Proc Natl Acad Sci U S A. .

Abstract

Physical inactivity is a scourge to human health, promoting metabolic disease and muscle wasting. Interestingly, multiple ecological niches have relaxed investment into physical activity, providing an evolutionary perspective into the effect of adaptive physical inactivity on tissue homeostasis. One such example, the Mexican cavefish Astyanax mexicanus, has lost moderate-to-vigorous activity following cave colonization, reaching basal swim speeds ~3.7-fold slower than their river-dwelling counterpart. This change in behavior is accompanied by a marked shift in body composition, decreasing total muscle mass and increasing fat mass. This shift persisted at the single muscle fiber level via increased lipid and sugar accumulation at the expense of myofibrillar volume. Transcriptomic analysis of laboratory-reared and wild-caught cavefish indicated that this shift is driven by increased expression of pparγ-the master regulator of adipogenesis-with a simultaneous decrease in fast myosin heavy chain expression. Ex vivo and in vivo analysis confirmed that these investment strategies come with a functional trade-off, decreasing cavefish muscle fiber shortening velocity, time to maximal force, and ultimately maximal swimming speed. Despite this, cavefish displayed a striking degree of muscular endurance, reaching maximal swim speeds ~3.5-fold faster than their basal swim speeds. Multi-omic analysis suggested metabolic reprogramming, specifically phosphorylation of Pgm1-Threonine 19, as a key component enhancing cavefish glycogen metabolism and sustained muscle contraction. Collectively, we reveal broad skeletal muscle changes following cave colonization, displaying an adaptive skeletal muscle phenotype reminiscent to mammalian disuse and high-fat models while simultaneously maintaining a unique capacity for sustained muscle contraction via enhanced glycogen metabolism.

Keywords: evolutionary physiology; physical activity; skeletal muscle metabolism.


Conflict of interest statement

The authors declare no competing interest.

Figures

Fig. 1.
Fig. 1.
Shift in cavefish swimming speed and body composition. (A) Images of surface fish and two independently evolved cavefish populations: Pachón and Tinaja. (Scale bar, 1 cm.) (B) Average burst speed of surface fish, Pachón, and Tinaja cavefish (n = 20, 20, and 18, measurements per population, respectively). Percent (C) lean mass and (D) fat mass of A. mexicanus including F1 and F2 hybrids using an echoMRI (n = 8 for surface, Pachón, and Tinaja; n = 4 for F1 hybrids; n = 8 for F2 hybrids). (E) Representative full-body transverse cross sections of A. mexicanus used for the echoMRI measurements showing skeletal muscle (pink) and subcutaneous fat (white). (Scale bar, 500 µm.) (F) Muscle fiber cross sections from laboratory-reared (Left—experiment 1) and wild-caught (Right) surface fish and cavefish (Pachón). Muscle fibers are demarcated via wheat germ agglutin (green). (Scale bar, 50 µm.) (G) Muscle fiber cross-sectional area (CSA) of laboratory-reared (from experiment 1 and experiment 2) and wild-caught surface fish and cavefish (Pachón). n = 5 for lab Pachón, lab surface, and wild Pachón, n = 6 for wild surface. (H) Triglyceride content (nmol/µL) (n = 3 and 6 for Pachón and surface, respectively). (I) Glycogen content (µg/µL) (n = 5 and 6 for Pachón and surface, respectively). (J) Myosin content in pixel intensity (P.I.) (n = 5 per population). (K) Actin content in pixel intensity (P.I.) (n = 5 per population). (L) Transverse and sagittal electron micrographs of surface fish and cavefish (Pachón) skeletal muscle (n = 2 per population, scale bar, 200 nm). Green shading highlights the myofibril region and arrows indicate glycogen granules and a lipid droplet. (M) Quantification of myofibril area. Each point indicates the relative area of myofibrils within a single EM image. Per sample, ~150 images were quantified. (N) Percent water weight of surface fish and cavefish (Pachón). The higher the percent denotes greater weight in water. Following tests for normality (see Methods), normally distributed data were analyzed using a one-way ANOVA with Benjamini and Hochberg FDR correction (C and D) and an unpaired Student’s t test (G, H, J, K, and N). Nonnormally distributed data were analyzed using a Kruskal Wallis test with Benjamini and Hochberg FDR correction (B) and a Mann–Whitney Wilcox test (I and M). Data are presented as ±SEM, *< 0.05, **< 0.01, ***< 0.001, ****< 0.0001, ns = not significant.
Fig. 2.
Fig. 2.
The cavefish skeletal muscle transcriptome reflects their body composition. (A) Volcano plot of the DEGs between laboratory-reared surface fish and cavefish (Pachón) (up- and down-regulated in Pachón fish relative to surface fish). (B) Heatmap of the DEGs showing individual replicate data. (C) GO enrichment analysis of the DEGs from A and B. (D) Cumulative abundance of shared differentially expressed fast myosin heavy-chain genes in Tinaja and Pachón relative to surface fish (TPM: transcripts per million). (E) PC analysis of the laboratory-reared and wild-caught Pachón and surface fish transcriptome. (F) Venn diagram of all DEGs between laboratory-reared and wild-caught fish. Specific emphasis is placed on the 379 overlapping genes with their expression shown in the adjacent heatmap. (G) Cumulative abundance of the shared differentially expressed fast myosin heavy chain genes between laboratory-reared and wild-caught Pachón and surface fish. (H) Cumulative abundance of the differentially expressed fast myosin heavy chain proteins between cavefish (Pachón) and surface fish (n = 4 per population). (I) Cumulative abundance of fast myosin heavy chain genes of those identified as significantly different between laboratory-reared Pachón vs laboratory-reared surface fish. These genes (Dataset S6) were then used to determine cumulative fast myosin heavy-chain abundance in Molino and Tinaja. (J) pparγ expression between all fish populations. (K) pparγ and fast myosin heavy chain (fast-myhc) expression across developmental time points measured via RT-qPCR. Expression is taken relative to surface fish (indicated by the red line). Statistical analysis for RNA-sequencing is described in the “Lab Fish RNA-Sequencing” section in the SI Appendix, Supplementary Methods. For K, data were analyzed via two-way ANOVA with Benjamini and Hochberg FDR correction. D, G, and I are combined TPM’s of multiple fast myosin heavy chain genes and thus additional statistical analysis was not conducted and instead the total TPM abundance is shown. Data are presented as ±SEM, *< 0.05, **< 0.01, ***< 0.001, ****< 0.0001.
Fig. 3.
Fig. 3.
Cavefish maintain the capacity to increase swim speeds despite reduced muscle contractility. (A) Schematic of the muscle mechanics chamber showing skeletal muscle dissection, attachment, and stimulation. Arrows denote muscle shortening. (B) Maximal shortening velocity (vmax). (C) Twitch time to maximal force (ms). (D) Tetanus ½ relax time (TR, ms) (n = 8 per population for each experiment). (E) Schematic of the swim tunnel with the experimental timeline of the incremental swim test and tissue/blood collection. (F) Maximal swimming speed reached during the incremental swim test (Ucrit in cm/s; SI Appendix, Supplementary Methods) for Ucrit equation) in surface fish and cavefish (Pachón and Tinaja) (n = 8 per population). (G) Histological images of muscle fiber glycogen via Periodic acid-Schiff stain at the pre, acute-post, and 1-h post time point of surface fish and cavefish (Pachón). (H) Quantification of glycogen content shown in G (n = 3 to 4 per time point). (I) Blood glucose levels of exercised and nonexercised surface fish and cavefish (Pachón) (n = 4 per time point). (J) Quantification of phosphorylated AMPK-Thr172 in the exercised and nonexercised surface fish and cavefish (Pachón) (n = 4 per time point). Following tests for normality, significance was determined with an unpaired Student's t test (B and C), Mann–Whitney Wilcox test (D) one-way ANOVA with Benjamini and Hochberg FDR correction (F), and an ordinary, two-way ANOVA with Benjamini and Hochberg FDR correction (HJ). Data are presented as ±SEM, *< 0.05, **< 0.01, ***< 0.001, ns = not significant.
Fig. 4.
Fig. 4.
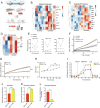
Multi-omics indicate increased abundance and activity of cavefish carbohydrate enzymes. (A) Tissue processing pipeline for both the proteomic and phosphoproteomic analysis for the surface fish and cavefish (Pachón) (n = 4 per time point). (B) Heatmap from the global proteomic dataset of the proteins within the glycolysis/gluconeogenesis KEGG pathway (n = 8 per population). (C) Heatmap of protein abundance levels from the targeted proteome analysis of proteins regulating carbohydrate metabolism (n = 6 per population). (D) Heatmap of the mean peak intensity of Pgm1 phosphorylated sites at the pre, acute, and 1 hrp time points. (E) Mean peak intensity of phosphorylation at each time point of surface fish and cavefish (Pachón) for Pgm1-Ser117, Pgm1-Thr19, and Pgm1-Thr115. (F) Pgm1 activity assay showing change in fluorescence over time in treated (with CIP) and untreated (without CIP) skeletal muscle samples from surface fish and cavefish (Pachón) (n = 6 per population). (G) Pgm1 activity assay of Pgm1-WT and Pgm1-T19A L6 myoblasts (n = 3 biological replicates). (H) Cell proliferation assay showing change in cell number spanning 144 h with Pgm1-WT and Pgm1-T19A L6 myoblasts (n = 2 biological replicates). (I) ECAR following glucose, oligomycin, and 2-deoxyglucose infusion. (J) Difference in glycolysis (maximum rate measurement before oligomycin injection minus last rate measurement before glucose injection). (K) Difference in glycolytic capacity (maximum rate measurement after oligomycin injection minus last rate measurement before glucose injection). (L) Glycogen synthesis (fold-change in glycogen content following insulin + glucose infusion). Significance was determined using a repeated measures two-way ANOVA (F and G) and ordinary (nonrepeated) two-way ANOVA (H) with Benjamini and Hochberg FDR correction and an unpaired Student’s t test (JK, and L). For proteomic and phosphoproteomic data, analysis can be found in the methods. Data are presented as ±SEM, **< 0.01, ***< 0.001, ****< 0.0001.

Similar articles

Cited by

References

    1. Rome L. C., Syme D. A., Hollingworth S., Lindstedt S. L., Baylor S. M., The whistle and the rattle: The design of sound producing muscles. Proc. Natl. Acad. Sci. U.S.A. 93, 8095–8100 (1996). - PMC - PubMed
    1. Dumesic P. A., et al. , An evolutionarily conserved uORF regulates PGC1alpha and oxidative metabolism in mice, flies, and bluefin tuna. Cell Metab. 30, 190–200.e196 (2019). - PMC - PubMed
    1. Kaji T., Anker A., Wirkner C. S., Palmer A. R., Parallel saltational evolution of ultrafast movements in snapping shrimp claws. Curr. Biol. 28, 106–113.e104 (2018). - PubMed
    1. Dickinson M. H., et al. , How animals move: An integrative view. Science 288, 100–106 (2000). - PubMed
    1. Fröbert O., Frøbert A. M., Kindberg J., Arnemo J. M., Overgaard M. T., The brown bear as a translational model for sedentary lifestyle-related diseases. J. Intern. Med. 287, 263–270 (2020). - PubMed

Publication types

LinkOut - more resources