Replacement Flame-Retardant 2-Ethylhexyldiphenyl Phosphate (EHDPP) Disrupts Hepatic Lipidome: Evidence from Human 3D Hepatospheroid Cell Culture
- PMID: 36693630
- PMCID: PMC9910051
- DOI: 10.1021/acs.est.2c03998
Replacement Flame-Retardant 2-Ethylhexyldiphenyl Phosphate (EHDPP) Disrupts Hepatic Lipidome: Evidence from Human 3D Hepatospheroid Cell Culture
Abstract
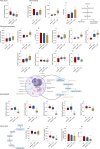
The present study aims to evaluate the effects of repeated exposure to 2-ethylhexyldiphenyl phosphate (EHDPP) on human liver cells. In vitro three-dimensional (3D) hepatospheroid cell culture was utilized to explore the potential mechanisms of EHDPP-mediated metabolic disruption through morphological, transcriptional, and biochemical assays. Lipidomics analysis was performed on the individual hepatospheroids to investigate the effects on intracellular lipid profiles, followed by hepatospheroid morphology, growth, functional parameters, and cytotoxicity evaluation. The possible mechanisms were delineated using the gene-level analysis by assessing the expression of key genes encoding for hepatic lipid metabolism. We revealed that exposure to EHDPP at 1 and 10 μM for 7 days alters the lipid profile of human 3D hepatospheroids. Dysregulation in several lipid classes, including sterol lipids (cholesterol esters), sphingolipids (dihydroceramide, hexosylceramide, ceramide, sphingomyelin), glycerolipids (triglycerides), glycerophospholipids, and fatty acyls, was noted along with alteration in genes including ACAT1, ACAT2, CYP27A1, ABCA1, GPAT2, PNPLA2, PGC1α, and Nrf2. Our study brings a novel insight into the metabolic disrupting effects of EHDPP and demonstrates the utility of hepatospheroids as an in vitro cell culture model complemented with omics technology (e.g., lipidomics) for mechanistic toxicity studies.
Keywords: 3D spheroids; flame retardants; lipidomics; metabolic disrupting chemicals; repeat dose toxicity.
Conflict of interest statement
The authors declare no competing financial interest.
Figures


Similar articles
-
2-Ethylhexyl Diphenyl Phosphate Affects Steroidogenesis and Lipidome Profile in Human Adrenal (H295R) Cells.Chem Res Toxicol. 2025 Apr 21;38(4):733-744. doi: 10.1021/acs.chemrestox.5c00030. Epub 2025 Apr 3. Chem Res Toxicol. 2025. PMID: 40178524 Free PMC article.
-
Effects of 2-ethylhexyl diphenyl phosphate (EHDPP) on glycolipid metabolism in male adult zebrafish revealed by targeted lipidomic analyses.Sci Total Environ. 2024 Oct 10;946:174248. doi: 10.1016/j.scitotenv.2024.174248. Epub 2024 Jun 25. Sci Total Environ. 2024. PMID: 38936724
-
An adverse outcome pathway based in vitro characterization of novel flame retardants-induced hepatic steatosis.Environ Pollut. 2021 Nov 15;289:117855. doi: 10.1016/j.envpol.2021.117855. Epub 2021 Jul 28. Environ Pollut. 2021. PMID: 34340181
-
The Hepatic Lipidome: A Gateway to Understanding the Pathogenes is of Alcohol-Induced Fatty Liver.Curr Mol Pharmacol. 2017;10(3):195-206. doi: 10.2174/1874467208666150817111419. Curr Mol Pharmacol. 2017. PMID: 26278391 Free PMC article. Review.
-
Endocrine disrupting potential of replacement flame retardants - Review of current knowledge for nuclear receptors associated with reproductive outcomes.Environ Int. 2021 Aug;153:106550. doi: 10.1016/j.envint.2021.106550. Epub 2021 Apr 10. Environ Int. 2021. PMID: 33848905 Review.
Cited by
-
2-Ethylhexyl Diphenyl Phosphate Affects Steroidogenesis and Lipidome Profile in Human Adrenal (H295R) Cells.Chem Res Toxicol. 2025 Apr 21;38(4):733-744. doi: 10.1021/acs.chemrestox.5c00030. Epub 2025 Apr 3. Chem Res Toxicol. 2025. PMID: 40178524 Free PMC article.
-
Impact of Exposure to a Mixture of Organophosphate Esters on Adrenal Cell Phenotype, Lipidome, and Function.Endocrinology. 2024 Feb 20;165(4):bqae024. doi: 10.1210/endocr/bqae024. Endocrinology. 2024. PMID: 38376928 Free PMC article.
-
Effects of Indoor Dust Exposure on Lung Cells: Association of Chemical Composition with Phenotypic and Lipid Changes in a 3D Lung Cancer Cell Model.Environ Sci Technol. 2023 Dec 12;57(49):20532-20541. doi: 10.1021/acs.est.3c07573. Epub 2023 Nov 30. Environ Sci Technol. 2023. PMID: 38035630 Free PMC article.
References
-
- Xu F.; Tay J. H.; Covaci A.; Padilla-Sánchez J. A.; Papadopoulou E.; Haug L. S.; Neels H.; Sellström U.; de Wit C. A. Assessment of Dietary Exposure to Organohalogen Contaminants, Legacy and Emerging Flame Retardants in a Norwegian Cohort. Environ. Int. 2017, 102, 236–243. 10.1016/j.envint.2017.03.009. - DOI - PubMed
-
- Zhao L.; Jian K.; Su H.; Zhang Y.; Li J.; Letcher R. J.; Su G. Organophosphate Esters (OPEs)in Chinese Foodstuffs: Dietary Intake Estimation via a Market Basket Method, and Suspect Screening Using High-Resolution Mass Spectrometry. Environ. Int. 2019, 128, 343–352. 10.1016/j.envint.2019.04.055. - DOI - PubMed
Publication types
MeSH terms
Substances
LinkOut - more resources
Full Text Sources
Miscellaneous

