. 2023 Jan 24;14(1):390.
doi: 10.1038/s41467-023-35944-z.

Long-term statins administration exacerbates diabetic nephropathy via ectopic fat deposition in diabetic mice

Affiliations

Long-term statins administration exacerbates diabetic nephropathy via ectopic fat deposition in diabetic mice

Tong-Sheng Huang et al. Nat Commun. .

Abstract

Statins play an important role in the treatment of diabetic nephropathy. Increasing attention has been given to the relationship between statins and insulin resistance, but many randomized controlled trials confirm that the therapeutic effects of statins on diabetic nephropathy are more beneficial than harmful. However, further confirmation of whether the beneficial effects of chronic statin administration on diabetic nephropathy outweigh the detrimental effects is urgently needed. Here, we find that long-term statin administration may increase insulin resistance, interfere with lipid metabolism, leads to inflammation and fibrosis, and ultimately fuel diabetic nephropathy progression in diabetic mice. Mechanistically, activation of insulin-regulated phosphatidylinositol 3-kinase/protein kinase B/mammalian target of rapamycin signaling pathway leads to increased fatty acid synthesis. Furthermore, statins administration increases lipid uptake and inhibits fatty acid oxidation, leading to lipid deposition. Here we show that long-term statins administration exacerbates diabetic nephropathy via ectopic fat deposition in diabetic mice.


Conflict of interest statement

The authors declare no competing interests.

Figures

Fig. 1
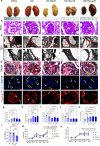
Fig. 1. Long-term statins administration worsens insulin resistance in db/db mice.
All mice were ~50 weeks old. a Schematic diagram showing the procedure of long-term administration of statins for db/db mice. b Body weight. For 12 weeks, n = 6 biologically independent mice in Db/m group, n = 13 in Db group, n = 10 in Db + Ato5 group, n = 16 in Db + Ato10 group, n = 9 in Db + Rosu20 group. But over time, some of the mice gradually lost weight and died. By 43W, n = 6 biologically independent mice in Db/m group, n = 6 in Db group, n = 5 in Db + Ato5 group, n = 3 in Db + Ato10 group, n = 3 in Db + Rosu20 group. For specific values see as a “Source Data file”. c Kaplan–Meier survival curves of db/db mice after long-term administration of statin. Log-rank (Mantel–Cox) test was used for the analysis of statistical significance. Exact p value = 4 × 10−7. d Measurements of fasting blood glucose. n = 4 per time point. Significance **p < 0.01 compared with Db + Ato5 group, ###p < 0.001 compared with Db + Ato10 group; e GHbA1c levels. n = 6 in each group. f ITT and AUC for db/db mice at 40 weeks. n = 4 per time point, and n = 5 per time point in Db + Ato5 group. g Immunohistochemical images of the RAGE in kidney sections. RAGE positive staining was mainly localized in the plasma membrane domains, and arrows represent RAGE expression in the cytoplasm of renal tubular epithelial cells. Original magnification ×400. Scale bar: 50 µm. All image part of the kidney was cortex. Renal structures indicated as proximal tubule (PT). h Quantitative analysis of expression of RAGE. n = 6 in each group. Data are expressed as means ± SEM (b, d, e, f, h). Significance tests were two-tailed, one-way ANOVA followed by Tukey’s test was performed (b, df, h). Source data are provided as a Source Data file.
Fig. 2
Fig. 2. Long-term statins administration worsens renal injury in db/db mice.
All mice were ~50 weeks old. a Representative images of mice kidney. b Representative sections of PAS staining for glomerulus. Arrows represent mesangial expansion and thickened capillary loop. Original magnification ×1000, Scale bar: 20 µm. c Representative images of TEM. The ultrastructure of renal cortex under electron microscope was shown in the enlarged pictures, and the stars in pictures were used to marked the basement membrane thickening and foot process fusion. Original magnification ×9700 and ×26,500, scale bar: 1 and 0.5 µm. d Representative sections of Periodic Acid-Silver Methenamine (PASM) staining for glomerulus. Arrows represent histologic abnormalities in the glomerulus, such as the increase of mesangium and GBM expansion, in the statin administration groups. Original magnification ×1000, Scale bar: 20 µm. e Immunofluorescence of Wilm tumor gene1 (WT1) staining. FITC-labeled WT1 (green) and DAPI (nuclei, blue) were used. WT1 is mainly expressed on the nucleus of glomerular podocytes, and the specific positive staining is indicated by the arrows. Original magnification ×1000, Scale bar: 10 µm. f Immunofluorescence of Nephrin staining. Alexa Fluor 594-labeled Nephrin were used. Nephrin is mainly expressed on the plasma membrane domains, and arrows represent Nephrin positive staining. Original magnification ×1000, Scale bar: 10 µm. g Glomerular Volume (103 × μm3). h Quantification of the mesangial area glomerulus. i Quantification of the number of podocytes in glomerulus. n = 6 in each group. j Immunofluorescence analysis of Nephrin. k Creatinine. l GFR measurement. n = 4 in Db/m and Db/db group, n = 6 in Db + Ato10 group. m UACR (n = 4 per time point). Data are expressed as means ± SEM. Significance **p < 0.01 versus Db/m group; ***p < 0.001 versus Db/m group. n Urinary KIM1 levels (n = 4 per time point). Significance #p < 0.01 versus Db group, ###p < 0.001 versus Db group. n = 6 in each group (gk). Data are expressed as means ± SEM (gl). One-way ANOVA with Tukey post hoc test was used for the analysis of statistical significance. Source data are provided as a Source Data file.
Fig. 3
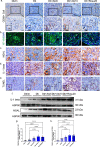
Fig. 3. Long-term statins administration worsens renal fibrosis in db/db mice.
All mice were ~50 weeks old. a Representative Masson’s trichrome staining. In the picture, collagenous components are stained as blue color and cytoplasm is varying shades of red. Collagen deposits (blue) are evident within the fibrotic interstitial lesions between tubular, and even in the glomerulus, as marked by arrows. Original magnification ×200. Scale bar: 100 µm. b Representative images of Sirius red staining for tubulointerstitial fibrosis. Sirius red staining showed fibrosis (Red color) in kidney fibrotic interstitial lesions, as marked by arrows. Original magnification ×200. Scale bar: 100 µm. c Immunohistochemistry of COL1A1 staining. COL1A1 is mainly expressed on the extracellular matrix (ECM), and the specific location is indicated by the arrows. Original magnification ×400 or ×1000. Scale bar: 100 or 20 µm. d Immunohistochemistry of α-SMA staining. α-SMA is used as a marker for a subset of activated fibrogenic cells, myofibroblasts, which are regarded as important effector cells of tissue fibrogenesis. Arrows represent numerous activated fibrogenic cells in tubulointerstitium and glomeruli. Original magnification ×400 or ×1000. Scale bar: 100 or 20 µm. e Quantification of tubulointerstitial fibrosis in the kidney cortex. f, g Quantification of immunohistochemical staining. All image part of the kidney was cortex. Renal structures indicated as glomerulus (G), proximal tubule (PT), and distal tubule (DT), extracellular matrix (ECM). Data are expressed as means ± SEM. n = 6 in each group. One-way ANOVA with Tukey post hoc test was used for the analysis of statistical significance. Source data are provided as a Source Data file.
Fig. 4
Fig. 4. Long-term statins administration worsens renal inflammation and tubular cell apoptosis in db/db mice.
All mice were ~50 weeks old. a Immunohistochemistry of CD68+ cell staining. CD68 is a valuable marker which can be used to identify macrophages and monocytes. And the arrows represent numerous macrophages in tubulointerstitium and glomeruli. Original magnification ×200 and ×1000. Scale bar: 100 and 20 µm. b Immunofluorescence of NF-кB staining. FITC-label (green) NF-кB and DAPI (nuclei, blue) were used. White arrows mean NF-кB-positive nuclei. Original magnification ×400. Scale bar: 25 µm. c Immunohistochemistry of neutrophil gelatinase-associated lipocalin (NGAL) staining. NGAL is mainly expressed in the cytoplasm, and the specific location is indicated by the arrows. Original magnification ×400. Scale bar: 50 µm. d Immunohistochemistry of IL-1β staining. IL-1β is mainly expressed in the cytoplasm, and the specific location is indicated by the arrows. Original magnification ×400. Scale bar: 50 µm. e Representative sections of TUNEL-positive cells. TUNEL-positive cells are expressed in nucleus, and the specific location is indicated by the arrows. Original magnification ×400. Scale bar: 50 µm. f The immunoblot analysis of IL-1β and NGAL. g, h Analysis of the grayscale image between them. All image part of the kidney was cortex. Renal structures indicated as glomerulus (G), proximal tubule (PT), and distal tubule (DT), collection tube (CD). Data are expressed as means ± SEM. n = 6 in each group. One-way ANOVA with Tukey post hoc test was used for the analysis of statistical significance. Source data are provided as a Source Data file.
Fig. 5
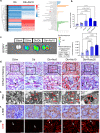
Fig. 5. Long-term statins administration contributes to lipid accumulation in db/db mice.
All mice were ~50 weeks old. a Clusters of DEGs and KEGG pathway analysis of DEGs in the kidneys of Db and Db + Ato10 groups. n = 3 in each group. b The concentration of TG in kidney. n = 6 in each group. Data are expressed as means ± SEM. c Fluorescence imaging of kidney FFAs uptake from Db/m, Db and Db + Ato10 groups. n = 3 in each group. Data are expressed as means ± SEM. d Representative images of Oil Red O staining. Lipid appear as red spots, as marked by arrows. Original magnification ×200 and ×400. Scale bar: 100 or 50 µm. e Representative images of TEM for LDs. Original magnification ×9700, scale bar: 1 µm. n = 5 images from three mice per group. f Immunohistochemistry of 4-hydroxynonenal (4-HNE) staining. 4-HNE is mainly expressed on the cytoplasmic, and the specific location is indicated by the arrows. Original magnification ×1000. Scale bar: 20 µm. g Immunofluorescence of DHE staining. DHE staining was used to estimate superoxide generation. Arrows represent DHE distribution was markedly increased in the statin administration groups compared to the Db group. Original magnification ×200. Scale bar: 100 µm. n = 10 images from six mice per group (d, f, g). All image part of the kidney was cortex. Renal structures indicated as glomerulus (G), proximal tubule (PT), and distal tubule (DT). One-way ANOVA with Tukey post hoc test was used for the analysis of statistical significance. Source data are provided as a Source Data file.
Fig. 6
Fig. 6. Long-term statins administration has cholesterol-lowering effect but increased renal lipid uptake and inhibited fatty acid oxidation in db/db mice.
All mice were ~50 weeks old. a Lipid profile in db/db mice. n = 6 in each group. Data are expressed as means ± SEM. bd Immunohistochemistry of HMGCR, LDLR, CD36 staining. HMGCR is mainly expressed on the cytoplasmic; LDLR and CD36 are mainly expressed on the membrane, and the specific positive staining is indicated by the arrows,. CD36 is expressed in a wide variety of kidney cells such as proximal tubular epithelial cells, mesangial cells, podocytes, monocytes and macrophages. Original magnification ×1000. Scale bar: 20 µm. e The immunoblot analysis of HMGCR, LDLR, CD36, CPT-1α, ATGL, and HSP90. fj Analysis of the grayscale image between them. All image part of the kidney was cortex. Renal structures indicated as glomerulus (G), proximal tubule (PT), and distal tubule (DT). Data are expressed as means ± SEM. n = 6 in each group. One-way ANOVA with Tukey post hoc test was used for the analysis of statistical significance. Source data are provided as a Source Data file.
Fig. 7
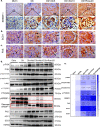
Fig. 7. Long-term statins administration activated SREBP-1 through PI3K/Akt/mTOR pathway in the db/db mice.
All mice were ~50 weeks old. ac Immunohistochemistry of SREBP-1, FAS, SCD1 staining. SREBP-1 is mainly expressed in the cytoplasmic and nucleus; FAS, SCD1 are expressed on the cytoplasm,. Arrows in the enlargement of a point to positive staining for SREBP1 in the nuclei of glomerular resident cells, arrows in b and c point to positive staining for FAS and SCD1 in the cytoplasm of glomerular resident cells. Original magnification ×100 and ×1000, scale bar: 200 and 20 µm. All image part of the kidney was cortex. Renal structures indicated as glomerulus (G). d the immunoblot analysis of p-PI3K, PI3K, p-Akt (Thr308), p-Akt (Ser473), t-Akt, p-P70(S6K), P70(S6K), SREBP-1, FAS, SCD1, ACC1 and HSP90. e Analysis of the grayscale image between them. Data are expressed as means ± SEM. n = 6 in each group. One-way ANOVA with Tukey post hoc test was used for the analysis of statistical significance. Significance *p < 0.05 versus Db/m group; **p < 0.01 versus Db/m group; ***p < 0.001 versus Db/m group, ****p < 0.0001 versus Db/m group. #p < 0.05 versus Db group; ##p < 0.01 versus Db group; ###p < 0.001 versus Db group, ####p < 0.0001 versus Db group. Source data are provided as a Source Data file.
Fig. 8
Fig. 8. Activating SREBP-1 in HK-2 cells aggravated lipid deposition.
a SREBP-1 (red) and BODIPY (green) expression was evaluated by immunofluorescence on HK-2 cells treated with negative control (Con) or insulin incubated with OA (120 μM) (Hight insulin, HI), or HI incubated with 10 μM Akt inhibitor MK2206 (HI + MK2206), 10 μM mTOR inhibitor CCI779 (HI + CCI779). FITC-labeled BODIPY, Alexa Fluor 594-labeled SREBP-1 and DAPI (nuclei, blue) were used. SREBP-1 is mainly expressed in the cytoplasmic of HK-2 cells, BODIPY in the cytoplasmic of HK-2 cells, and the specific location is indicated by the arrows. Representative image from three biologically independent samples/group were combined from three independent experiments. Original magnification ×630. Scale bar: 10 μm. b The immunoblot analysis of p-PI3K, PI3K, p-Akt (Thr308), p-Akt (Ser473), t-Akt, p-P70(S6K), P70(S6K), SREBP-1, FAS, SCD1, ACC1, HMGCR, LDLR, caspase 3, NGAL and HSP90. c Analysis of the grayscale image between them. Representative blots from three biologically independent samples/group were combined from three independent experiments. Data are expressed as means ± SEM. One-way ANOVA with Tukey post hoc test was used for the analysis of statistical significance. Significance *p < 0.05 versus CON group; **p < 0.01 versus CON group. #p < 0.05 versus HI group; ##p < 0.01 versus HI group; ###p < 0.001 versus HI group, ####p < 0.0001 versus HI group. Source data are provided as a Source Data file.
Fig. 9
Fig. 9. LDLR or SREBP-1‑deficient attenuates renal lipid deposition induced by long-term statins administration in STZ-induced diabetic mice.
All mice were ~30 weeks old. a Lipid profile and serum creatinine in STZ-induced diabetic mice. n = 3 in each group. Data are expressed as means ± SEM. b Representative images of Nile red staining. The lipid drops were stained in red, and the redder dots in the figure, the more lipid accumulation. Arrows represent lipid drops in renal tubular epithelial cells. Original magnification ×400. Scale bar: 50 µm. c Representative images of PAS staining. Original magnification ×1000. Scale bar: 20 µm. Arrows represent mesangial expansion. d Representative images of Masson’s trichrome staining. In the picture, collagenous components are stained as blue color and cytoplasm is varying shades of red. Collagen deposits (blue) are evident within the fibrotic interstitial lesions between tubular, and even in the glomerulus, as marked by arrows. Original magnification ×400. Scale bar: 50 µm. eg Quantification of bd staining. All image part of the kidney was cortex. Data are expressed as means ± SEM. n = 3 in each group. One-way ANOVA with Tukey post hoc test was used for the analysis of statistical significance. Source data are provided as a Source Data file.
Fig. 10
Fig. 10. Graphical representation of long-term statins administration exacerbates diabetic nephropathy via EFD.
Long-term administration of statins activates SREBP-1 fatty acid synthesis signaling, increases kidney lipid uptake, and inhibits fatty acid oxidation, which leads to EFD in the kidneys of diabetic mice. Graphics were created with Biorender.com.

Comment in

Similar articles

Cited by

References

    1. Sun H, et al. IDF Diabetes Atlas: global, regional and country-level diabetes prevalence estimates for 2021 and projections for 2045. Diabetes Res. Clin. Pr. 2022;183:109119. - PMC - PubMed
    1. Zhang L, et al. Trends in chronic kidney disease in China. N. Engl. J. Med. 2016;375:905–906. - PubMed
    1. McGarry JD. Banting lecture 2001: dysregulation of fatty acid metabolism in the etiology of type 2 diabetes. Diabetes. 2002;51:7–18. - PubMed
    1. Chen X, et al. Disulfide-bond A oxidoreductase-like protein protects against ectopic fat deposition and lipid-related kidney damage in diabetic nephropathy. Kidney Int. 2019;95:880–895. - PubMed
    1. DeFronzo RA, Reeves WB, Awad AS. Pathophysiology of diabetic kidney disease: impact of SGLT2 inhibitors. Nat. Rev. Nephrol. 2021;17:319–334. - PubMed

Publication types

MeSH terms