. 2023 Jan 24;14(1):381.
doi: 10.1038/s41467-023-35802-y.

A CRISPR-Cas9 screen identifies EXO1 as a formaldehyde resistance gene

Affiliations

A CRISPR-Cas9 screen identifies EXO1 as a formaldehyde resistance gene

Yuandi Gao et al. Nat Commun. .

Abstract

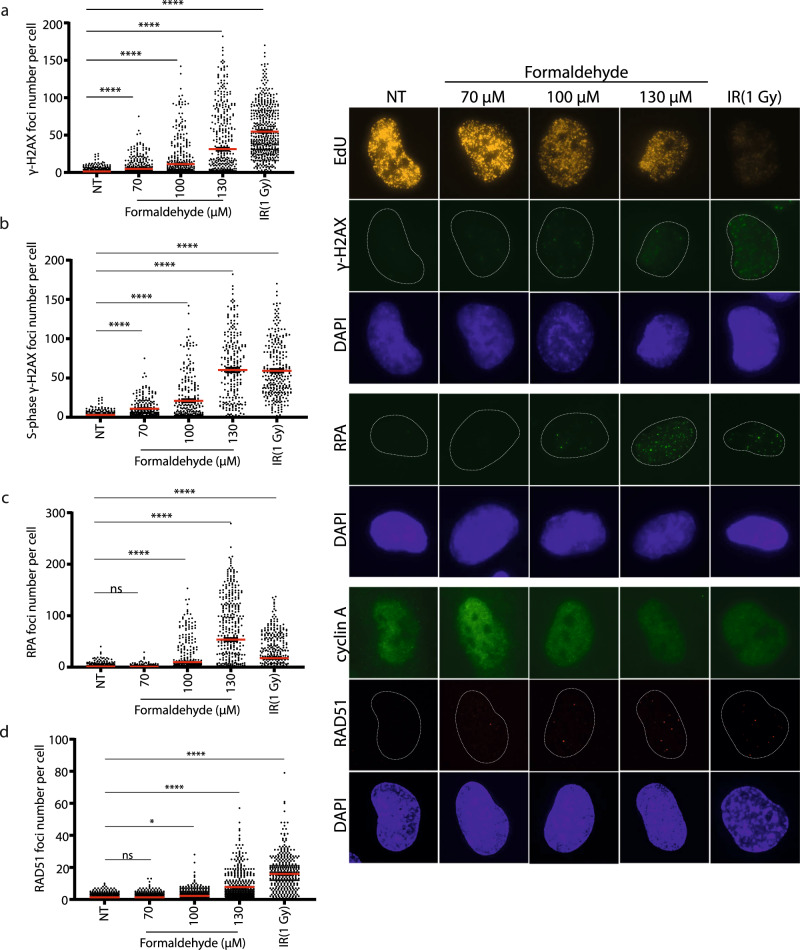
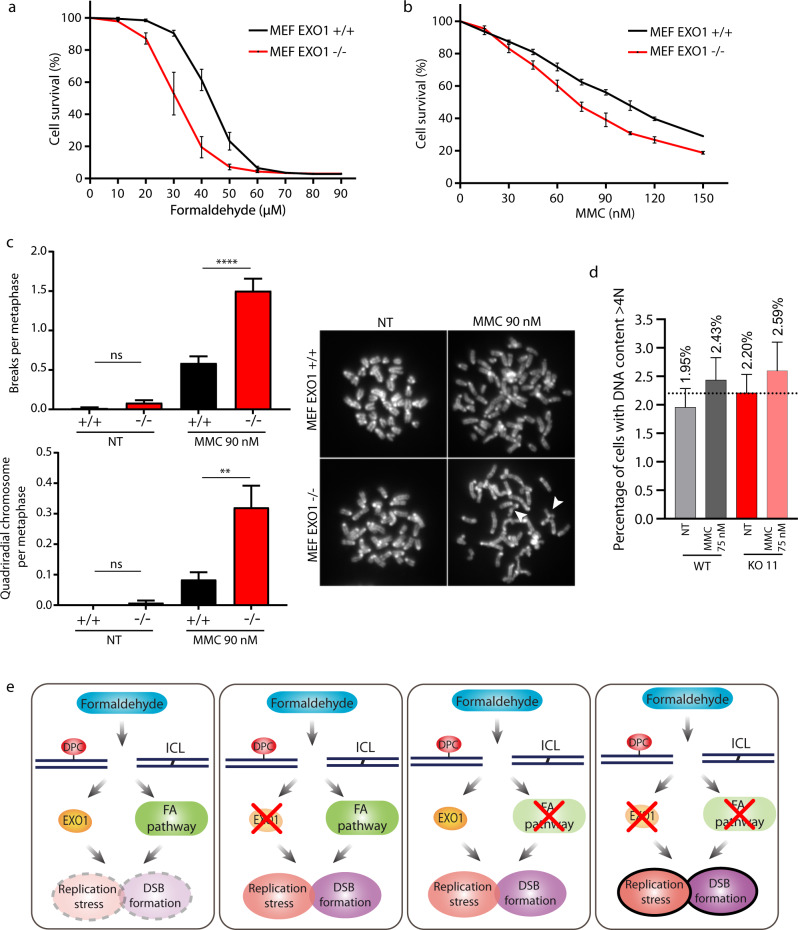
Fanconi Anemia (FA) is a rare, genome instability-associated disease characterized by a deficiency in repairing DNA crosslinks, which are known to perturb several cellular processes, including DNA transcription, replication, and repair. Formaldehyde, a by-product of metabolism, is thought to drive FA by generating DNA interstrand crosslinks (ICLs) and DNA-protein crosslinks (DPCs). However, the impact of formaldehyde on global cellular pathways has not been investigated thoroughly. Herein, using a pangenomic CRISPR-Cas9 screen, we identify EXO1 as a critical regulator of formaldehyde-induced DNA lesions. We show that EXO1 knockout cell lines exhibit formaldehyde sensitivity leading to the accumulation of replicative stress, DNA double-strand breaks, and quadriradial chromosomes, a typical feature of FA. After formaldehyde exposure, EXO1 is recruited to chromatin, protects DNA replication forks from degradation, and functions in parallel with the FA pathway to promote cell survival. In vitro, EXO1-mediated exonuclease activity is proficient in removing DPCs. Collectively, we show that EXO1 limits replication stress and DNA damage to counteract formaldehyde-induced genome instability.


Conflict of interest statement

The authors declare no competing interests.

Figures

Fig. 1
Fig. 1. A CRISPR-Cas9 screen to identify genes that are responding to formaldehyde.
a Schematic overview of the formaldehyde CRISPR-Cas9 screen. In brief, RPE-1 cells were infected by the TKO_V1 lentiviral library, followed by puromycin selection and amplification. Infected cells were continuously treated with or without 70 µM formaldehyde and genomic DNA extraction was carried out on day 9 and day 15 post-treatment. Next-generation sequencing results were analyzed with DrugZ. NT: untreated cells. b Normalized gene-level Z-scores (normZ score) for genes that appeared in results from the negative selection of the CRISPR-Cas9 screen. The dashed line corresponds to the significance threshold (−3 represents a probability value of less than 0.001). Genes in blue belong to the FA pathway, in green to formaldehyde catabolic process and EXO1 is in red. c Gene ontology of biological processes corresponding to genes targeted by sgRNA that are significantly decreased after formaldehyde treatment presented by DAVID software. The size of the circle is proportional to the number of genes identified by the screen included in the indicated biological processes. FDR false discovery rate.
Fig. 2
Fig. 2. A secondary knockdown screen identifies EXO1 as a formaldehyde resistance gene.
a Left. 20 drop-out hits were selected by their normZ score (lower than −3 on both day 9 and day 15, and a FDR lower than 0.05). Right. The 20 drop-out hits are presented by STRING. Green: formaldehyde catabolic processes, blue: FA pathway genes, yellow: transcription-coupled nucleotide excision repair genes, red: EXO1, gray: other genes non-assigned to any specific pathway. b Cell survival in RPE-1 cells transfected with siCTL or individual siRNAs targeting the 20 drop-out hits from the CRISPR-Cas9 screen. Data are presented with ±SEM from three independent experiments. *p < 0.1, ***p  <  0.001 and ****p  <  0.0001 (ordinary one-way ANOVA). c Schematic overview of domains in the human EXO1 protein. d Survival curve of RPE-1 EXO1 wild-type (WT) cells and RPE-1 EXO1 knockout clones (KO 7, KO 11) treated with different concentrations of formaldehyde for 96 h. Data are presented with ±SEM from three independent experiments. Protein level of EXO1 in RPE-1 WT, KO 7, KO 11 cells, with vinculin as loading control. e Survival curve of RPE-1 EXO1 WT with AAVS1 empty vector (WT + EV) cells, KO 11 with AAVS1 empty vector (KO 11 + EV) cells and KO 11 complemented with WT EXO1 (KO 11 + WT EXO1) cells treated with different concentrations of formaldehyde for 96 h. Data are presented with ±SEM from three independent experiments. Protein level of EXO1 in RPE-1 AAVS1 complemented cells, with α-tubulin as loading control. f Scheme for generating single copy of EXO1 WT complemented cells using integration at the AAVS1 single locus.
Fig. 3
Fig. 3. EXO1 limits DNA replication stress and DNA damage induced by formaldehyde.
a Protein levels of EXO1, pChk1 (pSer 345), and Chk1 in RPE-1 WT, KO 7, KO 11, and AAVS1 complemented cells with or without 100 µM formaldehyde treatment for 18 h, with housekeeping genes (β-actin or vinculin) as loading controls. b CldU track length of DNA fibers from AAVS1 complemented cells with or without 100 µM formaldehyde treatment for 18 h. Data are shown with mean ± SEM from three independent experiments. ns: non-significant, ****p < 0.0001 (one-way ANOVA, followed by Kruskal–Wallis test). EV: AAVS1 + Empty Vector. c CldU track length of DNA fibers in RPE-1 WT and EXO1 KO 11 cells with the indicated treatment. Data are shown with mean ± SEM from three independent experiments. ns: non-significant, *p < 0.1. (One-way ANOVA, followed by Kruskal–Wallis test).
Fig. 4
Fig. 4. Formaldehyde induces DNA double-strand breaks (DSBs) mainly in S/G2 phase and homologous recombination.
Immunofluorescence (IF) staining against a γH2AX (pSer 139), b γH2AX (pSer 139) in S-phase cells determined by EdU staining, c RPA2, and d RAD51 as well as cyclin A in RPE-1 cells under 0, 70, 100, 130 µM formaldehyde treatment for 18 h or 1 Gy irradiation. Data are shown with mean ± SEM from three independent experiments. RAD51 foci were quantified in cyclin A positive cells. ns: non-significant, *p < 0.1, ****p < 0.0001 (one-way ANOVA, followed by Kruskal–Wallis test). Representative images of IF are shown on the right.
Fig. 5
Fig. 5. EXO1 responds to formaldehyde-induced DSBs.
a IF staining against γH2AX (pSer 139) in S-phase indicated by EdU staining in RPE-1 WT and EXO1 KO (KO 7, KO 11) cells without treatment or treated with 100 µM formaldehyde for 18 h or 5 Gy irradiation. b Quantification of γH2AX (pSer 139) foci in S-phase cells for a. Data are shown with mean ± SEM from three independent experiments. ns: non-significant, *p < 0.1, ****p < 0.0001 (one-way ANOVA, followed by Kruskal–Wallis test). c IF staining against γH2AX (pSer 139) in S/G2-phase indicated by Geminin staining in RPE-1 WT and EXO1 KO 11 cells transfected with siCTL or siMus81, treated with or without 100 µM formaldehyde for 18 h. d Left. Protein levels of EXO1, Mus81 in RPE-1 WT and EXO1 KO 11 cells transfected with siCTL or siMus81,with α-tubulin as a loading control. Right. Quantification of γH2AX (pSer 139) foci in S/G2-phase cells for c. Data are shown with mean ± SEM from three independent experiments. ns: non-significant, ****p < 0.0001 (one-way ANOVA, followed by Kruskal–Wallis test).
Fig. 6
Fig. 6. EXO1 responds to formaldehyde-induced damage specifically.
a Left. IF staining against RPA2, RAD51 as well as cyclin A, and p53BP1 (pSer 1778) in RPE-1 WT and EXO1 KO (KO 7, KO 11) cells treated with 0 or 100 µM formaldehyde for 18 h. Right. Foci quantification performed in cyclin A or EdU positive cells. Data are shown with mean ± SEM from three independent experiments. ns: non-significant, *p < 0.1, **p < 0.01, and ****p  <  0.0001 (one-way ANOVA, followed by Kruskal–Wallis test). b Protein levels of EXO1, RPA32 (pSer4/Ser8) and RPA70 in RPE-1 WT and EXO1 KO (KO 7, KO 11) cells without treatment or treated with 100 µM formaldehyde for 18 h, with β-actin as a loading control. c Protein levels of EXO1 in RPE-1 WT cells with or without 1 mM formaldehyde treatment (30 min or 1 h), in either chromatin fraction (anti-histone H3) or non-chromatin fractions (α-tubulin). Quantification of the blots from three independent experiments is presented in Supplementary Fig. 6b. d Top. IF staining against pEXO1 (pSer 714) in S-phase determined by EdU staining in RPE-1 WT cells with or without 100 µM formaldehyde treatment for 18 h. Bottom. Foci quantification performed in EdU positive cells. Data are shown with mean ± SEM from three independent experiments. ****p < 0.0001 (one-way ANOVA, followed by Kruskal–Wallis test).
Fig. 7
Fig. 7. EXO1 participates in repairing both ICLs and DPC.
a Survival curve of RPE-1 EXO1 WT, KO 7, KO 11 treated with different concentrations of MMC for 96 h. Data are presented with ±SEM from three independent experiments. b Quantitative evaluation of recruitment kinetics for GFP-EXO WT or GFP-EXO1 D173A to ICL sites induced by TMP incubation followed by UV micro-irradiation in HeLa cells. Mean curves ± SEM are shown (n ≥ 100 cells per condition). c IF staining against TOP1cc in S/G2 phases marked by Geminin staining in RPE-1 WT and EXO1 KO 11 cells treated with 100 µM formaldehyde for 18 h. Data are shown with mean ± SEM from three independent experiments. ****p  <  0.0001 (Mann–Whitney test). Quantification was performed in Geminin positive cells. d SDS-PAGE of purified human EXO1-WT and EXO1-D173A (nuclease dead mutant). e In vitro resection products of incubating purified EXO1-WT or EXO1-D173A with non-DPC or DPC probes were detected by autoradiography after agarose gel electrophoresis. The percentage of resection and the percentage of blocked resection (product 1 and product 2) were quantified.
Fig. 8
Fig. 8. EXO1 and the FA pathway contribute to formaldehyde resistance.
a Right. IF staining against FANCD2 and Geminin was performed in RPE-1 WT, EXO1 KO (KO 7, KO 11) cells treated with or without 100 µM formaldehyde for 18 h. Data are shown with mean ± SEM from three independent experiments. ns: non-significant, **p < 0.01 and ****p  <  0.0001 (one-way ANOVA, followed by Kruskal–Wallis test). Left. Quantification was performed in Geminin positive cells. b Left. Survival curve of RPE2 WT and FANCA KO cells transfected with siCTL or siEXO1 and treated with different concentrations of formaldehyde for 96 h. Data are presented with ±SEM from three independent experiments. Right. FANCA and EXO1 protein levels with α-tubulin as a loading control. c Left. Quantitative evaluation of recruitment kinetics for GFP-EXO1 to ICL sites induced by TMP incubation followed by UV micro-irradiation in S-phase, indicated by mCherry-PCNA staining, in HeLa WT and FANCA KO cells. Right. Mean curves ± SEM are shown (n ≥ 100 cells per condition).
Fig. 9
Fig. 9. EXO1 deficiency leads to 53BP1 bodies accumulation.
Quantification of immunofluorescence analysis against 53BP1 nuclear bodies in G1 (cyclin A negative cells) in RPE-1 WT, EXO1 KO7, or EXO1 KO11 cells, untreated or treated 100 µM formaldehyde for 18 h. The histogram presents the percentage of G1 cells corresponding to different number of 53BP1 bodies. Data are shown with mean ± SEM from three independent experiments.
Fig. 10
Fig. 10. EXO1 deficiency leads to heightened chromosomal breaks, quadriradial chromosomes, and accumulation of 4 N DNA.
a Survival curve of mouse embryonic fibroblasts (MEFs) Exo1 WT and Exo1 KO treated with different concentrations of formaldehyde for 96 h. Data are presented with ±SEM from three independent experiments. b Survival curve of MEFs Exo1 WT and EXO1 KO treated with different concentrations of MMC for 96 h. Data are presented with ±SEM from three independent experiments. c Quantification of chromosomal breaks and quadriradial chromosomes per metaphase in MEFs Exo1 WT and Exo1 KO MEFs under 0 or 90 nM MMC for 48 h. **p < 0.01 and ****p < 0.0001 (one-way ANOVA, followed by Kruskal–Wallis test). d Percentage of cells with DNA content above 4 N in RPE-1 WT and EXO1 KO 11 cells after 24 h of 75 nM MMC treatment. e A potential model of how EXO1 participates in response to formaldehyde-induced DNA damage. Formaldehyde induces ICLs/DPCs, which are acted upon by the EXO1 and the FA pathway. When EXO1 or FA pathways are inactivated, this leads to aggravated DNA replication stress and DSB formation. The EXO1 or FA pathways cannot compensate totally for each other as they show additive functions in epistatic analyses.

Similar articles

Cited by

References

    1. Pommier Y. DNA topoisomerase I inhibitors: chemistry, biology, and interfacial inhibition. Chem. Rev. 2009;109:2894–2902. doi: 10.1021/cr900097c. - DOI - PMC - PubMed
    1. Nitiss JL. Targeting DNA topoisomerase II in cancer chemotherapy. Nat. Rev. Cancer. 2009;9:338–350. doi: 10.1038/nrc2607. - DOI - PMC - PubMed
    1. Smith KC. Dose dependent decrease in extractability of DNA from bacteria following irradiation with ultraviolet light or with visible light plus dye. Biochem. Biophys. Res Commun. 1962;8:157–163. doi: 10.1016/0006-291X(62)90255-3. - DOI - PubMed
    1. Heck HD, Casanova M, Starr TB. Formaldehyde toxicity-new understanding. Crit. Rev. Toxicol. 1990;20:397–426. doi: 10.3109/10408449009029329. - DOI - PubMed
    1. Nakamura J, Nakamura M. DNA-protein crosslink formation by endogenous aldehydes and AP sites. DNA Repair. 2020;88:102806. doi: 10.1016/j.dnarep.2020.102806. - DOI - PMC - PubMed

Publication types

MeSH terms