. 2023 Jan 24;9(1):11.
doi: 10.1038/s41421-022-00511-1.

Chromosome territory reorganization through artificial chromosome fusion is compatible with cell fate determination and mouse development

Affiliations

Chromosome territory reorganization through artificial chromosome fusion is compatible with cell fate determination and mouse development

Yuang Wang et al. Cell Discov. .

Abstract

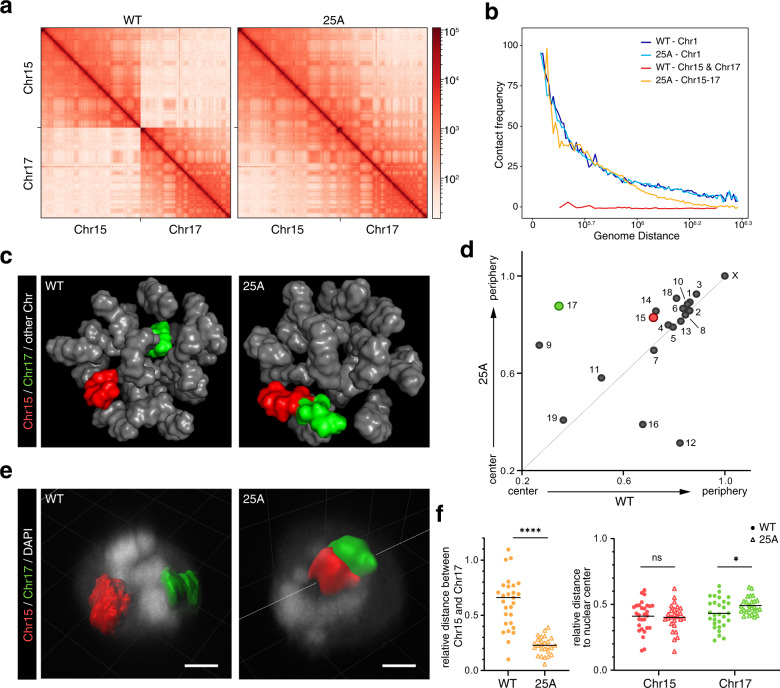
Chromosomes occupy discrete spaces in the interphase cell nucleus, called chromosome territory. The structural and functional relevance of chromosome territory remains elusive. We fused chromosome 15 and 17 in mouse haploid embryonic stem cells (haESCs), resulting in distinct changes of territories in the cognate chromosomes, but with little effect on gene expression, pluripotency and gamete functions of haESCs. The karyotype-engineered haESCs were successfully implemented in generating heterozygous (2n = 39) and homozygous (2n = 38) mouse models. Mice containing the fusion chromosome are fertile, and their representative tissues and organs display no phenotypic abnormalities, suggesting unscathed development. These results indicate that the mammalian chromosome architectures are highly resilient, and reorganization of chromosome territories can be readily tolerated during cell differentiation and mouse development.


Conflict of interest statement

The authors declare no competing interests.

Figures

Fig. 1
Fig. 1. CRISPR/Cas9 mediated site-specific chromosome breaks and Chr15-17 fusion in haESCs.
a Schematic showing the experimental strategy for generating site-specific chromosome fusion of Chr15 (red) and Chr17 (green) in haESCs. Two sgRNAs guide Cas9 (scissors) to the indicated target sites (yellow) located near D-telomere region (gray) of Chr15 and C-telomere region (blue) of Chr17, respectively. Chromosome fusion occurred between two target sites and was detected by cross-chromosomal PCR. Chr15 without D-telomere and Chr17 without C-telomere are ligated through NHEJ pathway, generating Chr15-17 fusion. Primers are designed at the upstream and downstream of each sgRNA target site. b PCR analysis of 25A haESCs with primers mentioned in (a). Cross-chromosomal PCR with primer pairs ‘F1’ and ‘R2’ amplified a ~ 650 bp band only in 25A, while “F1” and “R1” on Chr15 and “F2” and “R2” on Chr17 amplified a ~700 bp and a ~580 bp band, respectively only in WT but not in 25A. c Fluorescent images of the metaphase chromosomes of WT and 25A haESCs labeled with whole painting probes of Chr15 (red) and Chr17 (green). Insets zoomed-in showing the Chr15 and Chr17 in WT and the fused Chr15-17 in 25A. The mini-chromosome is indicated with a white arrowhead. Scale bar: 10 μm. d Proliferation rates examined by total cell number of WT and 25A haESCs. ns not significant. e Real-time PCR analysis of the expression levels of pluripotency marker genes (Oct4, Sox2 and Nanog) and differentiation-related genes (Ectoderm: Pax6, Nestin; Mesoderm: KDR, αSMA, PDGFRα; Endoderm: AFP, Gata4, Gata6) in differentiated WT and 25A cells. The expression levels were Log transformed. Data are represented as the mean ± SD, n = 3. Gene expression levels were not significant between WT and 25A cells. f Paraffin sections of teratomas formed by WT and 25A cells were stained with three germ-layer markers including the ectoderm marker Tuj1, the mesoderm marker αSMA and the endoderm marker AFP. Scale bar: 20 μm.
Fig. 2
Fig. 2. Change of chromosome territory after Chr15 and Chr17 fusion.
a Contact matrixes at 1 Mb resolution on Chr15 and Chr17 of WT and 25A cells. b Contact frequency curves showing contact probabilities as a function of genomic distances around fusion site (within 1 Mb) on Chr15 and Chr17. Chr1 was included as a single chromosome control. c Inferred 3D genome structures in WT and 25A cells using Hi-C data. Chr15 was shown in red and Chr17 in green. d Radial distributions of each chromosome relative to nucleus center in WT (horizontal axis) and 25A (vertical axis) derived from inferred 3D models (c). e 3D-FISH reconstruction of the Chr15 and Chr17 in WT and 25A haESCs. Chr15 was labeled in red and Chr17 in green. Scale bar: 2 μm. f Quantification of relative distance between Chr15 and Chr17 (left), and relative distance of Chr15 and Chr17 to the nucleus center (right) in WT and 25A haESCs. (mean ± SD, two-tailed ratio Student’s t-test, *P < 0.05, **P < 0.01, ***P < 0.005, ****P < 0.0001, ns not significant. n = 29 and 26 cells, respectively).
Fig. 3
Fig. 3. Transcriptome and TADs analyses in 25A cells.
a Comparison of gene expression in 25A cells and WT cells. Upregulated and downregulated genes were shown in red and blue, respectively (FDR < 5%). b The proportion of the differentially expressed genes in each chromosome of 25A cells. The dash line indicates the average proportion of differentially expressed genes of the whole genome. ce Comparison of TAD boundaries in WT and 25A cells. Aggregate profiles of insulation scores around TADs boundaries at a 10 Kb resolution for the whole genome (c), Chr15 (d) and Chr17 (e). f Hi-C contact matrixes of the 3 Mb region upstream from chromosome fusion site on Chr15 and downstream on Chr17 of WT and 25A cells. TADs are depicted as black triangles. RNA-seq expression tracks in the corresponding fusion regions in both WT and 25A cells are shown in lower panels.
Fig. 4
Fig. 4. Generation of chromosome fusion mice.
a Schematic procedures showing the generation of chromosome-fusion heterozygous mice (see Methods). Chromosome-fusion homozygous mice are generated by crossing between heterozygous female and male mice. PPN (pseudo-pronucleus) was derived from the injected haESCs. b Genotype analysis of the chromosome fusion homozygous and heterozygous mice. WT and homozygous mice showed a ~860 bp and a ~660 bp band, respectively, while heterozygous mouse showed both. c G-band karyotype analysis of 25A heterozygous male mouse (37+XY, t(15;17)(F3;A2)). The red arrowhead indicates the fused Chr15-17. d G-band karyotype analysis of 25A homozygous male mouse (36+XY, t(15;17)(F3;A2)×2). The red arrowhead indicates the fused Chr15-17. e The appearances of a WT male mouse (left), a 25A heterozygous male mouse (middle) and a 25A homozygous male mouse (right). f Growth curve along postnatal development of the WT, 25A heterozygous and homozygous mice from 1 week to 8 weeks.
Fig. 5
Fig. 5. Phenotypic analyses of chromosome fusion mice.
a Morphological features of liver, spleen and lung from adult WT and 25A (Chr15-17 fusion) homozygous mice. Scale bar: 300 mm. bd Relative organ weight to body weight of liver (b), spleen (c) and lung (d) in 8 weeks WT and Chr15-17 fusion homozygous mice. (mean ± SD, two-tailed Student’s t-test, n = 3). e HE staining of liver, spleen and lung from 8 weeks WT and Chr15-17 fusion homozygous mice. Scale bar: 50 μm. f Chromosome FISH for Chr15 (red) and Chr17 (green) in the cells of liver (left), spleen (middle) and lung (right) from WT and Chr15-17 fusion homozygous mice. The nuclei were stained with DAPI (gray). Scale bar: 2.5 μm. g Quantification of relative distance between Chr15 and Chr17 in the cells of the corresponding organs of WT and Chr15-17 fusion homozygous mice. (two-tailed Student’s t-test, n = 118, 120, 102, 102, 104 and 104 chromosomes, respectively.) h Quantification of relative distance of Chr15 and Chr17 to the nucleus center in the cells of the corresponding organs of WT and Chr15-17 fusion homozygous mice. (two-tailed Student’s t-test, n = 118, 120, 102, 102, 104 and 104 chromosomes, respectively.) i Serum biochemical test of WT, Chr15-17 fusion heterozygous and homozygous mice. (mean ± SD, n = 5, 3, 3 mice, respectively).

Similar articles

Cited by

References

    1. Khandelwal S. Chromosome evolution in the genus Ophioglossum L. Bot. J. Linn. Soc. 1990;102:205–217. doi: 10.1111/j.1095-8339.1990.tb01876.x. - DOI
    1. Crosland MW, Crozier RH. Myrmecia pilosula, an ant with only one pair of chromosomes. Science. 1986;231:1278. doi: 10.1126/science.231.4743.1278. - DOI - PubMed
    1. Bolzer A, et al. Three-dimensional maps of all chromosomes in human male fibroblast nuclei and prometaphase rosettes. PLoS Biol. 2005;3:e157. doi: 10.1371/journal.pbio.0030157. - DOI - PMC - PubMed
    1. Cheeseman IM, Desai A. Molecular architecture of the kinetochore-microtubule interface. Nat. Rev. Mol. Cell Biol. 2008;9:33–46. doi: 10.1038/nrm2310. - DOI - PubMed
    1. Bianchi A, Shore D. How telomerase reaches its end: Mechanism of telomerase regulation by the telomeric complex. Mol. Cell. 2008;31:153–165. doi: 10.1016/j.molcel.2008.06.013. - DOI - PubMed