. 2023 Jan 24;14(1):379.
doi: 10.1038/s41467-023-36046-6.

Rabphilin-3A undergoes phase separation to regulate GluN2A mobility and surface clustering

Affiliations

Rabphilin-3A undergoes phase separation to regulate GluN2A mobility and surface clustering

Lei Yang et al. Nat Commun. .

Abstract

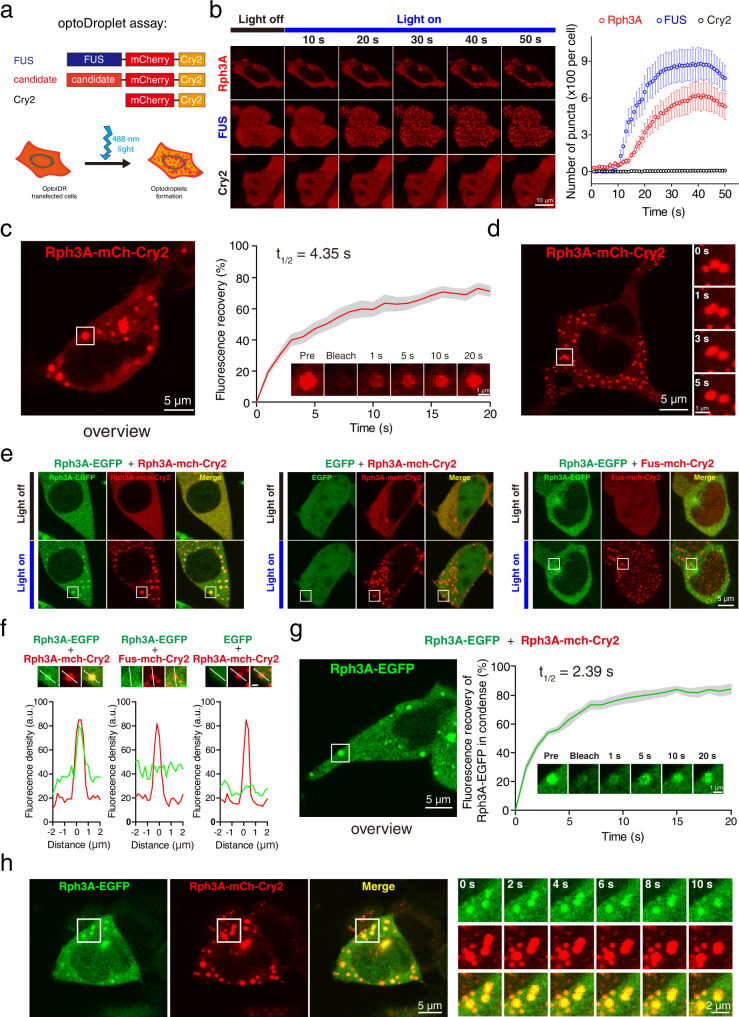
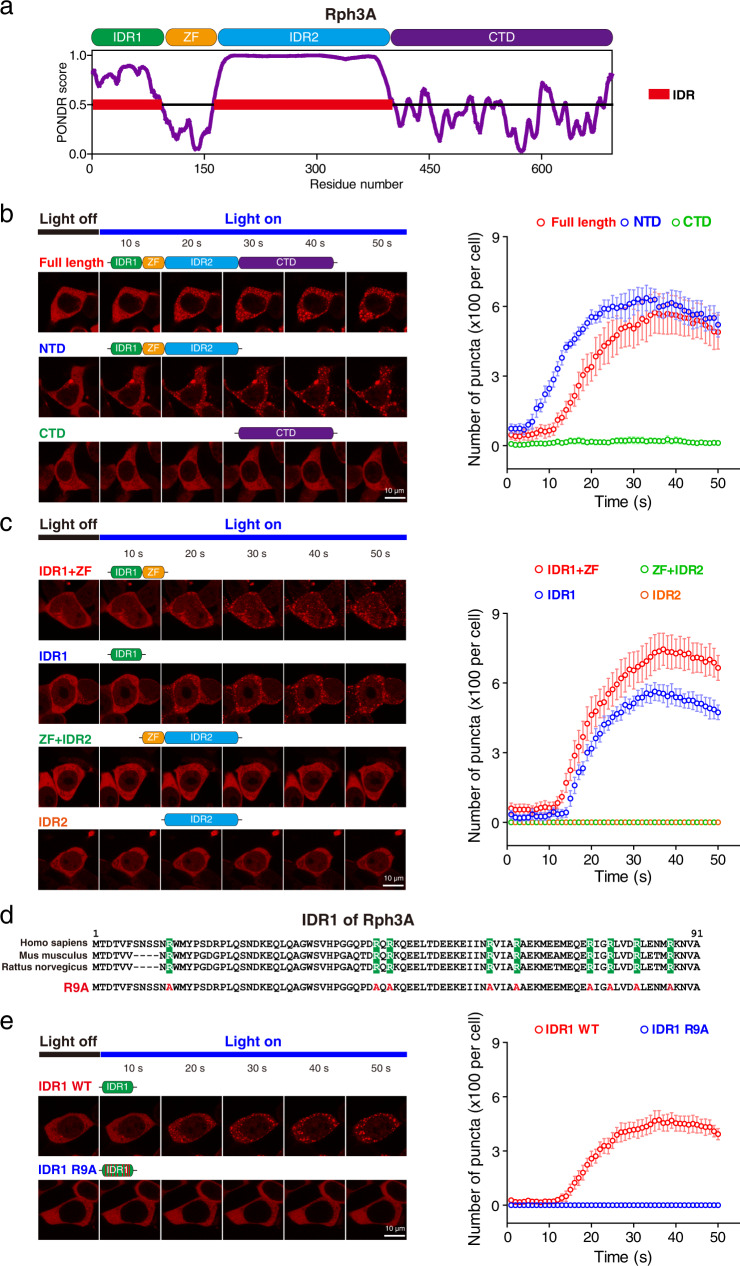
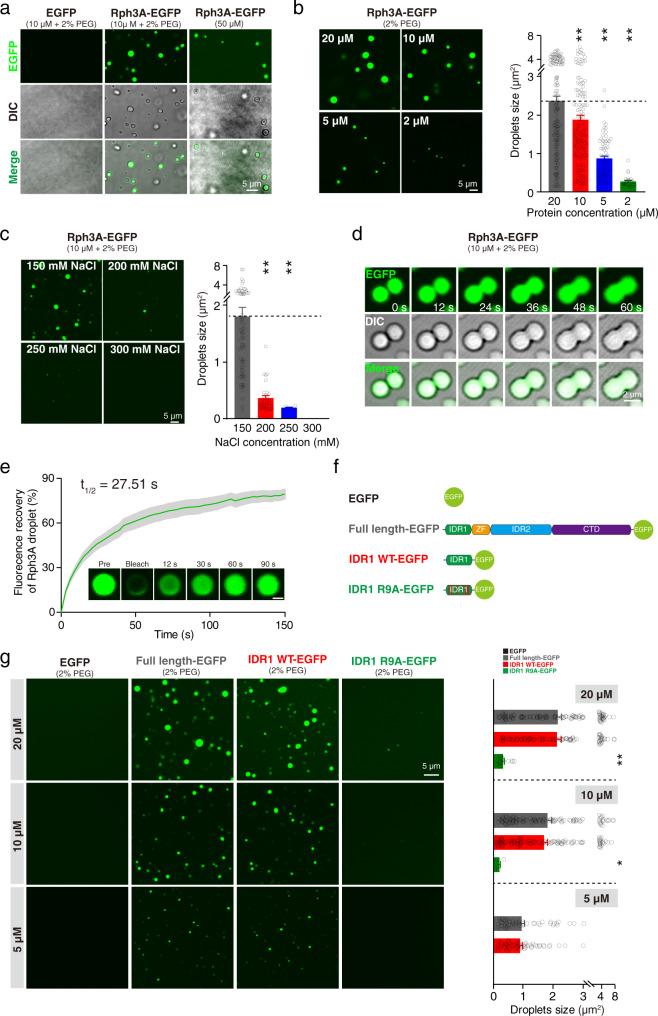
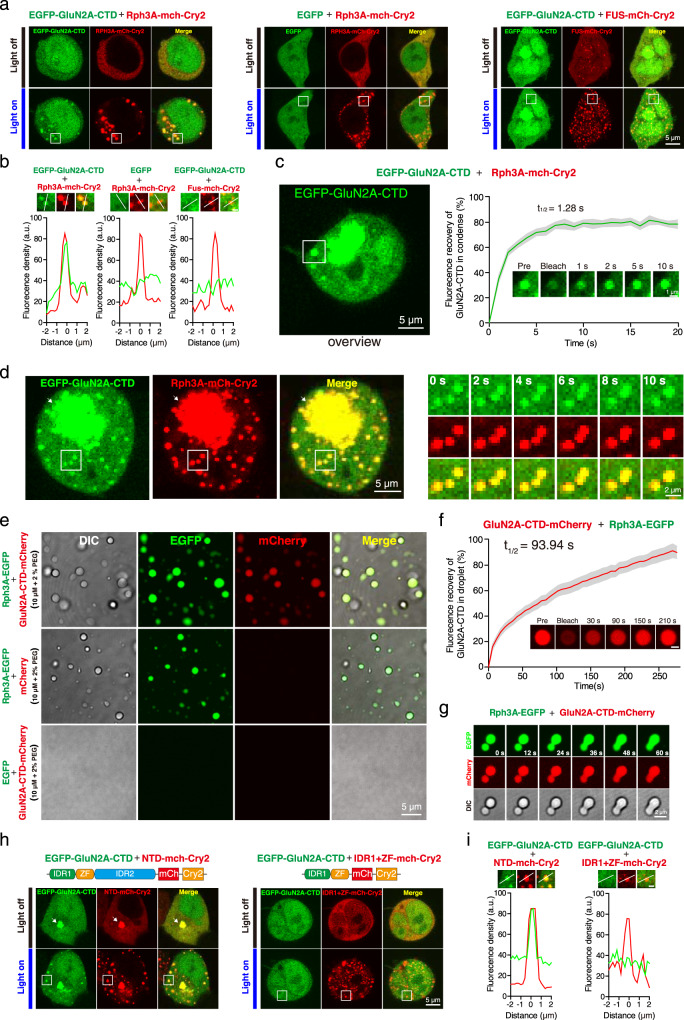
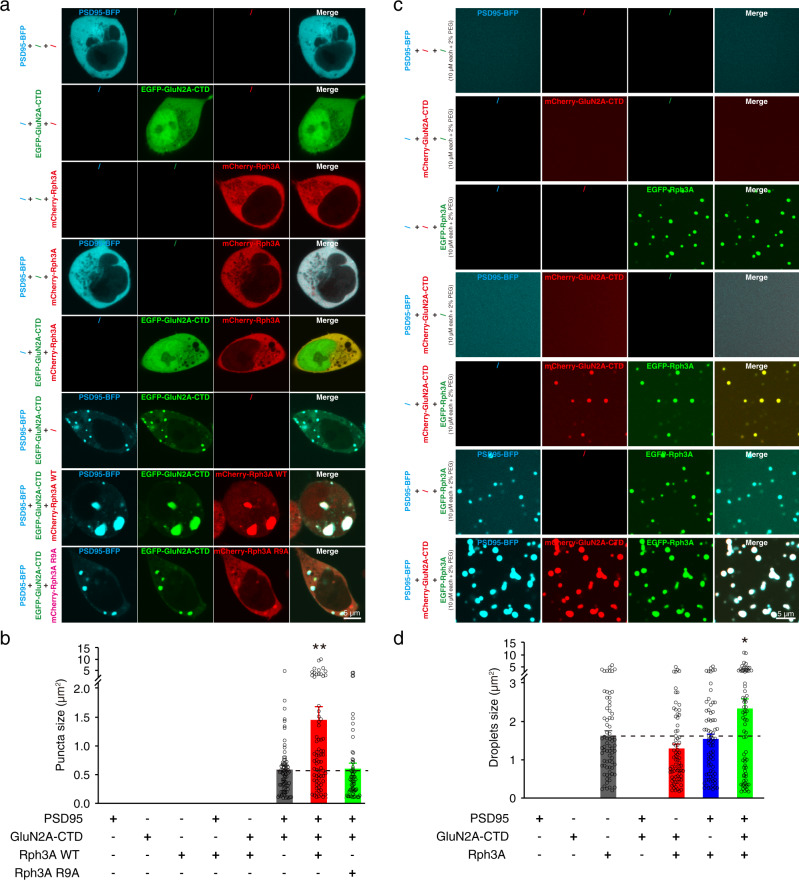
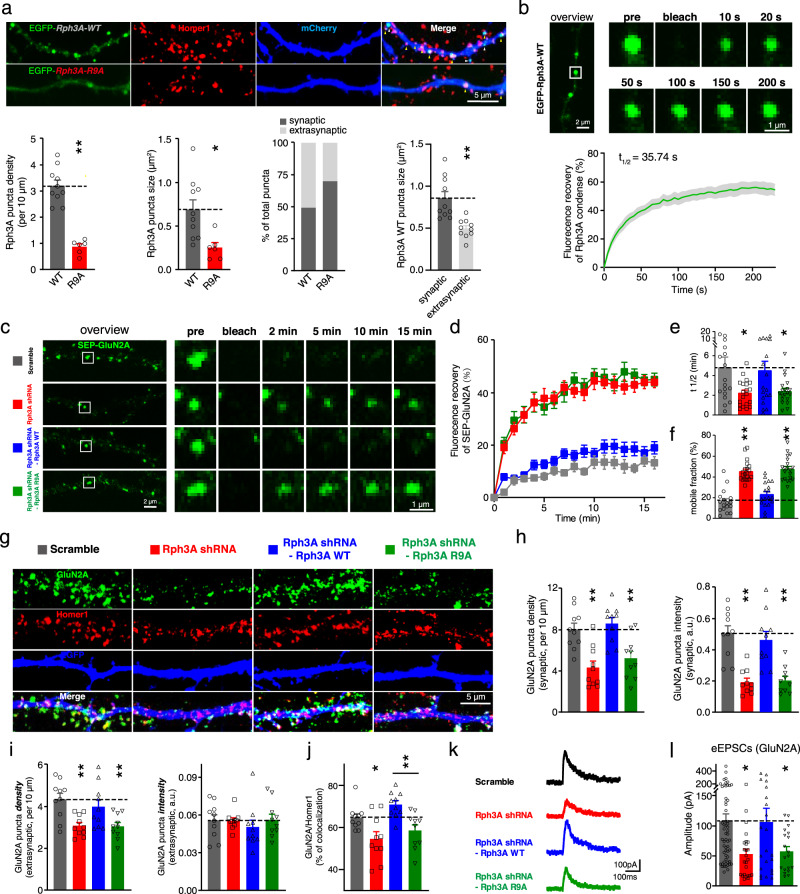
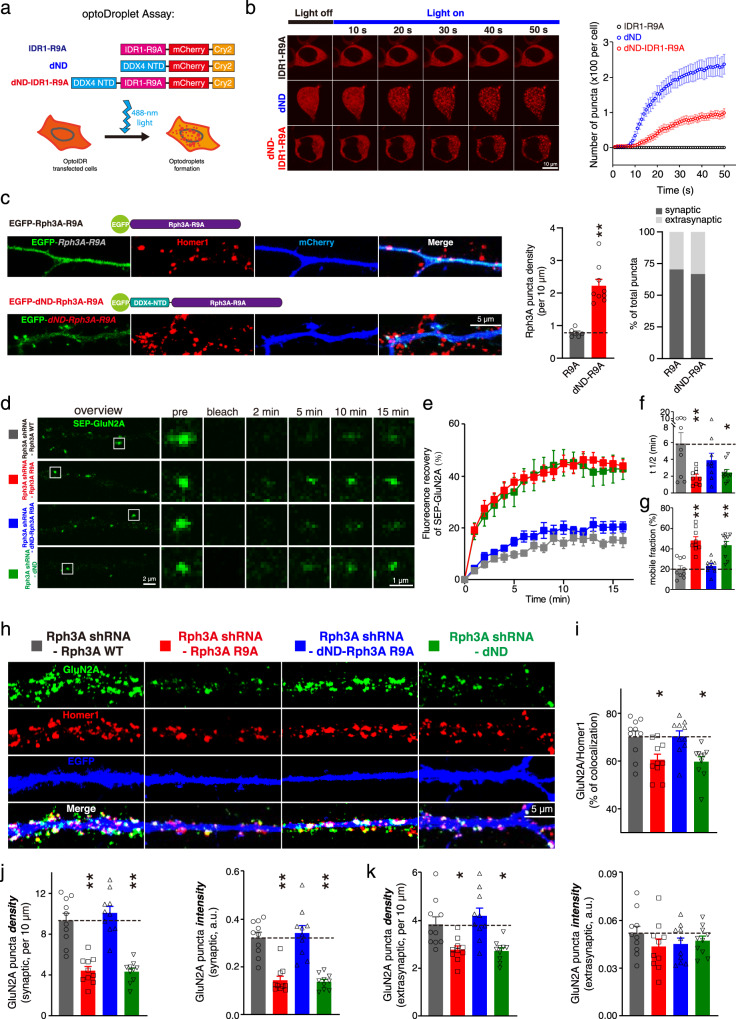
N-methyl-D-aspartate receptors (NMDARs) are essential for excitatory neurotransmission and synaptic plasticity. GluN2A and GluN2B, two predominant Glu2N subunits of NMDARs in the hippocampus and the cortex, display distinct clustered distribution patterns and mobility at synaptic and extrasynaptic sites. However, how GluN2A clusters are specifically organized and stabilized remains poorly understood. Here, we found that the previously reported GluN2A-specific binding partner Rabphilin-3A (Rph3A) has the ability to undergo phase separation, which relies on arginine residues in its N-terminal domain. Rph3A phase separation promotes GluN2A clustering by binding GluN2A's C-terminal domain. A complex formed by Rph3A, GluN2A, and the scaffolding protein PSD95 promoted Rph3A phase separation. Disrupting Rph3A's phase separation suppressed the synaptic and extrasynaptic surface clustering, synaptic localization, stability, and synaptic response of GluN2A in hippocampal neurons. Together, our results reveal the critical role of Rph3A phase separation in determining the organization and stability of GluN2A in the neuronal surface.


Conflict of interest statement

The authors declare no competing interests.

Figures

Fig. 1
Fig. 1. Rph3A forms condensates with liquid properties in living cells.
a Schematic illustration of the optoDroplet assay in HEK293 cells. Candidate genes were fused with mCherry and Cry2. The RNA-binding protein FUS was chosen as a positive control. Unfused mCherry-Cry2 was used as a negative control. Upon blue light exposure, proteins with phase-separation capacity formed condensates in cells. b OptoDroplet assay of Rph3A performed in HEK293 cells. The number of puncta per cell was counted and plotted. Data are displayed as the mean ± SEM (n = 6 cells per group). c Representative images and quantification of fluorescence recovery from the FRAP analysis of Rph3A droplets. The time point of bleaching was 0 s. The data are displayed as the mean ± SEM (n = 6 droplets). d Fusion events of droplets composed of Rph3A-mCherry-Cry2 in HEK293 cells captured by time-series imaging. e Rph3A-mCherry-Cry2 droplets condensed with Rph3A-EGFP after blue light stimulation. FUS and EGFP were substituted for Rph3A as negative controls. f Magnified images, in which the lines indicate the fluorescence intensity profiles of puncta in the white squares in e. Scale bar, 1 μm. g Representative images and quantification of fluorescence recovery from the FRAP analysis of Rph3A-EGFP droplets. The data are displayed as the mean ± SEM (n = 5 droplets). h Fusion events of Rph3A-EGFP and Rph3A-mCherry-Cry2 condensates in HEK293 cells stimulated with blue light. The image of cell at time point 0 s (left) and the magnified time-lapse images of the white squares in left (right) are showed. Source data and of b, c and g are provided in the Source Data file.
Fig. 2
Fig. 2. Arg residues in IDR1 of Rph3A are essential for Rph3A phase separation.
a Graphs showing the intrinsic disorder and domain arrangement of human Rph3A. The y-axis shows the PONDER VSL2 score which indicates the extent of disorder, and the x-axis is the amino acid position. Intrinsically disordered regions (IDRs) are marked in red. The Rph3A amino acid sequence is divided into four parts: IDR1, the zinc finger (ZF) domain, IDR2, and the C-terminal domain (CTD). b, c Representative images and quantification of condensates formed by truncated Rph3A in the optoDroplet assay. The data are displayed as the mean ± SEM (n = 6 cells per group). d Alignment of IDR1 sequences from different species. The conserved Arg residues, marked in green, were mutated to Ala residues (R9A). e Representative images and quantification of condensates formed by WT Rph3A and R9A Rph3A in HEK293 cells. The data are displayed as the mean ± SEM (n = 6 cells per group). Source data of b, c and e are provided in the Source Data file.
Fig. 3
Fig. 3. Rph3A undergoes phase separation in a cell-free system.
a The images of EGFP alone (left), the full-length Rph3A fusion protein at a concentration of 10 μM in buffer containing 2% PEG8000 (middle) or a concentration of 50 μM without the crowding reagent (right). b Representative images and size data for droplets composed of the Rph3A fusion protein at different concentrations. The data are displayed as the mean ± SEM (20 μM: n = 145 droplets; 10 μM: n = 125 droplets; 5 μM: n = 72 droplets; 2 μM: n = 28 droplets, **p < 0.01, one-way ANOVA followed by Tukey’s multiple comparisons test). c Representative images and size data for droplets composed of the Rph3A fusion protein at 10 μM in buffer with different salt concentrations. The data are displayed as the mean ± SEM (150 mM: n = 72 droplets; 200 mM: n = 31 droplets; 250 mM: n = 6 droplets, 300 mM: no droplets, **p < 0.01, one-way ANOVA followed by Tukey’s multiple comparisons test). d Fusion events of droplets formed by the Rph3A fusion protein. Time-lapse images of fusing droplets are showed. e Representative images and quantification of fluorescence recovery from the FRAP analysis of droplets composed of the Rph3A fusion protein. The data are displayed as the mean ± SEM (n = 7 droplets). Scale bar, 1 μm. f Schematic illustration of recombinant Rph3A-EGFP fusion proteins. g Representative images and size data for droplets composed of full-length and truncated Rph3A fusion proteins at different protein concentrations. The data are displayed as the mean ± SEM (20 μM: n = 122 droplets (FL); n = 101 droplets (IDR1); n = 17 droplets (ID1R9A), 10 μM: n = 114 droplets (FL); n = 120 droplets (IDR1); n = 5 droplets (ID1R9A), 5 μM: n = 54 droplets (FL); n = 60 droplets (IDR1); no droplets (ID1R9A), no droplets in EGFP group, *p < 0.05, **p < 0.01, one-way ANOVA followed by Tukey’s multiple comparisons test). Source data and p values of b, c, e and g are provided in the Source Data file.
Fig. 4
Fig. 4. Rph3A condenses with the CTD of GluN2A.
a Rph3A droplets condensed with the CTD of GluN2A in the optoDroplet assay. b Magnified images, in which the lines indicate the fluorescence intensity profiles of condensates in the white squares in a. Scale bar, 1 μm. c Representative images and quantification of fluorescence recovery from the FRAP analysis of GluN2A-CTD condensed with Rph3A droplets. The data are displayed as the mean ± SEM (n = 6 puncta). d Fusion events of GluN2A-CTD condensed with Rph3A droplets in HEK293 cells stimulated with blue light. The image of cell at time point 0 s (left) and the magnified time-lapse images of the white squares in left (right) are showed. The large punctum (white arrow) is occasional preactivation. See also Supplementary Fig. 12. e The recombinant GluN2A-CTD mCherry fusion protein formed droplets with Rph3A-EGFP at a concentration of 10 μM in buffer containing 2% PEG8000 (top) but showed a diffuse distribution in buffer without Rph3A (bottom). The mCherry protein diffused in the presence of Rph3A-EGFP at the same concentration (middle). f Representative images and quantification of fluorescence recovery from the FRAP analysis of droplets composed of GluN2A-CTD in the presence of Rph3A. The data are displayed as the mean ± SEM (n = 8 droplets). Scale bar, 1 μm. g Fusion events of droplets composed of GluN2A-CTD in the presence of Rph3A. Time-lapse images of fusing droplets are showed. h Droplets of Rph3A containing IDR2 condensed with GluN2A-CTD. The big punctum (white arrow) is occasional preactivation foci. See also Supplementary Fig. 12. i Magnified images, in which the lines indicate the fluorescence intensity profiles of condensates in the white squares in h. Scale bar, 1 μm. Source data of c and f are provided in the Source Data file.
Fig. 5
Fig. 5. The GluN2A/PSD95 complex promotes the phase separation of Rph3A.
a Representative images of HEK293 cells transfected with different combinations of PSD95, GluN2A-CTD, WT, and R9A Rph3A. b Sizes of puncta composed of different combinations of the proteins in A. The data are displayed as the mean ± SEM (PSD95/GluN2A-CTD: n = 78 puncta; PSD95/GluN2A-CTD/Rph3A WT: n = 73 puncta; PSD95/GluN2A-CTD/Rph3A R9A: n = 66 puncta, **p < 0.01, one-way ANOVA followed by Tukey’s multiple comparisons test). c Representative images of droplets formed by different combinations of PSD95, GluN2A-CTD, WT, and R9A Rph3A recombinant fusion proteins in a cell-free system. d Sizes of droplets composed of different combinations of proteins in c. The data are displayed as the mean ± SEM (n = 73 droplets for each group, *p < 0.05, one-way ANOVA followed by Tukey’s multiple comparisons test). Source data and p values of b and d are provided in the Source Data file.
Fig. 6
Fig. 6. Disruption of the phase separation capacity of Rph3A influenced the mobility, surface clustering, and synaptic localization of GluN2A in hippocampal neurons.
a Representative images of EGFP-tagged WT and R9A Rph3A at dendrites of hippocampal neurons. Yellow triangles indicate synaptic puncta, and white triangles indicate extrasynaptic puncta of Rph3A. The density, size, and synaptic localization of the puncta of WT and R9A Rph3A, and the sizes of synaptic and extrasynaptic WT Rph3A puncta were also quantified. The data are displayed as the mean ± SEM (WT: n = 10 dendrites from 5 neurons; R9A: n = 6 dendrites from 3 neurons, **p < 0.01, two-tailed unpaired t test). b Representative images and quantification of fluorescence recovery from the FRAP analysis of Rph3A puncta at the dendrites of hippocampal neurons. The data are displayed as the mean ± SEM (n = 11 puncta). c Representative images from the FRAP assay of SEP-GluN2A in Rph3A-knockdown and Rph3A-reexpressing (WT and R9A) hippocampal neurons. d Quantification of the fluorescence recovery shown in c. The data are displayed as the mean ± SEM (Scramble: n = 17 puncta; Rph3A shRNA: 20 puncta; Rph3A shRNA-Rph3A WT: 18 puncta; Rph3A shRNA-Rph3A R9A: 20 puncta). e The recovery rate was calculated as the half-time of the recovery curve. The data are displayed as the mean ± SEM (n numbers are defined in d, *p < 0.05, one-way ANOVA followed by Dunnett’s multiple comparisons test). f The mobile fraction of GluN2A was calculated based on the plateau of the recovery curve. The data are displayed as the mean ± SEM (n numbers are defined in d, **p < 0.01, one-way ANOVA followed by Dunnett’s multiple comparisons test). g Representative images of surface GluN2A and Homer1 staining in Rph3A-knockdown and Rph3A-reexpressing neurons. h-j Quantification of synaptic and extrasynaptic surface GluN2A cluster fluorescence intensity and density and the percentage of synaptic GluN2A clusters. The data are displayed as the mean ± SEM (n = 10 dendrites from 5 neurons for each group, *p < 0.05, **p < 0.01, one-way ANOVA followed by Dunnett’s multiple comparisons test (h, i) or by Tukey’s multiple comparisons test (j)). k Representative trace of NMDA eEPSCs in Rph3A-knockdown and Rph3A-reexpressing neurons. l Quantification of NMDA eEPSCs in Rph3A-knockdown and Rph3A-reexpressing neurons. The data are displayed as the mean ± SEM (Scramble: n = 58 neurons; Rph3A shRNA: 25 neurons; Rph3A shRNA-Rph3A WT: 22 neurons; Rph3A shRNA-Rph3A R9A: 19 neurons, *p < 0.05, one-way ANOVA followed by Dunnett’s multiple comparisons test). The full images of a, b, c, g are showed in Supplementary Fig. 13. Source data and p values of a, b, d, e, f, h, i, j and l are provided in the Source Data file.
Fig. 7
Fig. 7. Restoring phase separation of Rph3A reinstates its effect on surface clustering and mobility of GluN2A.
a Schematic illustration of dND-fused constructs used to restore phase separation of Rph3A. b OptoDroplet assay of indicated constructs in a. The number of puncta per cell was plotted. Data are displayed as the mean ± SEM (dND: n = 7 cells; dND-IDR1-R9A cells: n = 9 cells; IDR1-R9A: n = 6 cells). c Representative images of EGFP-tagged R9A and dND-fused Rph3A R9A at dendrites of hippocampus neurons. The density and synaptic localization of puncta were quantified. The data are displayed as the mean ± SEM (R9A: n = 6 dendrites from 3 neurons; dND-R9A: n = 9 dendrites from 5 neurons, **p < 0.01, two-tailed unpaired t test). d Representative images of the FRAP assay of SEP-GluN2A in Rph3A-knockdown and Rph3A-reexpressing neurons. e Quantification of the fluorescence recovery in d. The data are displayed as the mean ± SEM (Rph3A WT: n = 9 puncta; Rph3A R9A: n = 9 puncta; dND-Rph3A R9A: n = 9 puncta; dND: n = 10 puncta). f The recovery rate of SEP-GluN2A. The data are displayed as the mean ± SEM (n numbers are defined in e, *p < 0.05, **p < 0.01, one-way ANOVA followed by Tukey’s multiple comparisons test). g The mobile fraction of SEP-GluN2A. The data are displayed as the mean ± SEM (n numbers are defined in e, **p < 0.01, one-way ANOVA followed by Tukey’s multiple comparisons test). h Representative images of surface GluN2A and Homer1 staining in Rph3A-knockdown and Rph3A-reexpressing neurons. ik Quantification of the percentage of synaptic GluN2A clusters, synaptic and extra-synaptic surface GluN2A cluster fluorescence intensity and density. The data are displayed as the mean ± SEM (n = 10 dendrites from 5 neurons for each group, *p < 0.05, **p < 0.01, one-way ANOVA followed by Tukey’s multiple comparisons test). The full images of c, d and h are showed in Supplementary Fig. 13. Source data and p values of b, c, e, f, g, i, j and k are provided in the Source Data file.

Similar articles

Cited by

References

    1. Yashiro K, Philpot BD. Regulation of NMDA receptor subunit expression and its implications for LTD, LTP, and metaplasticity. Neuropharmacology. 2008;55:1081–1094. doi: 10.1016/j.neuropharm.2008.07.046. - DOI - PMC - PubMed
    1. Bliss TV, Collingridge GL. A synaptic model of memory: long-term potentiation in the hippocampus. Nature. 1993;361:31–39. doi: 10.1038/361031a0. - DOI - PubMed
    1. Traynelis SF, et al. Glutamate receptor ion channels: structure, regulation, and function. Pharm. Rev. 2010;62:405–496. doi: 10.1124/pr.109.002451. - DOI - PMC - PubMed
    1. Paoletti P. Molecular basis of NMDA receptor functional diversity. Eur. J. Neurosci. 2011;33:1351–1365. doi: 10.1111/j.1460-9568.2011.07628.x. - DOI - PubMed
    1. Monyer H, Burnashev N, Laurie DJ, Sakmann B, Seeburg PH. Developmental and regional expression in the rat brain and functional properties of four NMDA receptors. Neuron. 1994;12:529–540. doi: 10.1016/0896-6273(94)90210-0. - DOI - PubMed

Publication types

MeSH terms

Substances