. 2023 Jan 24;22(1):11.
doi: 10.1186/s12940-022-00951-y.

Prenatal exposure to ambient air pollution is associated with neurodevelopmental outcomes at 2 years of age

Affiliations

Prenatal exposure to ambient air pollution is associated with neurodevelopmental outcomes at 2 years of age

Zachariah E M Morgan et al. Environ Health. .

Abstract

Background: Higher prenatal ambient air pollution exposure has been associated with impaired neurodevelopment in preschoolers and school-aged children. The purpose of this study was to explore the relationships between prenatal ambient air pollution exposure and neurodevelopment during infancy.

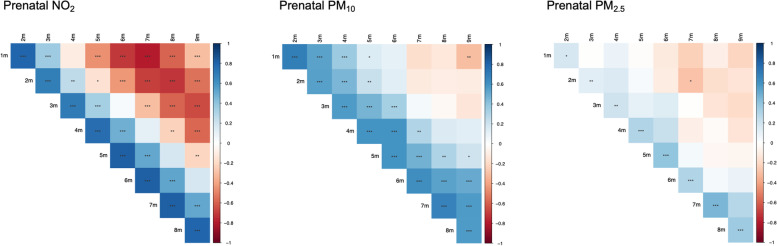
Methods: This study examined 161 Latino mother-infant pairs from the Southern California Mother's Milk Study. Exposure assessments included prenatal nitrogen dioxide (NO2) and particulate matter smaller than 2.5 and 10 microns in diameter (PM2.5 and PM10, respectively). The pregnancy period was also examined as three windows, early, mid, and late, which describe the first, middle, and last three months of pregnancy. Infant neurodevelopmental outcomes at 2 years of age were measured using the Bayley-III Scales of Infant and Toddler Development. Multivariable linear models and distributed lag linear models (DLM) were used to examine relationships between prenatal exposures and neurodevelopmental scores, adjusting for socioeconomic status, breastfeeding frequency, time of delivery, pre-pregnancy body mass index, and infant birthweight and sex.

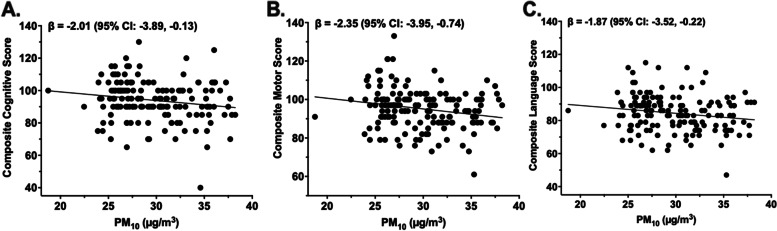
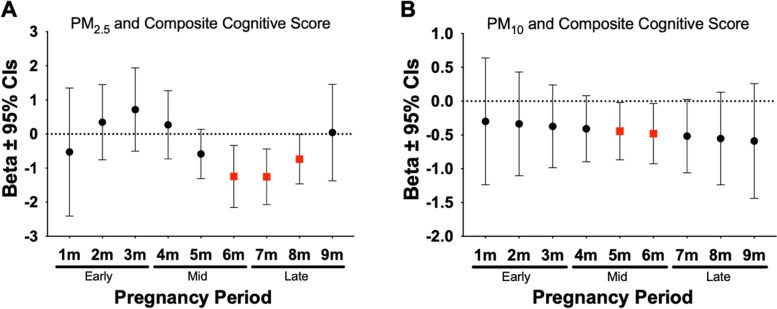
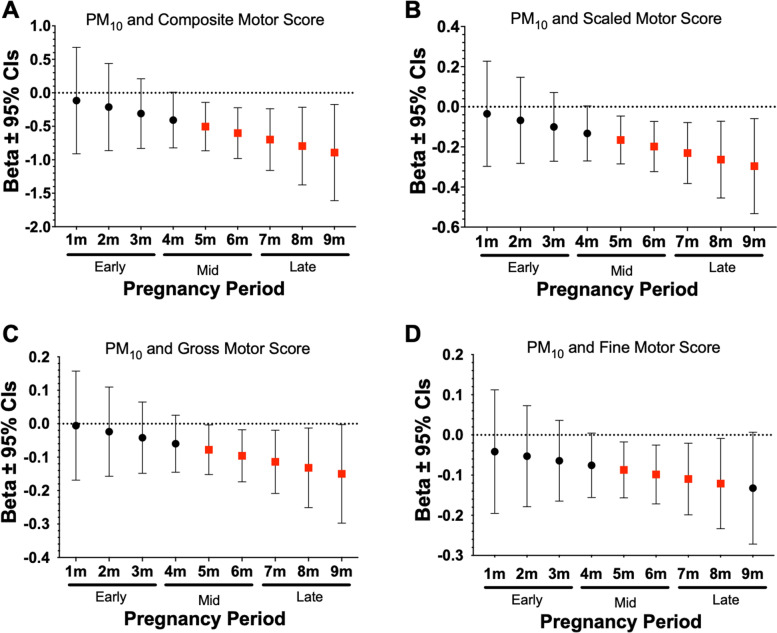
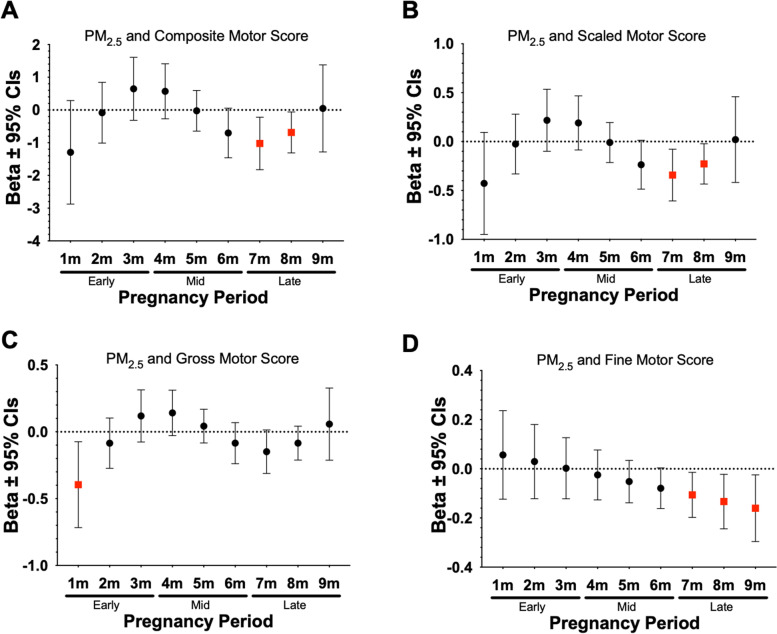
Results: Higher prenatal exposure to PM10 and PM2.5 was negatively associated with composite cognitive score (β = -2.01 [-3.89, -0.13] and β = -1.97 [-3.83, -0.10], respectively). In addition, higher average prenatal exposure to PM10 was negatively associated with composite motor (β = -2.35 [-3.95, -0.74]), scaled motor (β = -0.77 [-1.30, -0.24]), gross motor (β = -0.37 [-0.70, -0.04]), fine motor (β = -0.40 [-0.71, -0.09]), composite language (β = -1.87 [-3.52, -0.22]), scaled language (β = -0.61 [-1.18, -0.05]) and expressive communication scaled scores (β = -0.36 [-0.66, -0.05]). DLMs showed that higher prenatal air pollution exposure during mid and late pregnancy was inversely associated with motor, cognitive, and communication language scores.

Conclusions: Higher exposure to air pollutants during pregnancy, particularly in the mid and late prenatal periods, was inversely associated with scaled and composite motor, cognitive, and language scores at 2 years. These results indicate that prenatal ambient air pollution may negatively impact neurodevelopment in early life.

Keywords: Air Pollution; Child Development; Health Disparities; Neurodevelopment; Pregnancy Exposures.


Conflict of interest statement

Michael I. Goran receives book royalties. Michael I. Goran is a scientific advisor for Yumi. The other authors declare they have no actual or potential competing financial interests.

Figures

Fig. 1
Fig. 1
Correlations Among Exposure Windows During the 9-Month Pregnancy Period. Figures show the Spearman correlation structure among individual monthly lags of prenatal ambient air pollution exposure for NO2 (left), PM10 (middle), and PM2.5 (right). Blue colors indicate positive correlations while red colors indicate negative correlations. Statistical significance is denoted as *p < 0.05, **p < 0.01, and ***p < 0.001, respectively
Fig. 2
Fig. 2
Associations Between Prenatal PM10 Exposure and Composite Cognitive, Motor, and Language Scores at 2 Years. Average prenatal exposure to PM10 (µg/m3) was inversely associated with composite cognitive score (A), composite motor score (B), and composite language score (C). Unadjusted plots and regression lines for neurodevelopmental scores and prenatal PM10 are shown. Figures show betas (β) and 95% confidence intervals (CIs) that were scaled to a 1SD difference in exposure (SD NO2 = 2.43 ppb, SD PM10 = 3.94 µg/m3, SD PM2.5 = 1.24 µg/m3) from multivariable linear regression models that adjusted for socioeconomic status (SES), breast feedings per day, gestational age, pre-pregnancy BMI, infant birthweight, and infant sex
Fig. 3
Fig. 3
Associations Between PM10 and PM2.5 Exposure During Mid to Late Pregnancy and Composite Cognitive Scores at 2 Years. Figures show effect sizes and 95% confidence intervals (CI) at each monthly lag of exposure during the pregnancy period. Results were obtained from distributed lag models (DLMs) that adjusted for socioeconomic status (SES), breast feedings per day, gestational age, pre-pregnancy BMI, infant birthweight, and infant sex. Panels show associations between PM2.5 and composite cognitive score (A), PM10 and composite cognitive score (B). Effect sizes are scaled by the IQR of each respective pollutant (PM10 = 8 µg/m3, PM2.5 = 3 µg/m3). Statistically significant windows are denoted by red squares (p < 0.05)
Fig. 4
Fig. 4
Associations Between PM10 Exposure During Mid and Late Pregnancy and Motor Scores at 2 Years. Figures show effect sizes and 95% confidence intervals (CI) at each monthly lag of exposure during the pregnancy period. Results were obtained from distributed lag models (DLMs) that adjusted for socio-economic status, breast feedings per day, gestational age, pre-pregnancy BMI, infant birthweight, and infant sex. Panels show associations between PM10 and composite motor score (A), scaled motor score (B), gross motor score (C) and fine motor score (D). Effect sizes are scaled by the IQR (PM10 = 8 µg/m3). Statistically significant windows are shown in red (p < 0.05)
Fig. 5
Fig. 5
Associations between PM2.5 Exposure During Mid to Late Pregnancy and Motor Scores at 2 Years. Figures show effect sizes and 95% confidence intervals (CI) at each monthly lag of exposure during the pregnancy period. Results were obtained from distributed lag models (DLMs) that adjusted for socio-economic status, breast feedings per day, gestational age, pre-pregnancy BMI, infant birthweight, and infant sex. Panels show associations between PM2.5 and composite motor score (A), scaled motor score (B), and fine motor score (C). Effect sizes are scaled by the IQR (PM2.5 = 3 µg/m3). Statistically significant windows are shown in red (p < 0.05)

References

    1. World Health Organization. WHO global air quality guidelines: particulate matter (PM2.5 and PM10), ozone, nitrogen dioxide, sulfur dioxide and carbon monoxide. World Health Organization; 2021. https://apps.who.int/iris/handle/10665/345329. License: CC BY-NC-SA 3.0 IGO - PubMed
    1. Liu J, et al. Disparities in Air Pollution Exposure in the United States by Race/Ethnicity and Income, 1990–2010. Environ Health Perspect. 2021;129:127005. - PMC - PubMed
    1. Hajat A, Hsia C, O’Neill MS. Socioeconomic Disparities and Air Pollution Exposure: A Global Review. Curr Environ Health Rep. 2015;2:440–450. doi: 10.1007/s40572-015-0069-5. - DOI - PMC - PubMed
    1. Tessum C, et al. Inequity in consumption of goods and services adds to racial–ethnic disparities in air pollution exposure. Proc Natl Acad Sci. 2019;116:201818859. doi: 10.1073/pnas.1818859116. - DOI - PMC - PubMed
    1. Almetwally AA, Bin-Jumah M, Allam AA. Ambient air pollution and its influence on human health and welfare: an overview. Environ Sci Pollut Res. 2020;27:24815–24830. doi: 10.1007/s11356-020-09042-2. - DOI - PubMed

Publication types