

The relationship between self-reported physical frailty and sensor-based physical activity measures in older adults - a multicentric cross-sectional study
- PMID: 36694172
- PMCID: PMC9875425
- DOI: 10.1186/s12877-022-03711-2
The relationship between self-reported physical frailty and sensor-based physical activity measures in older adults - a multicentric cross-sectional study
Abstract
Background: The decline in everyday life physical activity reflects and contributes to the frailty syndrome. While especially self-reported frailty assessments have the advantage of reaching large groups at low costs, little is known about the relationship between the self-report and objective measured daily physical activity behavior. The main objective was to evaluate whether and to what extent a self-reported assessment of frailty is associated with daily physical activity patterns.
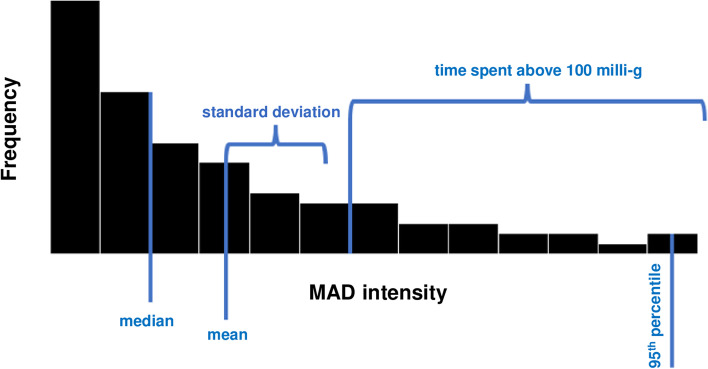
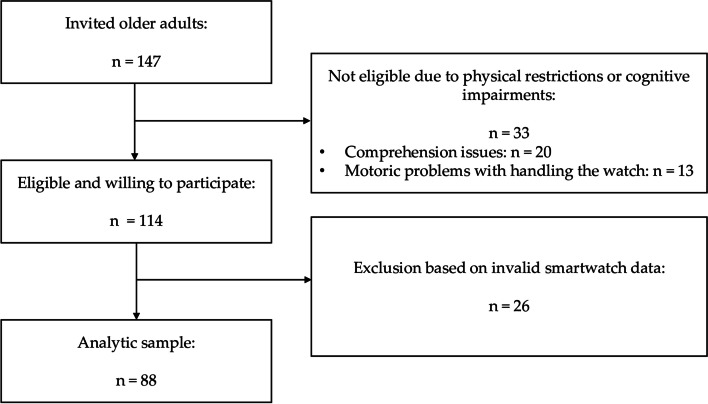
Methods: Daily activity data were obtained from 88 elderly participants (mean 80.6 ± 9.1 years) over up to 21 days. Acceleration data were collected via smartwatch. According to the results of a self-report frailty questionnaire, participants were retrospectively split up into three groups, F (frail, n = 43), P (pre-frail, n = 33), and R (robust, n = 12). Gait- and activity-related measures were derived from the built-in step detector and acceleration sensor and comprised, i.a., standard deviation of 5-s-mean amplitude deviation (MADstd), median MAD (MADmedian), and the 95th percentile of cadence (STEP95). Parameters were fed into a PCA and component scores were used to derive behavioral clusters.
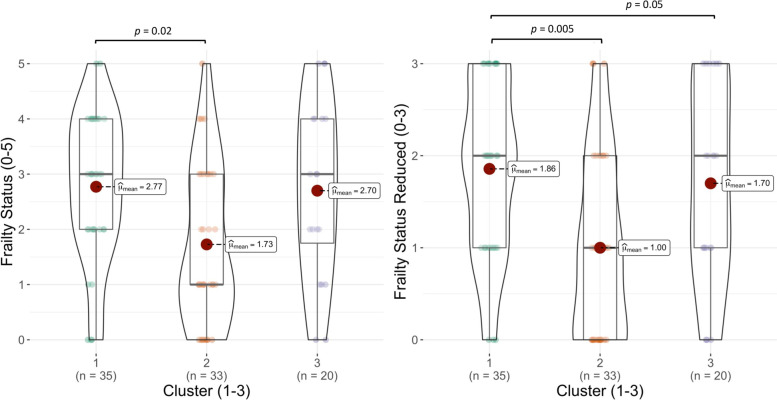
Results: The PCA suggested two components, one describing gait and one upper limb activity. Mainly gait related parameters showed meaningful associations with the self-reported frailty score (STEP95: R2 = 0.25), while measures of upper limb activity had lower coefficients (MADmedian: R2 = 0.07). Cluster analysis revealed two clusters with low and relatively high activity in both dimensions (cluster 2 and 3). Interestingly, a third cluster (cluster 1) was characterized by high activity and low extent of ambulation. Comparisons between the clusters showed significant differences between activity, gait, age, sex, number of chronic diseases, health status, and walking aid. Particularly, cluster 1 contained a higher number of female participants, whose self-reports tended towards a low health status, the frequent use of a walking aid, and a higher score related to frailty questions.
Conclusions: The results demonstrate that subjective frailty assessments may be a simple first screening approach. However, especially older women using walking aids may classify themselves as frail despite still being active. Therefore, the results of self-reports may be particularly biased in older women.
Keywords: Accelerometry; Actigraphy; Ageing; Assessment; Frailty; Physical activity; Self-report.
© 2023. The Author(s).
Conflict of interest statement
The authors declare that they have no competing interests.
Figures


Similar articles
-
Agreement between standard and self-reported assessments of physical frailty syndrome and its components in a registry of community-dwelling older adults.BMC Geriatr. 2022 Aug 25;22(1):705. doi: 10.1186/s12877-022-03376-x. BMC Geriatr. 2022. PMID: 36008767 Free PMC article.
-
Monitoring Gait and Physical Activity of Elderly Frail Individuals in Free-Living Environment: A Feasibility Study.Gerontology. 2024;70(4):439-454. doi: 10.1159/000535283. Epub 2023 Nov 20. Gerontology. 2024. PMID: 37984340 Free PMC article.
-
Sensor-based characterization of daily walking: a new paradigm in pre-frailty/frailty assessment.BMC Geriatr. 2020 May 6;20(1):164. doi: 10.1186/s12877-020-01572-1. BMC Geriatr. 2020. PMID: 32375700 Free PMC article.
-
Technology-based measurements for screening, monitoring and preventing frailty.Z Gerontol Geriatr. 2016 Oct;49(7):581-595. doi: 10.1007/s00391-016-1129-7. Epub 2016 Sep 16. Z Gerontol Geriatr. 2016. PMID: 27637581 Review. English.
-
A review of utility of wearable sensor technologies for older person frailty assessment.Exp Gerontol. 2025 Feb;200:112668. doi: 10.1016/j.exger.2024.112668. Epub 2025 Jan 7. Exp Gerontol. 2025. PMID: 39733783 Review.
Cited by
-
The association of upper limb sensorimotor capacity, everyday inpatient behavior, and the effects of neurorehabilitation in persons with multiple sclerosis and stroke: a mixed-design study.J Neuroeng Rehabil. 2025 Mar 5;22(1):49. doi: 10.1186/s12984-025-01586-z. J Neuroeng Rehabil. 2025. PMID: 40045323 Free PMC article.
-
Effect of a home-based physical rehabilitation program via virtual reality on the functional outcomes of frail older adults: a quasi-experimental study.Sci Rep. 2025 Feb 4;15(1):4180. doi: 10.1038/s41598-025-88225-8. Sci Rep. 2025. PMID: 39905167 Free PMC article.
-
The Pharmacists of Physical Activity: Physiotherapists Empowering Older Adults' Autonomy in the Self-Management of Aging with and Without Persistent Conditions.Healthcare (Basel). 2025 Apr 6;13(7):834. doi: 10.3390/healthcare13070834. Healthcare (Basel). 2025. PMID: 40218131 Free PMC article.
-
Knowledge, attitude, and practice toward lung cancer risk among offspring of lung cancer patients: a cross-sectional study.Sci Rep. 2024 Aug 3;14(1):18003. doi: 10.1038/s41598-024-69142-8. Sci Rep. 2024. PMID: 39097631 Free PMC article.
-
Gait parameters and daily physical activity for distinguishing pre-frail, frail, and non-frail older adults: A scoping review.J Nutr Health Aging. 2025 Jul;29(7):100580. doi: 10.1016/j.jnha.2025.100580. Epub 2025 May 14. J Nutr Health Aging. 2025. PMID: 40373391 Free PMC article.
References
Publication types
MeSH terms
LinkOut - more resources
Full Text Sources
