

Concordance between cancer gene alterations in tumor and circulating tumor DNA correlates with poor survival in a real-world precision-medicine population
- PMID: 36694946
- PMCID: PMC10483598
- DOI: 10.1002/1878-0261.13383
Concordance between cancer gene alterations in tumor and circulating tumor DNA correlates with poor survival in a real-world precision-medicine population
Abstract
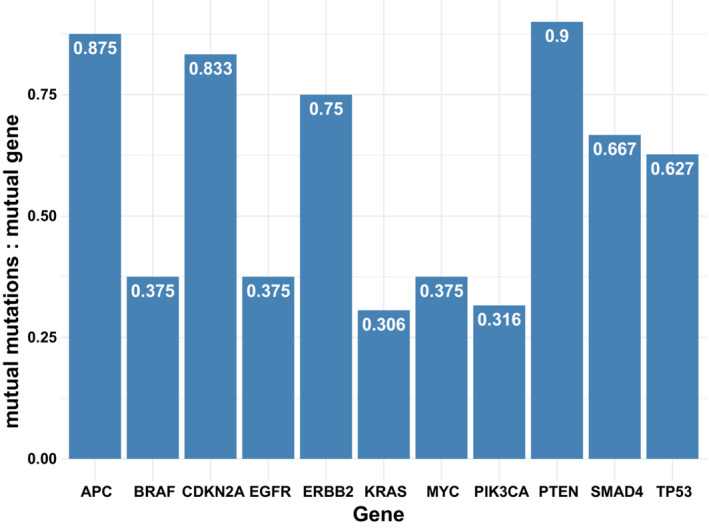
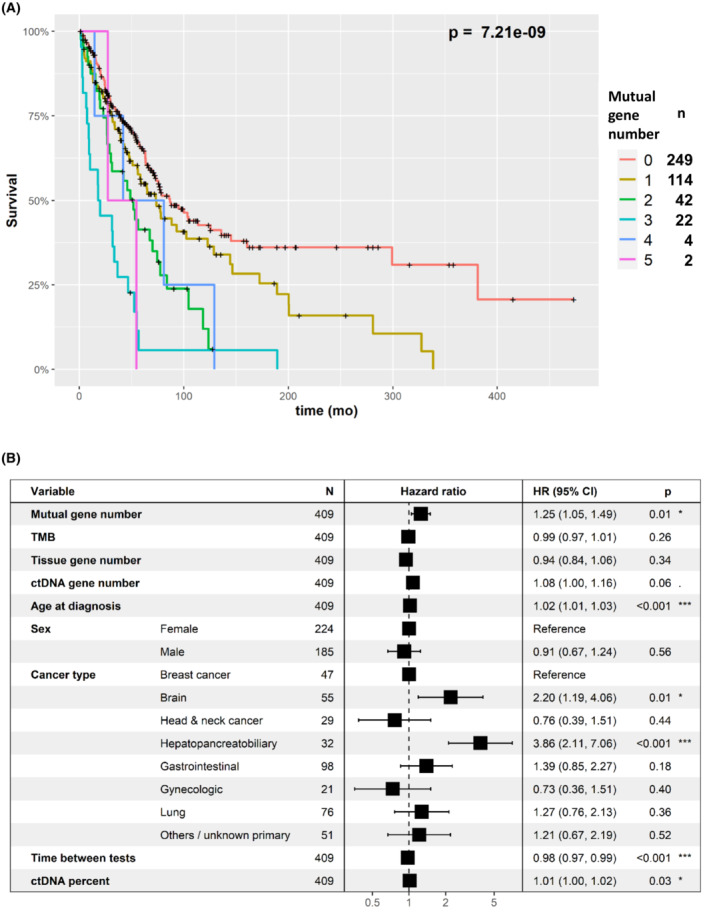
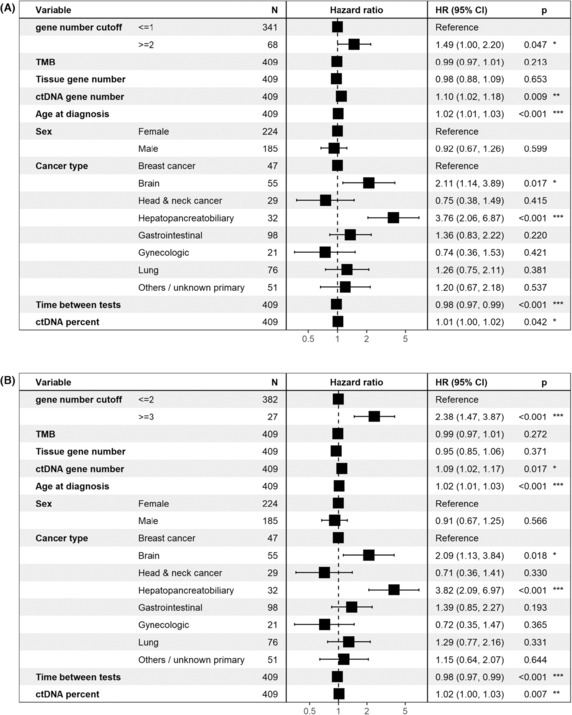
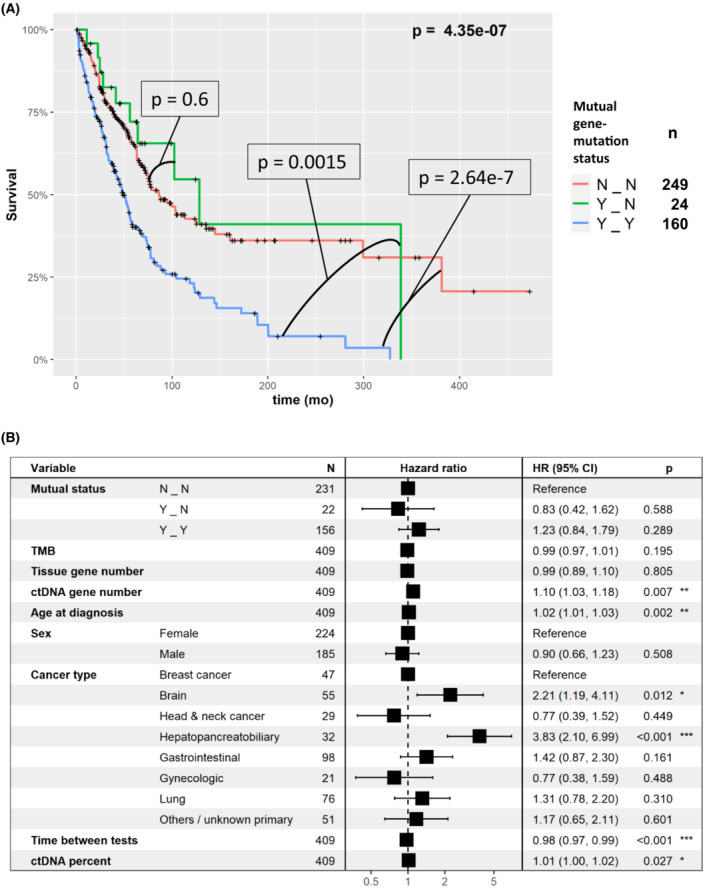
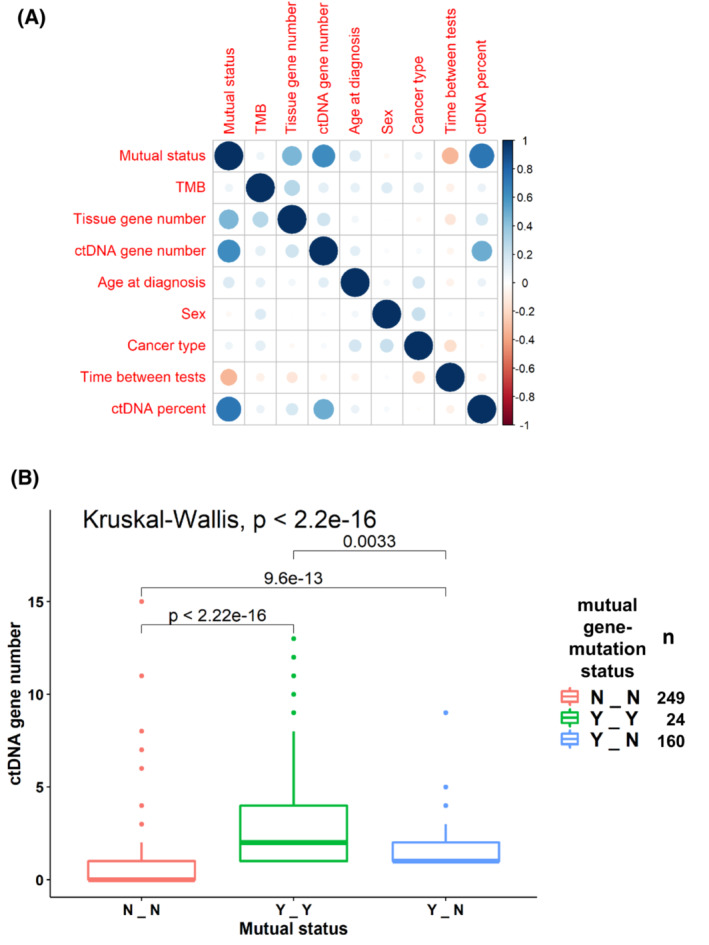
Genomic analysis, performed on tumoral tissue DNA and on circulating tumor DNA (ctDNA) from blood, is the cornerstone of precision cancer medicine. Herein, we characterized the clinical prognostic implications of the concordance of alterations in major cancer genes between tissue- and blood-derived DNA in a pan-cancer cohort. The molecular profiles of both liquid (Guardant Health) and tissue (Foundation Medicine) biopsies from 433 patients were analyzed. Mutations and amplifications of cancer genes scored by these two tests were assessed. In 184 (42.5%) patients, there was at least one mutual gene alteration. The mean number of mutual gene-level alterations in the samples was 0.67 per patient (range: 0-5). A higher mutual gene-level alteration number correlated with shorter overall survival (OS). As confirmed in multivariable analysis, patients with ≥2 mutual gene-level alterations in blood and tissue had a hazard ratio (HR) of death of 1.49 (95% confidence interval [CI]=1-2.2; P=0.047), whereas patients with ≥3 mutual gene-level alterations had an HR of death 2.38 (95% CI=1.47-3.87; P=0.0005). Together, our results show that gene-level concordance between tissue DNA and ctDNA analysis is prevalent and is an independent factor predicting significantly shorter patient survival.
Keywords: cancer; circulating DNA; genomics; survival; tissue DNA.
© 2023 The Authors. Molecular Oncology published by John Wiley & Sons Ltd on behalf of Federation of European Biochemical Societies.
Conflict of interest statement
Razelle Kurzrock receives research funding from Genentech, Merck Serono, Pfizer, Boehringer Ingelheim, TopAlliance, Takeda, Incyte, Debiopharm, Medimmune, Sequenom, Foundation Medicine, Konica Minolta, Grifols, Omniseq, and Guardant, as well as consultant and/or speaker fees and/or advisory board for X‐Biotech, Neomed, Pfizer, Actuate Therapeutics, Roche, Turning Point Therapeutics, TD2/Volastra, Bicara Therapeutics, Inc.; has an equity interest in IDbyDNA and CureMatch Inc.; serves on the Board of CureMatch and CureMetrix, and is a co‐founder of CureMatch. Scott M. Lippman serves on the Board of Biological Dynamics, and is a co‐founder of io9. Shumei Kato serves as a consultant for Medpace, Foundation Medicine, NeoGenomics and CureMatch. He receives speaker's fee from Roche and Bayer, and advisory board for Pfizer. He has research funding from ACT Genomics, Sysmex, Konica Minolta, OmniSeq and Personalis. Shai Rosenberg is a medical and scientific consultant of Barcode and Oncotest companies, he receives research funding from MSD.
Figures
Similar articles
-
Clinical correlates of blood-derived circulating tumor DNA in pancreatic cancer.J Hematol Oncol. 2019 Dec 4;12(1):130. doi: 10.1186/s13045-019-0824-4. J Hematol Oncol. 2019. PMID: 31801585 Free PMC article.
-
Survival Implications of the Relationship between Tissue versus Circulating Tumor DNA TP53 Mutations-A Perspective from a Real-World Precision Medicine Cohort.Mol Cancer Ther. 2020 Dec;19(12):2612-2620. doi: 10.1158/1535-7163.MCT-20-0097. Epub 2020 Sep 30. Mol Cancer Ther. 2020. PMID: 32999047
-
Preoperative Circulating Tumor DNA in Patients with Peritoneal Carcinomatosis is an Independent Predictor of Progression-Free Survival.Ann Surg Oncol. 2018 Aug;25(8):2400-2408. doi: 10.1245/s10434-018-6561-z. Epub 2018 Jun 14. Ann Surg Oncol. 2018. PMID: 29948422 Free PMC article.
-
Association of Circulating Tumor DNA With Disease-Free Survival in Breast Cancer: A Systematic Review and Meta-analysis.JAMA Netw Open. 2020 Nov 2;3(11):e2026921. doi: 10.1001/jamanetworkopen.2020.26921. JAMA Netw Open. 2020. PMID: 33211112 Free PMC article.
-
Whole exome sequencing of cell-free DNA - A systematic review and Bayesian individual patient data meta-analysis.Cancer Treat Rev. 2020 Feb;83:101951. doi: 10.1016/j.ctrv.2019.101951. Epub 2019 Dec 13. Cancer Treat Rev. 2020. PMID: 31874446
Cited by
-
Cell-free tumor DNA analysis in advanced or metastatic breast cancer patients: mutation frequencies, testing intention, and clinical impact.Precis Clin Med. 2024 Dec 24;8(1):pbae034. doi: 10.1093/pcmedi/pbae034. eCollection 2025 Mar. Precis Clin Med. 2024. PMID: 39839709 Free PMC article.
References
Publication types
MeSH terms
Substances
Grants and funding
LinkOut - more resources
Full Text Sources
Medical
Research Materials
