

The evolution of age-specific resistance to infectious disease
- PMID: 36695037
- PMCID: PMC9874267
- DOI: 10.1098/rspb.2022.2000
The evolution of age-specific resistance to infectious disease
Abstract
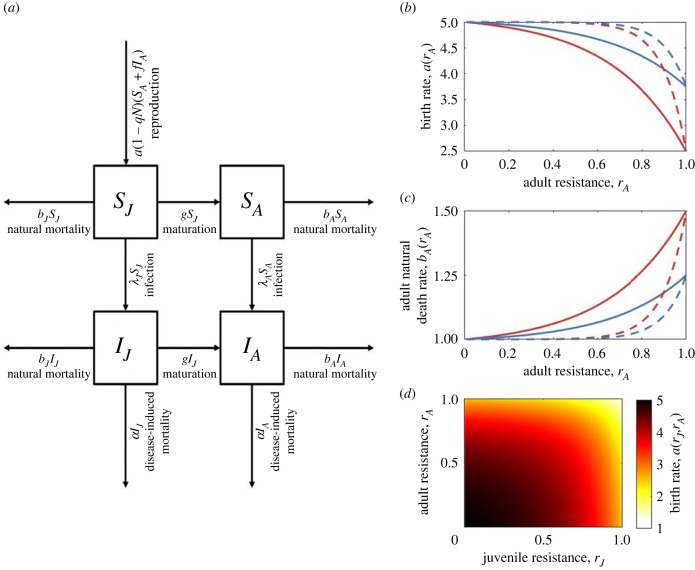
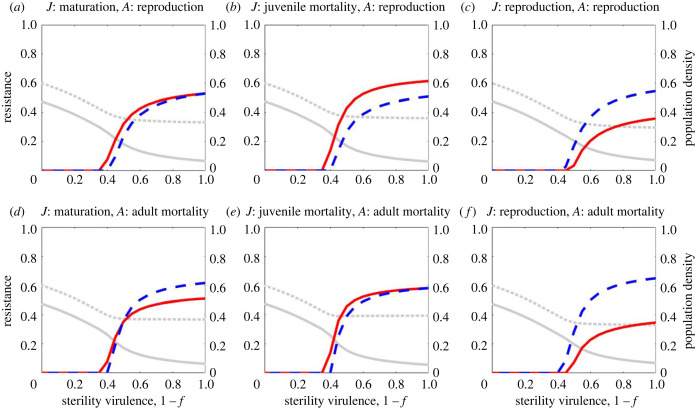
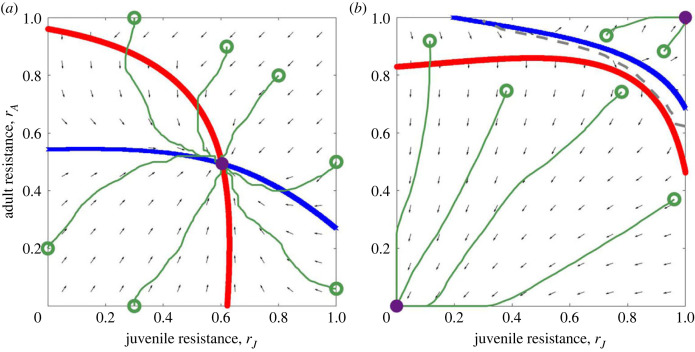
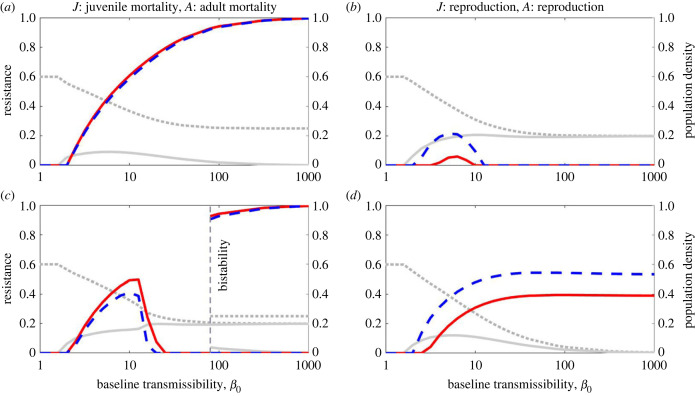
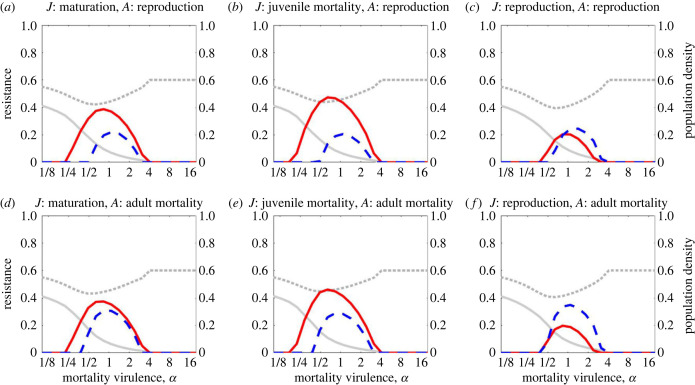
Innate, infection-preventing resistance often varies between host life stages. Juveniles are more resistant than adults in some species, whereas the opposite pattern is true in others. This variation cannot always be explained by prior exposure or physiological constraints and so it has been hypothesized that trade-offs with other life-history traits may be involved. However, little is known about how trade-offs between various life-history traits and resistance at different life stages affect the evolution of age-specific resistance. Here, we use a mathematical model to explore how trade-offs with natural mortality, reproduction and maturation combine to affect the evolution of resistance at different life stages. Our results show that certain combinations of trade-offs have substantial effects on whether adults or juveniles are more resistant, with trade-offs between juvenile resistance and adult reproduction inherently more costly than trade-offs involving maturation or mortality (all else being equal), resulting in consistent evolution of lower resistance at the juvenile stage even when infection causes a lifelong fecundity reduction. Our model demonstrates how the differences between patterns of age-structured resistance seen in nature may be explained by variation in the trade-offs involved and our results suggest conditions under which trade-offs tend to select for lower resistance in juveniles than adults.
Keywords: adult; juvenile; parasite; pathogen; resistance; susceptibility.
Conflict of interest statement
We declare we have no competing interests.
Figures
Similar articles
-
The Evolution of the Age of Onset of Resistance to Infectious Disease.Bull Math Biol. 2023 Apr 15;85(5):42. doi: 10.1007/s11538-023-01144-5. Bull Math Biol. 2023. PMID: 37060428 Free PMC article.
-
The evolution of juvenile susceptibility to infectious disease.Proc Biol Sci. 2018 Jun 27;285(1881):20180844. doi: 10.1098/rspb.2018.0844. Proc Biol Sci. 2018. PMID: 29925619 Free PMC article.
-
Density Dependence Shapes Life-History Trade-Offs in a Food-Limited Population.Ecol Lett. 2024 Nov;27(11):e14551. doi: 10.1111/ele.14551. Ecol Lett. 2024. PMID: 39623728
-
The role of fecundity and reproductive effort in defining life-history strategies of North American freshwater mussels.Biol Rev Camb Philos Soc. 2013 Aug;88(3):745-66. doi: 10.1111/brv.12028. Epub 2013 Feb 28. Biol Rev Camb Philos Soc. 2013. PMID: 23445204 Review.
-
Testosterone mediates life-history trade-offs in female mammals.Biol Rev Camb Philos Soc. 2025 Apr;100(2):871-891. doi: 10.1111/brv.13166. Epub 2024 Nov 14. Biol Rev Camb Philos Soc. 2025. PMID: 39542451 Free PMC article. Review.
Cited by
-
Individual heterogeneity in ixodid tick infestation and prevalence of Borrelia burgdorferi sensu lato in a northern community of small mammalian hosts.Oecologia. 2023 Dec;203(3-4):421-433. doi: 10.1007/s00442-023-05476-w. Epub 2023 Nov 13. Oecologia. 2023. PMID: 37955713 Free PMC article.
-
Disease resistance is more costly at younger ages: An explanation for the maintenance of juvenile susceptibility in a wild plant.Proc Natl Acad Sci U S A. 2025 Apr 8;122(14):e2419192122. doi: 10.1073/pnas.2419192122. Epub 2025 Apr 4. Proc Natl Acad Sci U S A. 2025. PMID: 40184176
-
Coevolution of Age-Structured Tolerance and Virulence.Bull Math Biol. 2024 Apr 25;86(6):62. doi: 10.1007/s11538-024-01292-2. Bull Math Biol. 2024. PMID: 38662120 Free PMC article.
-
The Evolution of the Age of Onset of Resistance to Infectious Disease.Bull Math Biol. 2023 Apr 15;85(5):42. doi: 10.1007/s11538-023-01144-5. Bull Math Biol. 2023. PMID: 37060428 Free PMC article.
-
Transcriptional and hormonal profiling uncovers the interactions between plant developmental stages and RNA virus infection.J Gen Virol. 2024 Sep;105(9):002023. doi: 10.1099/jgv.0.002023. J Gen Virol. 2024. PMID: 39292505
References
-
- Altizer S, Davis AK, Cook KC, Cherry JJ. 2004. Age, sex, and season affect the risk of mycoplasmal conjunctivitis in a southeastern house finch population. Can. J. Zool. 82, 755-763. (10.1139/Z04-050) - DOI
-
- Miller ME. 1983. Relationships between onion leaf age and susceptibility to Alternaria porri. Plant Dis. 67, 284. (10.1094/PD-67-284) - DOI
-
- Panter SN, Jones DA. 2002. Age-related resistance to plant pathogens. Adv. Bot. Res. 38, 251-280. (10.1016/S0065-2296(02)38032-7) - DOI
Publication types
MeSH terms
Associated data
Grants and funding
LinkOut - more resources
Full Text Sources
Medical
