. 2023 Mar;16(3):e009871.
doi: 10.1161/CIRCHEARTFAILURE.122.009871. Epub 2023 Jan 25.

Mechanical Dyssynchrony of Isolated Left and Right Ventricular Human Myocardium in End-Stage Heart Failure

Affiliations

Mechanical Dyssynchrony of Isolated Left and Right Ventricular Human Myocardium in End-Stage Heart Failure

Mohammed A Mashali et al. Circ Heart Fail. 2023 Mar.

Abstract

Background: The left and right ventricles of the human heart differ in embryology, shape, thickness, and function. Ventricular dyssynchrony often occurs in cases of heart failure. Our objectives were to assess whether differences in contractile properties exist between the left and right ventricles and to evaluate signs of left/right ventricular mechanical synchrony in isolated healthy and diseased human myocardium.

Methods: Myocardial left and right ventricular trabeculae were dissected from nonfailing and end-stage failing human hearts. Baseline contractile force and contraction/relaxation kinetics of the left ventricle were compared to those of the right ventricle in the nonfailing group (n=41) and in the failing group (n=29). Correlation analysis was performed to assess the mechanical synchrony between left and right ventricular myocardium isolated from the same heart, in nonfailing (n=41) and failing hearts (n=29).

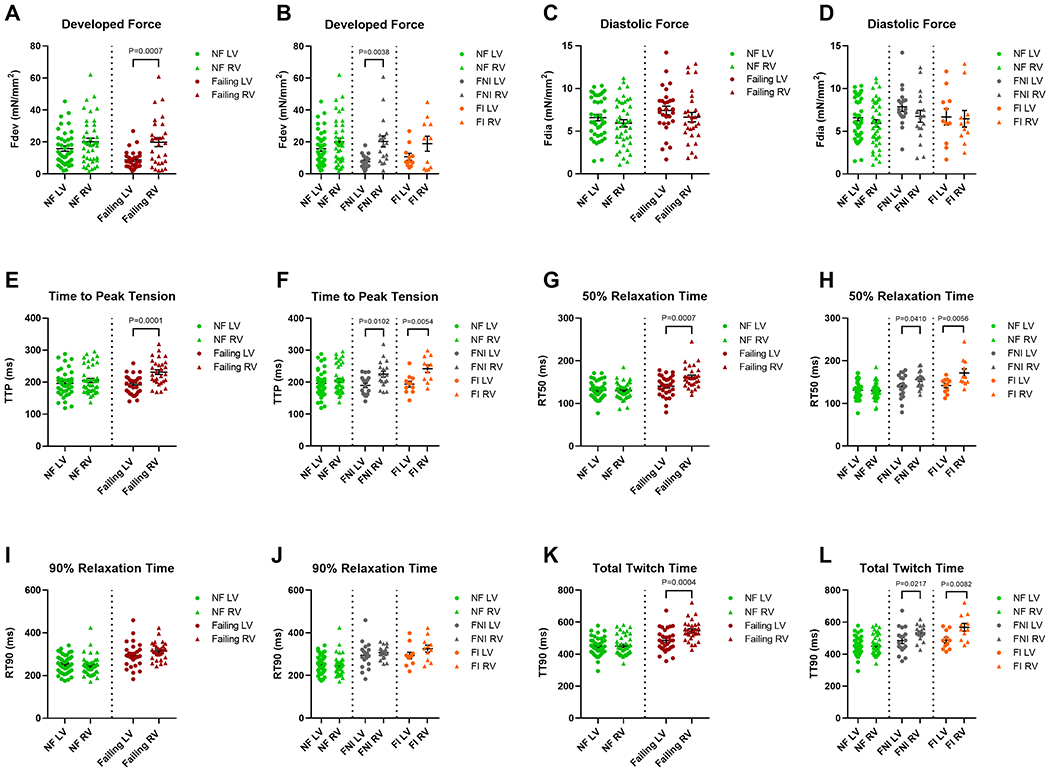
Results: The failing right ventricular myocardium showed significantly higher developed force (Fdev; P=0.001; d=0.98), prolonged time to peak (P<0.001; d=1.14), and higher rate of force development (P=0.002; d=0.89) and force decline (P=0.003; d=0.82) compared to corresponding left ventricular myocardium. In healthy myocardium, a strong positive relationship was present between the left and right ventricles in time to peak (r=0.58, P<0.001) and maximal kinetic rate of contraction (r=0.63, P<0.001). These coefficients were much weaker, often nearly absent, in failing myocardium.

Conclusions: At the level of isolated cardiac trabeculae, contractile performance, specifically of contractile kinetics, is correlated in the nonfailing myocardium between the left and right ventricles' but this correlation is significantly weaker, or even absent, in end-stage heart failure, suggesting an interventricular mechanical dyssynchrony.

Keywords: contractility; heart failure; left ventricle; mechanical dyssynchrony; myocardium; right ventricle.


Conflict of interest statement

Disclosures

Dr Nahush Mokadam serves as a consultant for Abbott, Medtronic, SynCardia and Xylocor and on the Clinical Events Committee for Carmat. The other authors have no conflicts of interest, financial or otherwise to declare.

Figures

Figure 1.
Figure 1.. Demographic characteristics of donors and end-stage HF patients.
A-F, Pie charts showing gender and race distribution in donors and HF patients. G, Donors (n=41) were significantly younger than patients with ischemic HF (n=11; P=0.03) with no significant age difference between both HF groups. H, BMI was not significantly different between donors (n=40) and patients with ischemic (n=10) or non-ischemic (n=17) HF. I, Hearts of donors (n=41) had significantly less weight than those of patients with non-ischemic HF (n=18; P=0.005). J, Left ventricular wall of donor hearts (n=37) had significantly greater thickness than that of ischemic (n=10; P=0.006) and non-ischemic hearts (n=18; P=0.002). K, There were no significant differences in RV wall thickness between donor hearts and those of HF patients. Data are presented as n (%) (A-F) or means ± SD (G-K); One-way ANOVA followed by Tukey’s multiple comparisons post hoc test (G-K). AA indicates African American; BMI, body mass index; C, Caucasian; C/AA, Caucasian/African American; FI, failing ischemic; FNI, failing non-ischemic; g, gram; H, Hispanic; HF, heart failure; HW, heart weight; LV, left ventricle; NF, non-failing; RV, right ventricle; and V, Vietnamese.
Figure 2.
Figure 2.. Baseline contractile force and twitch kinetics of LV vs. RV trabeculae isolated from the NF (n=41) and the failing (n=29) human hearts of ischemic (FI, n=11) and non-ischemic (FNI, n=18) subcategory at 1 Hz.
A, Fdev of the failing RV trabeculae was significantly higher than that of corresponding LV trabeculae (P=0.001). B, Fdev of the FNI myocardium was significantly greater in RV vs. LV (P=0.004). C and D, There were no significant differences in Fdia between RV and LV neither within the NF myocardium nor within myocardium from both HF groups (FNI and FI). E and F, TTP was significantly prolonged in RV trabeculae compared to LV counterparts within the failing myocardium (P=0.0001) of both etiological origins (FNI; P=0.01 and FI; P=0.005). G and H, RT50 was significantly prolonged in the failing RV myocardium (P=0.001), of non-ischemic (P=0.041) and ischemic origin (P=0.006), when compared with corresponding LV myocardium. I and J, Both ventricles showed no significant differences in RT90 within the NF and both HF groups. K and L, A significantly prolonged TT90 was exhibited by RV of the failing, FNI, and FI myocardium when compared with that of the corresponding LV (P=0.0004, P=0.022, and P=0.008, respectively). Data are presented as means ± SEM; Paired t-test. Fdev indicates active developed force; Fdia, diastolic force; FI, failing ischemic; FNI, failing non-ischemic; HF, heart failure; LV, left ventricular; NF, non-failing; RT50, time from peak tension to 50% relaxation; RT90, time from peak tension to 90% relaxation; RV, right ventricular; TT90, total twitch duration; and TTP, time to peak tension.
Figure 3.
Figure 3.. Baseline contraction/relaxation kinetics of LV vs. RV trabeculae isolated from the NF (n=41) and the failing (n=29) human hearts of ischemic (FI, n=11) and non-ischemic (FNI, n=18) subcategory at 1 Hz.
A-D, dF/dt and −dF/dt of RV myocardium were significantly faster than those of corresponding LV myocardium within the failing group (P=0.002 and P=0.003, respectively) and within the FNI group (P=0.002 and P=0.006, respectively). E-H, dF/dt/Fdev of RV myocardium were significantly slower than those of corresponding LV myocardium within the failing group (P=0.001), the FNI group (P=0.041), and within the FI group (P=0.012). Within the FI myocardium, LV trabeculae had significantly faster −dF/dt/Fdev compared to that exhibited by RV trabeculae (P=0.025). Data are presented as means ± SEM; Paired t-test. dF/dt indicates maximal rate of force development during contraction; −dF/dt, maximal rate of force decline during relaxation; dF/dt/Fdev, maximal kinetic rate of contraction; −dF/dt/Fdev, maximal kinetic rate of relaxation; FI, failing ischemic; FNI, failing non-ischemic; LV, left ventricular; NF, non-failing; and RV, right ventricular.
Figure 4.
Figure 4.. Scatterplots display the correlation between baseline contractile force and twitch kinetics of RV vs. LV myocardium isolated from the NF (n=41) and the failing (n=29) human hearts of ischemic (FI, n=11) and non-ischemic (FNI, n=18) etiology.
A, No prominent correlation existed between LV and RV for Fdev within the NF and the failing myocardium. B, Baseline Fdev of both ventricles were moderately positively correlated within the FI myocardium (r=0.33), while weakly negatively correlated within the FNI myocardium. C, LV and RV of the NF myocardium were strongly correlated for TTP (r=0.58; P<0.0001), while there was no correlation present between both ventricles for TTP within the failing group. D, Baseline TTP of both ventricles were weakly correlated within subcategorized HF groups (positively within the FI group and negatively within the FNI group). E and F, Baseline RT50 of both ventricles were strongly correlated within the FI myocardium (r=0.51), moderately correlated within the NF myocardium (r=0.47; P=0.002), while weakly correlated within the FNI myocardium. *P<0.05; Pearson’s correlation coefficient (r). Fdev indicates active developed force; FI, failing ischemic; FNI, failing non-ischemic; HF, heart failure; LV, left ventricular; NF, non-failing; RT50, time from peak tension to 50% relaxation; RV, right ventricular; and TTP, time to peak tension.
Figure 5.
Figure 5.. Scatterplots display the correlation between baseline contraction/relaxation kinetics of RV vs. LV myocardium isolated from the NF (n=41) and the failing (n=29) human hearts of ischemic (FI, n=11) and non-ischemic (FNI, n=18) etiology.
A and B, Weak correlations were indicated between LV and RV for dF/dt within the healthy and diseased myocardium including both categories (FI and FNI). C and D, LV and RV of the FI myocardium were moderately correlated for −dF/dt (r=0.35), while weaker or no correlations were shown between both ventricles in the NF (positively) and the FNI (negatively) myocardium for the same parameter. E and F, LV and RV of healthy myocardium were strongly correlated for dF/dt/Fdev (r=0.63; P<0.0001), while weaker or no correlations were shown between both ventricles for the same parameter in diseased myocardium of both categories (FI and FNI). G and H, −dF/dt/Fdev of both ventricles were almost moderately correlated within the FI and the FNI myocardium (r=0.31 and r=0.33, respectively), while weakly correlated within the NF myocardium. *P<0.05; Pearson’s correlation coefficient (r). dF/dt indicates maximal rate of force development during contraction; −dF/dt, maximal rate of force decline during relaxation; dF/dt/Fdev, maximal kinetic rate of contraction; −dF/dt/Fdev, maximal kinetic rate of relaxation; FI, failing ischemic; FNI, failing non-ischemic; LV, left ventricular; NF, non-failing; and RV, right ventricular.
Figure 6.
Figure 6.. Scatterplots show the correlation between RV and LV myocardium during frequency-dependent stimulation (NF, n=24 vs. failing, n=8).
A-C, Weak correlations were shown between LV and RV for Fdev and RT50 both in the healthy and diseased myocardium, while moderate correlations existed for TTP between the two ventricles (r=0.47 and r=0.39, respectively). D-G, LV and RV myocardium were very weakly correlated in all contraction/relaxation kinetics in both healthy and diseased myocardium, except for −dF/dt and −dF/dt/Fdev, where both ventricles of the failing group were moderately positively (r=0.48) and strongly negatively (r=−0.55) correlated, respectively. Data presented reflects the values of the ratio of 2.5/1 Hz; Pearson’s correlation coefficient (r). dF/dt indicates maximal rate of force development during contraction; −dF/dt, maximal rate of force decline during relaxation; dF/dt/Fdev, maximal kinetic rate of contraction; −dF/dt/Fdev, maximal kinetic rate of relaxation; Fdev indicates active developed force; LV, left ventricular; NF, non-failing; RT50, time from peak tension to 50% relaxation; RV, right ventricular; and TTP, time to peak tension.

References

    1. Tsao CW, Aday AW, Almarzooq ZI, Alonso A, Beaton AZ, Bittencourt MS, Boehme AK, Buxton AE, Carson AP, Commodore-Mensah Y, et al. Heart Disease and Stroke Statistics—2022 Update: A Report From the American Heart Association. Circulation. 2022;145:e153–e639. - PubMed
    1. Zhang Q, Yu C-M. Clinical implication of mechanical dyssynchrony in heart failure. Journal of Cardiovascular Ultrasound. 2012;20:117–123. - PMC - PubMed
    1. Prinzen FW, Vernooy K, DeBoeck BW, Delhaas T. Mechano-energetics of the asynchronous and resynchronized heart. Heart Failure Reviews. 2011;16:215–224. - PMC - PubMed
    1. Rodriguez LM, Timmermans C, Nabar A, Beatty G, Wellens HJ. Variable patterns of septal activation in patients with left bundle branch block and heart failure. Journal of Cardiovascular Electrophysiology. 2003;14:135–141. - PubMed
    1. Kashani A, Barold SS. Significance of QRS complex duration in patients with heart failure. Journal of the American College of Cardiology. 2005;46:2183–2192. - PubMed

Publication types