Toward a realistic in silico abdominal phantom for QSM
- PMID: 36695213
- PMCID: PMC10952412
- DOI: 10.1002/mrm.29597
Toward a realistic in silico abdominal phantom for QSM
Abstract
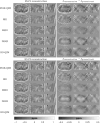
Purpose: QSM outside the brain has recently gained interest, particularly in the abdominal region. However, the absence of reliable ground truths makes difficult to assess reconstruction algorithms, whose quality is already compromised by additional signal contributions from fat, gases, and different kinds of motion. This work presents a realistic in silico phantom for the development, evaluation and comparison of abdominal QSM reconstruction algorithms.
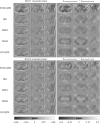
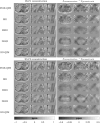
Methods: Synthetic susceptibility and maps were generated by segmenting and postprocessing the abdominal 3T MRI data from a healthy volunteer. Susceptibility and values in different tissues/organs were assigned according to literature and experimental values and were also provided with realistic textures. The signal was simulated using as input the synthetic QSM and maps and fat contributions. Three susceptibility scenarios and two acquisition protocols were simulated to compare different reconstruction algorithms.
Results: QSM reconstructions show that the phantom allows to identify the main strengths and limitations of the acquisition approaches and reconstruction algorithms, such as in-phase acquisitions, water-fat separation methods, and QSM dipole inversion algorithms.
Conclusion: The phantom showed its potential as a ground truth to evaluate and compare reconstruction pipelines and algorithms. The publicly available source code, designed in a modular framework, allows users to easily modify the susceptibility, and TEs, and thus creates different abdominal scenarios.
Keywords: MRI simulation; abdomen; digital phantom; liver QSM; quantitative susceptibility mapping; water-fat separation.
© 2023 The Authors. Magnetic Resonance in Medicine published by Wiley Periodicals LLC on behalf of International Society for Magnetic Resonance in Medicine.
Figures


Similar articles
-
QSM reconstruction challenge 2.0: A realistic in silico head phantom for MRI data simulation and evaluation of susceptibility mapping procedures.Magn Reson Med. 2021 Jul;86(1):526-542. doi: 10.1002/mrm.28716. Epub 2021 Feb 26. Magn Reson Med. 2021. PMID: 33638241 Free PMC article.
-
Analysis of different phase unwrapping methods to optimize quantitative susceptibility mapping in the abdomen.Magn Reson Med. 2019 Dec;82(6):2077-2089. doi: 10.1002/mrm.27891. Epub 2019 Jul 17. Magn Reson Med. 2019. PMID: 31317563
-
QSM reconstruction challenge 2.0: Design and report of results.Magn Reson Med. 2021 Sep;86(3):1241-1255. doi: 10.1002/mrm.28754. Epub 2021 Mar 30. Magn Reson Med. 2021. PMID: 33783037 Free PMC article.
-
QSM Throughout the Body.J Magn Reson Imaging. 2023 Jun;57(6):1621-1640. doi: 10.1002/jmri.28624. Epub 2023 Feb 7. J Magn Reson Imaging. 2023. PMID: 36748806 Free PMC article. Review.
-
Overview of quantitative susceptibility mapping using deep learning: Current status, challenges and opportunities.NMR Biomed. 2022 Apr;35(4):e4292. doi: 10.1002/nbm.4292. Epub 2020 Mar 23. NMR Biomed. 2022. PMID: 32207195 Review.
Cited by
-
An Introduction to Ventra: A Programmable Abdominal Phantom for Training, Educational, Research, and Development Purposes.Sensors (Basel). 2024 Aug 22;24(16):5431. doi: 10.3390/s24165431. Sensors (Basel). 2024. PMID: 39205127 Free PMC article.
References
-
- De Rochefort L, Liu T, Kressler B, et al. Quantitative susceptibility map reconstruction from MR phase data using bayesian regularization: validation and application to brain imaging. Magn Reson Med. 2010;63:194‐206. - PubMed
-
- Haacke EM, Liu S, Buch S, Zheng W, Wu D, Ye Y. Quantitative susceptibility mapping: current status and future directions. Magn Reson Imaging. 2015;33:1‐25. - PubMed
Publication types
MeSH terms
Grants and funding
LinkOut - more resources
Full Text Sources

