. 2023 May;89(5):2024-2047.
doi: 10.1002/mrm.29572. Epub 2023 Jan 25.

Current state and guidance on arterial spin labeling perfusion MRI in clinical neuroimaging

Affiliations

Current state and guidance on arterial spin labeling perfusion MRI in clinical neuroimaging

Thomas Lindner et al. Magn Reson Med. 2023 May.

Abstract

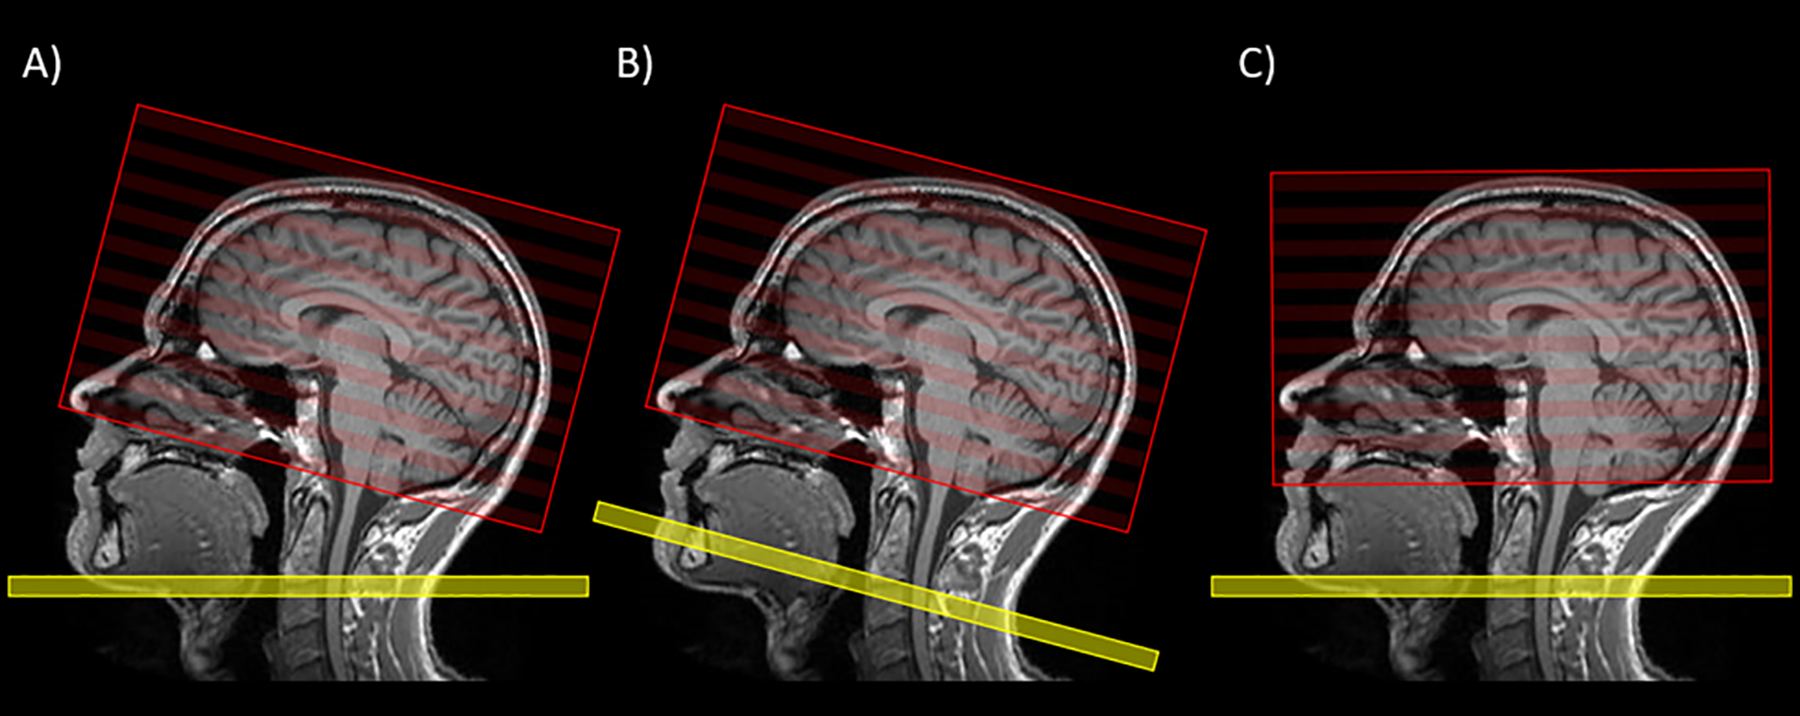
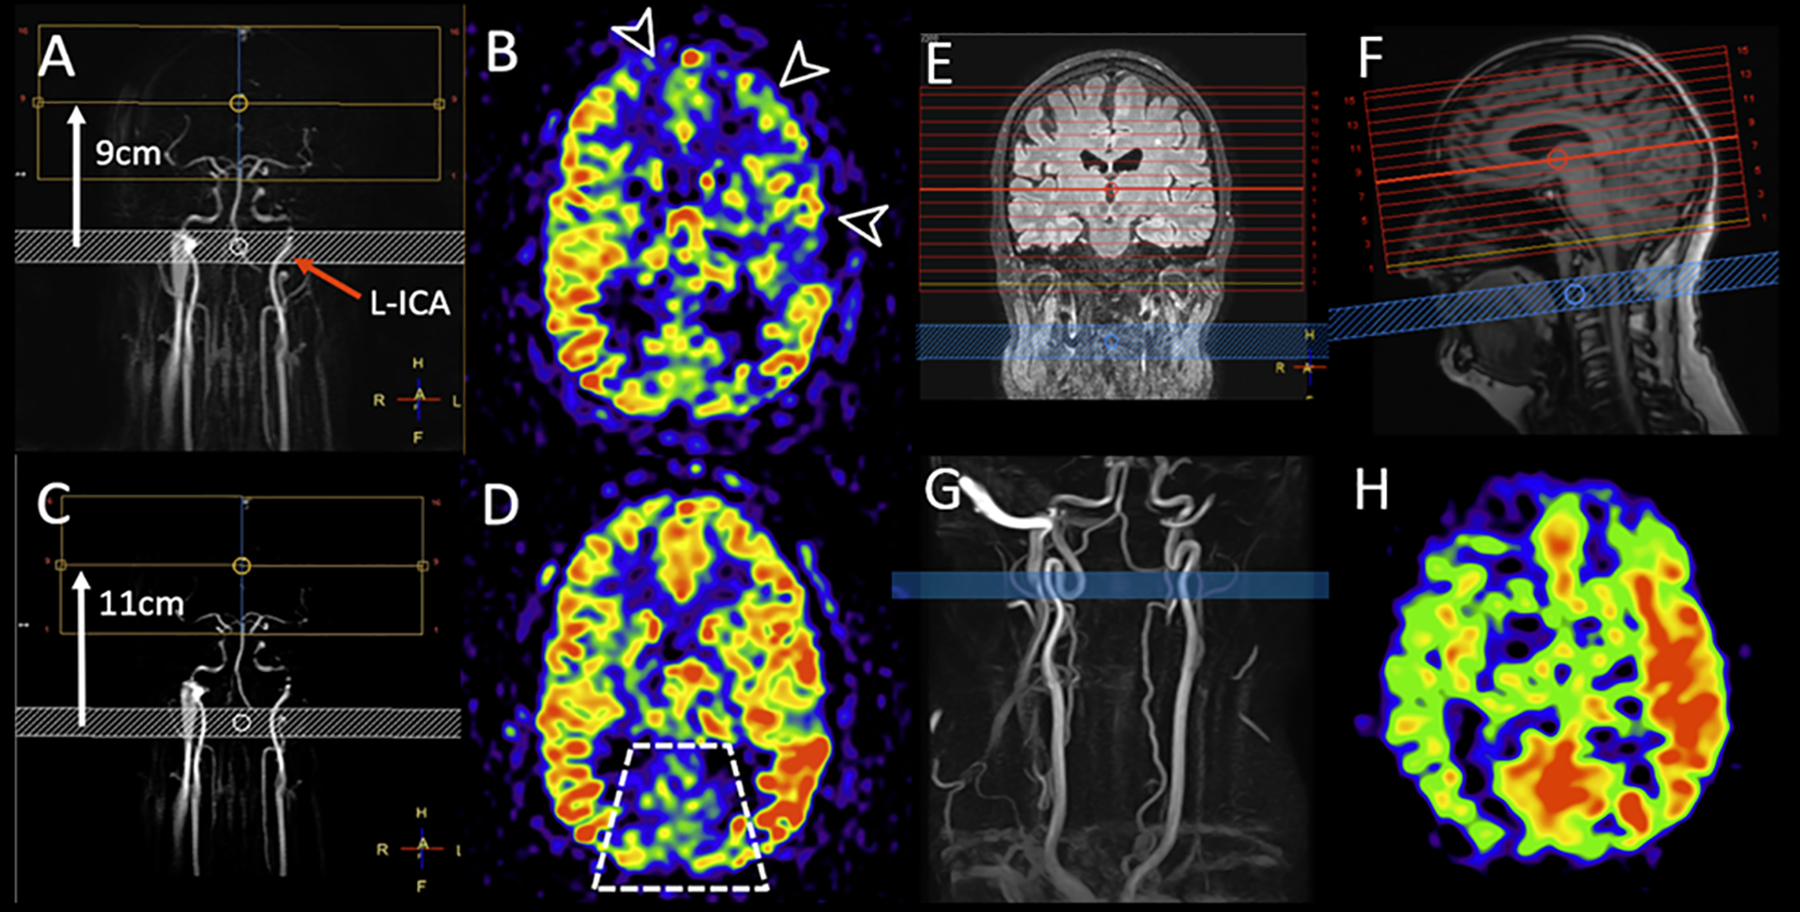
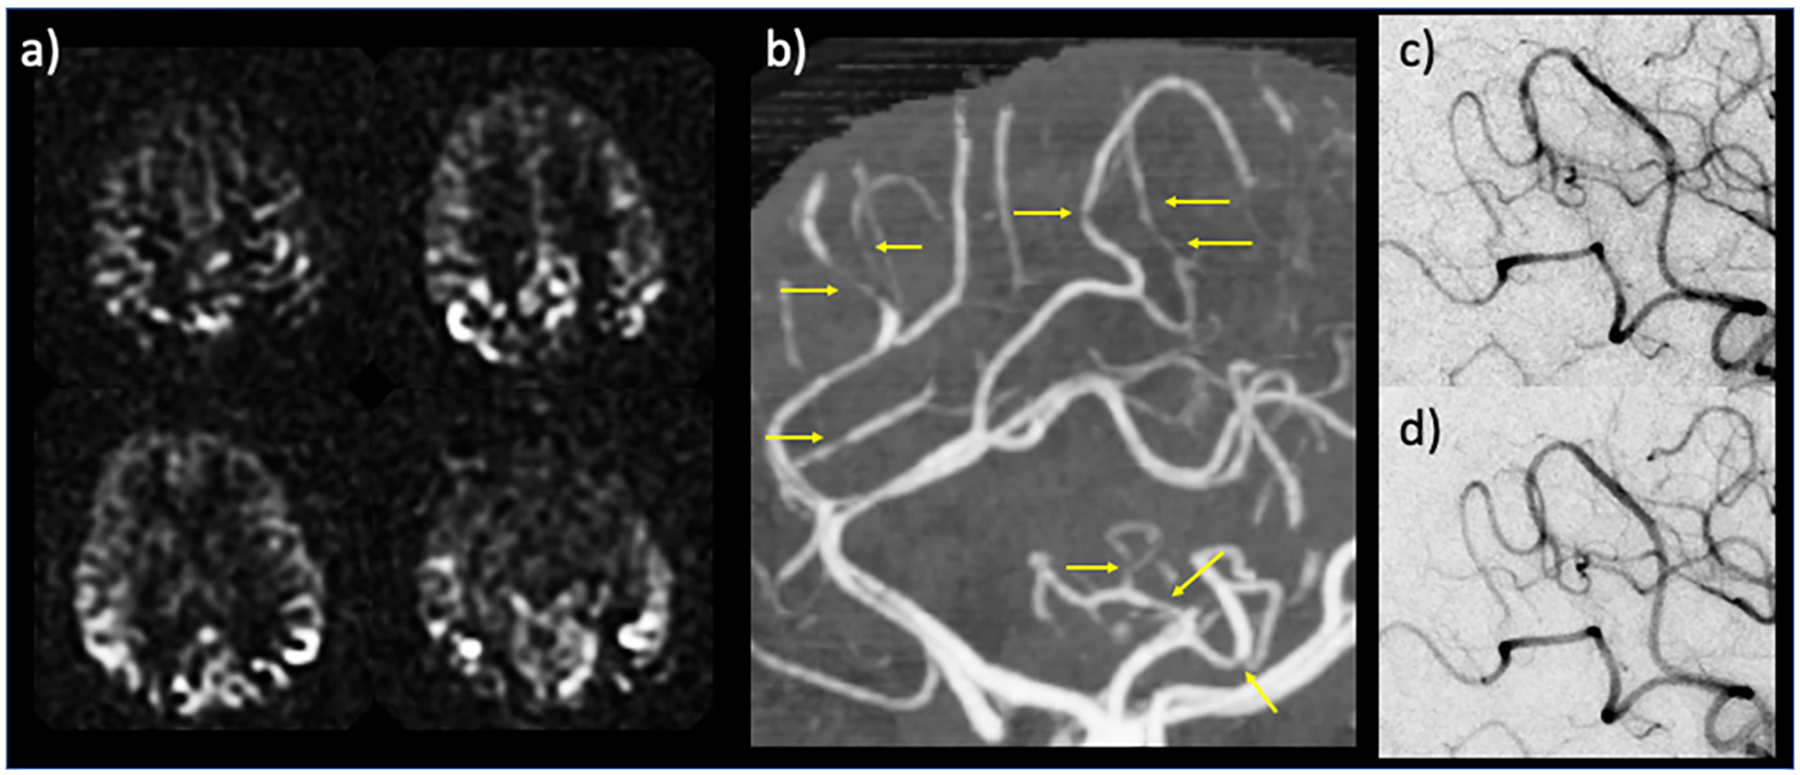
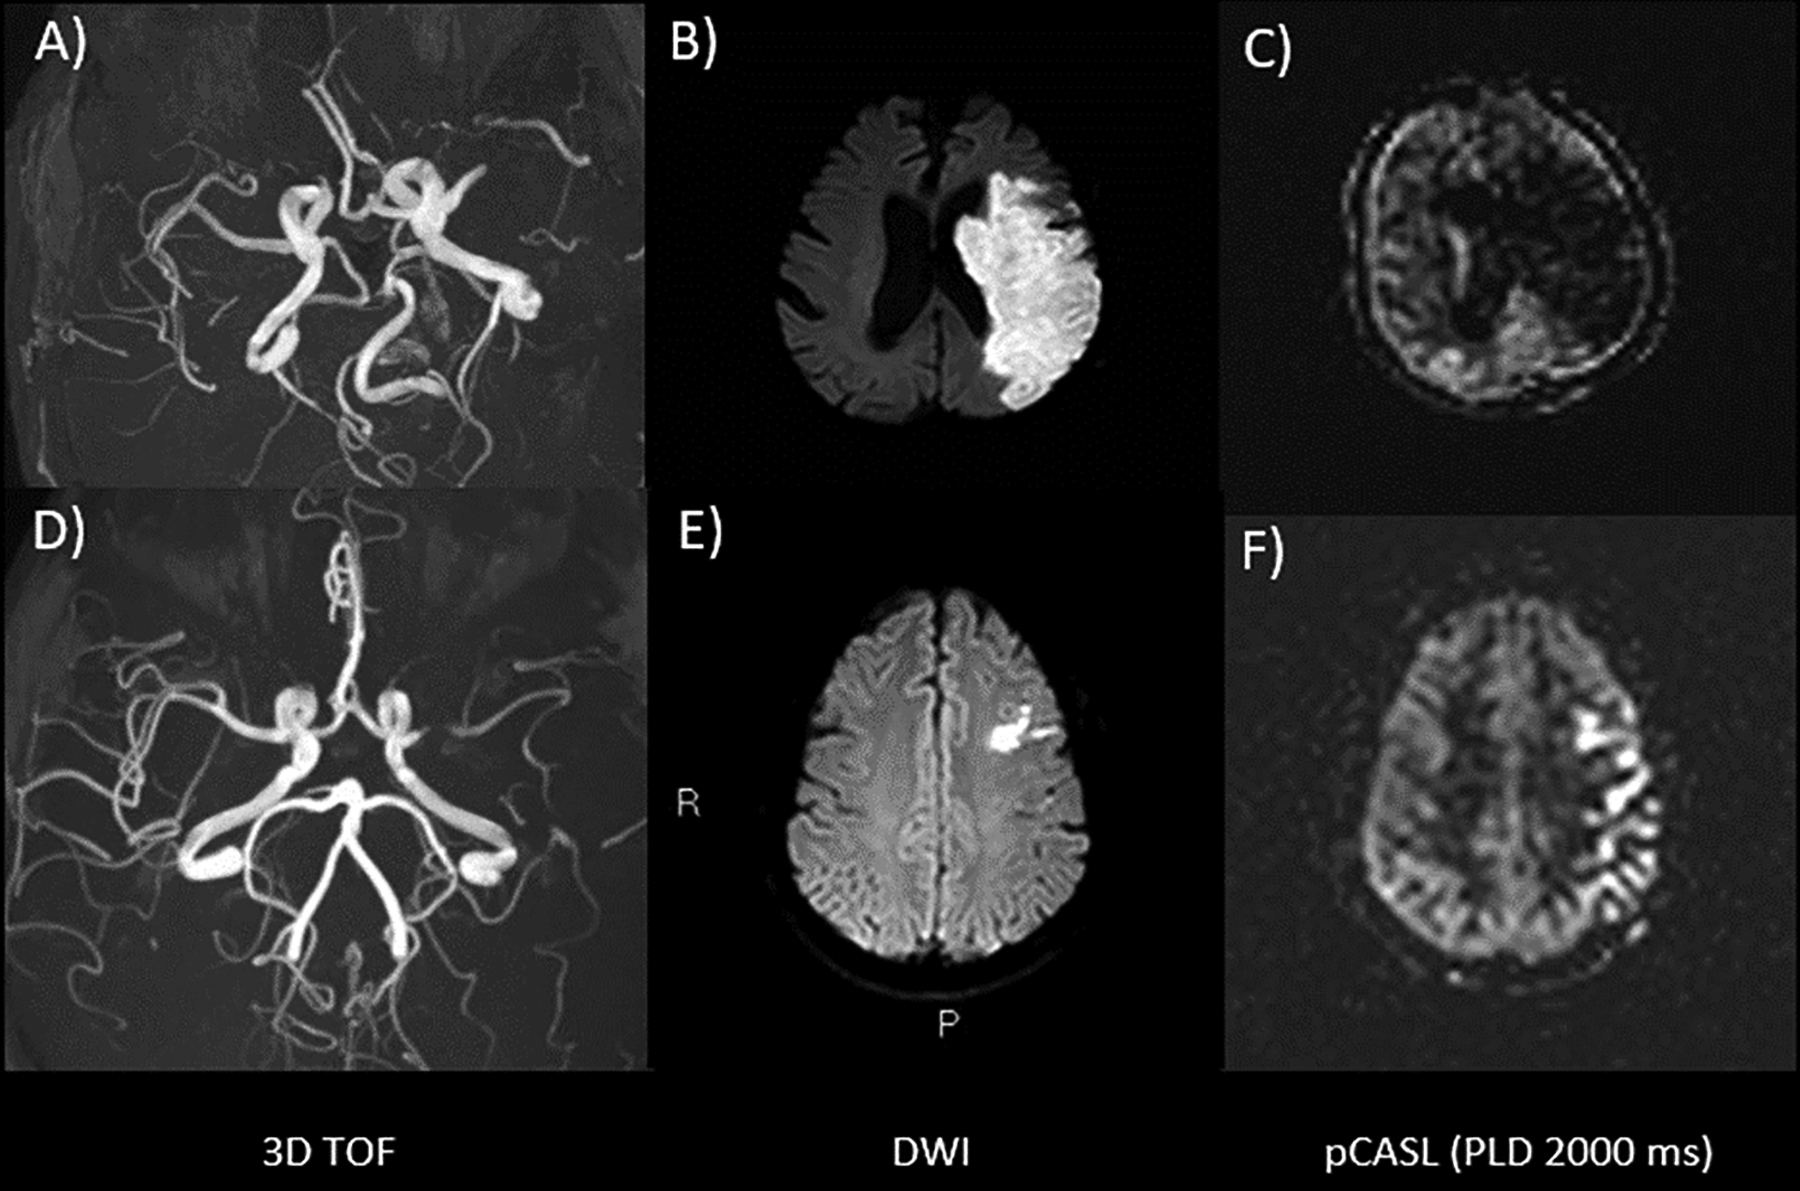
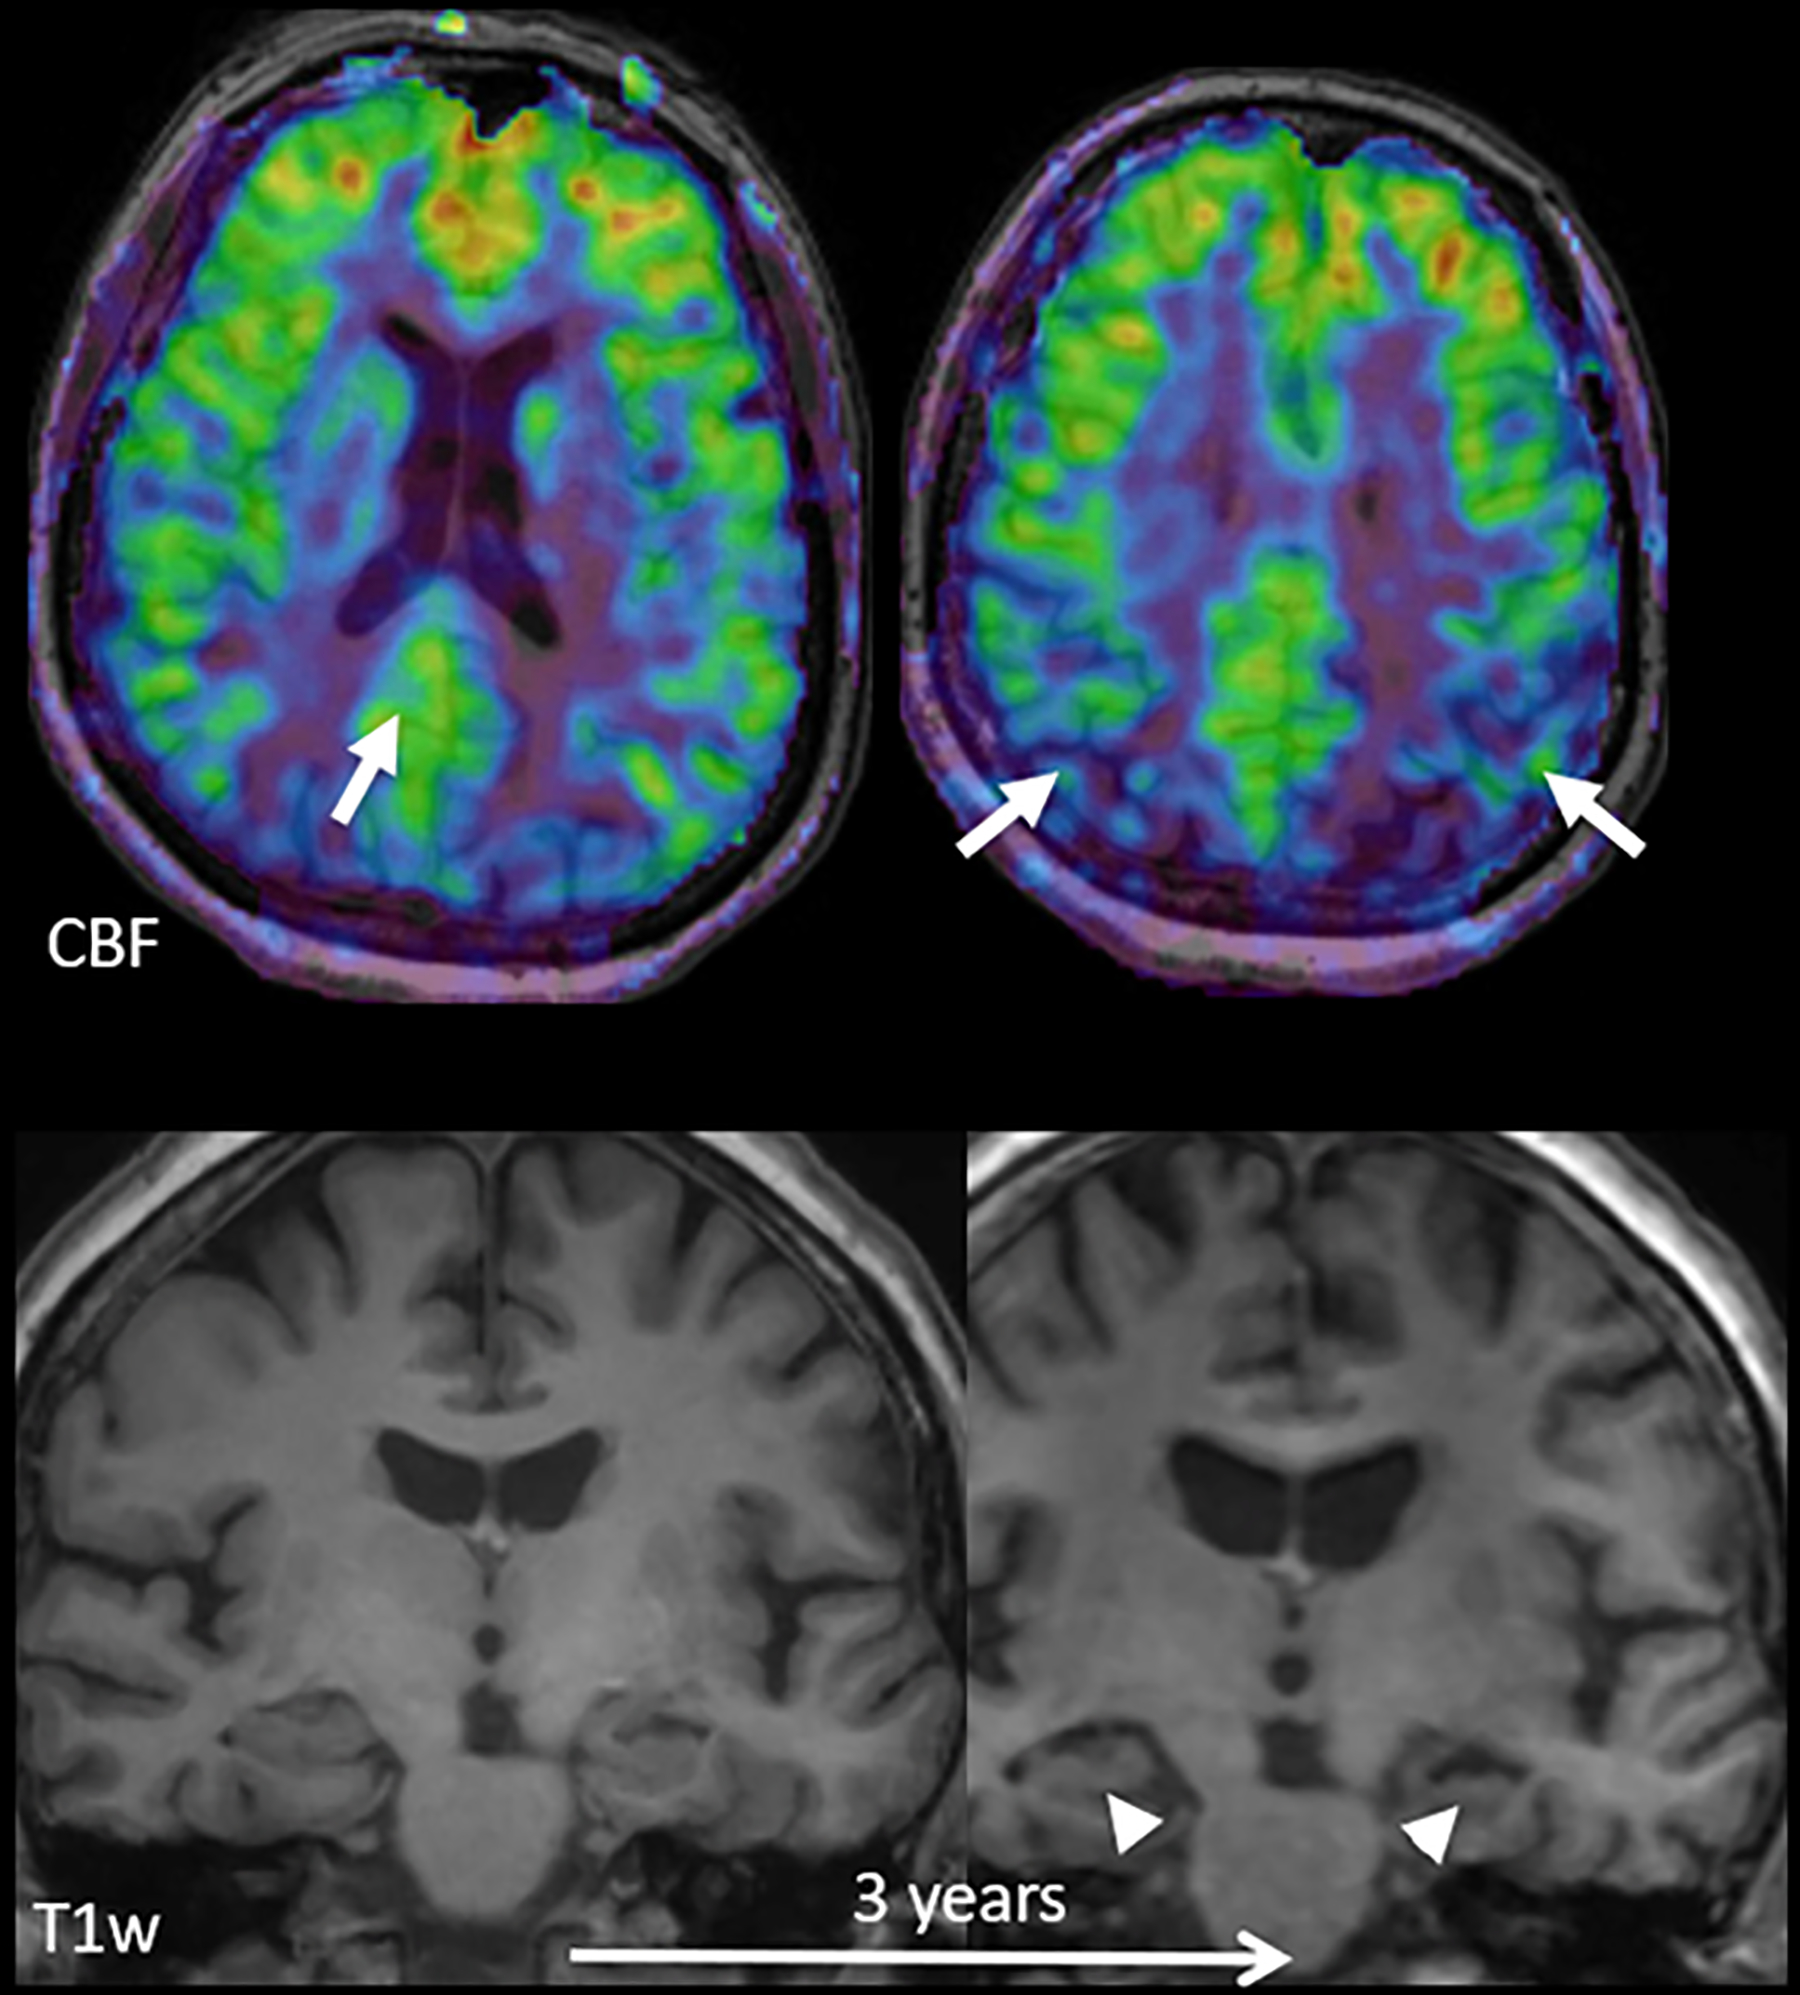
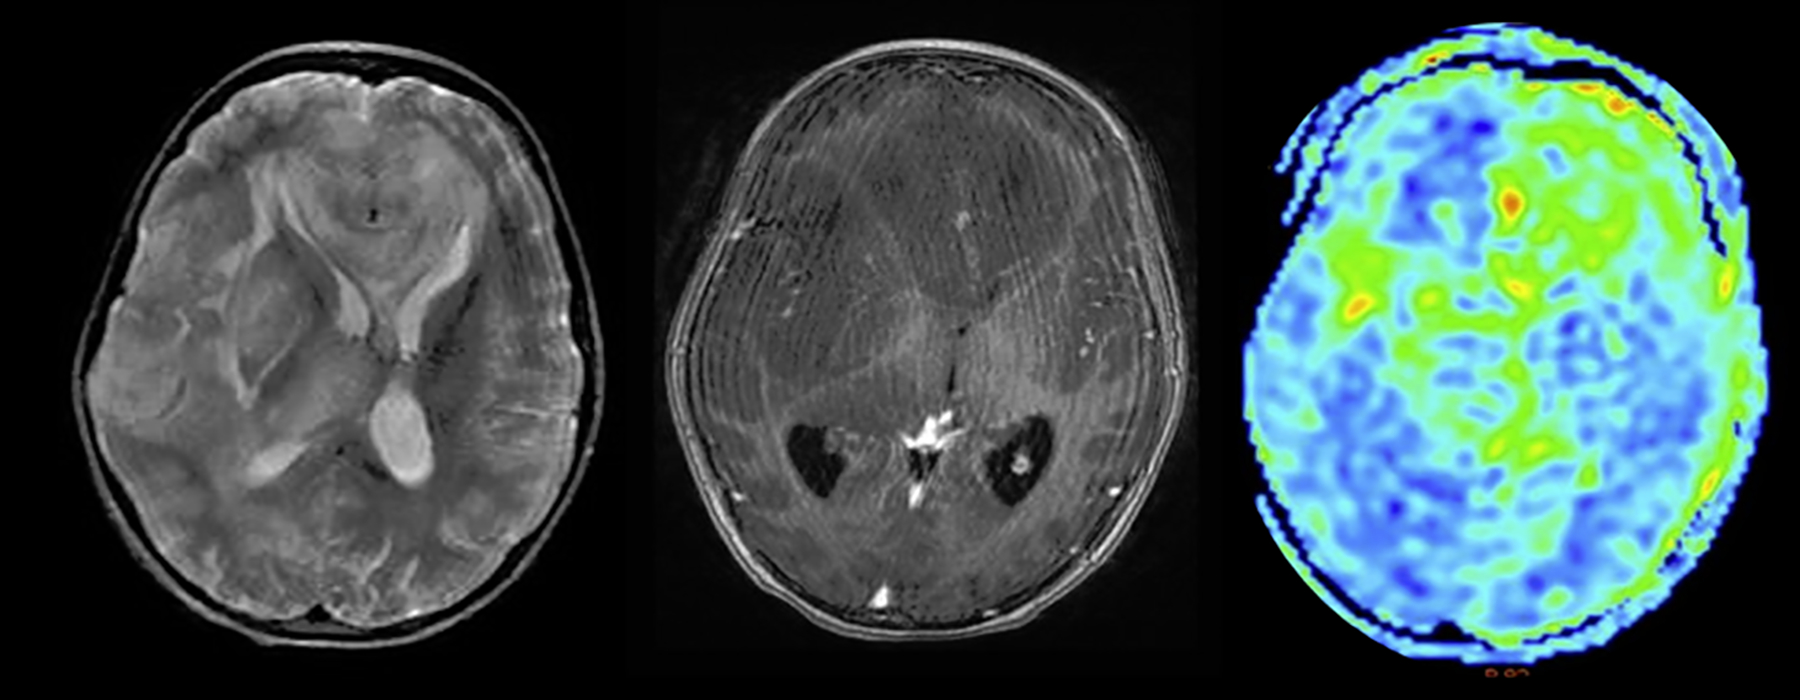
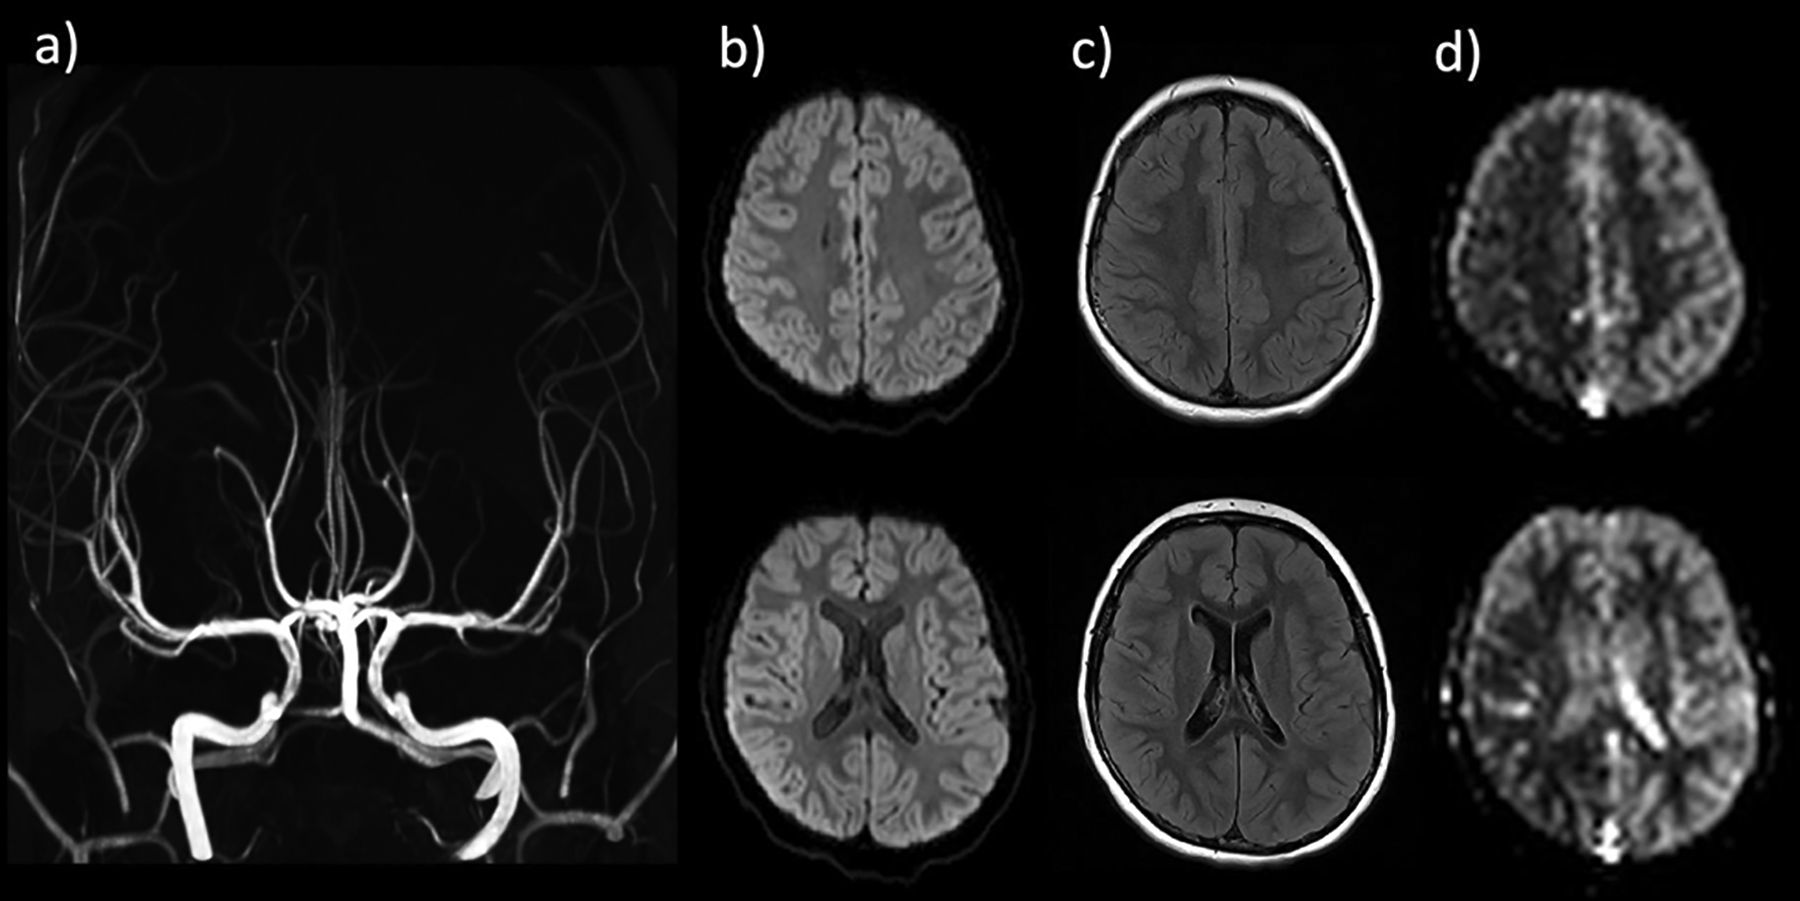
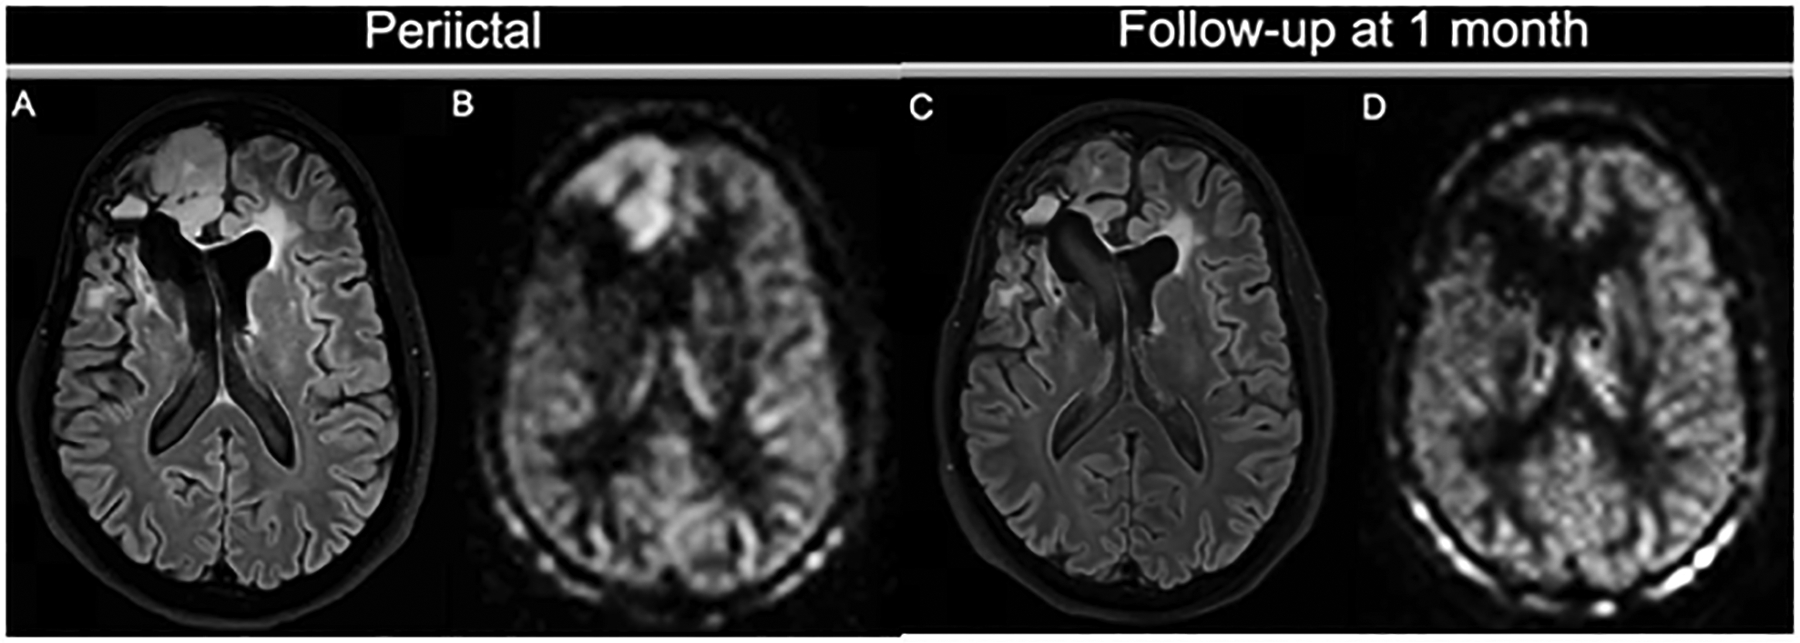
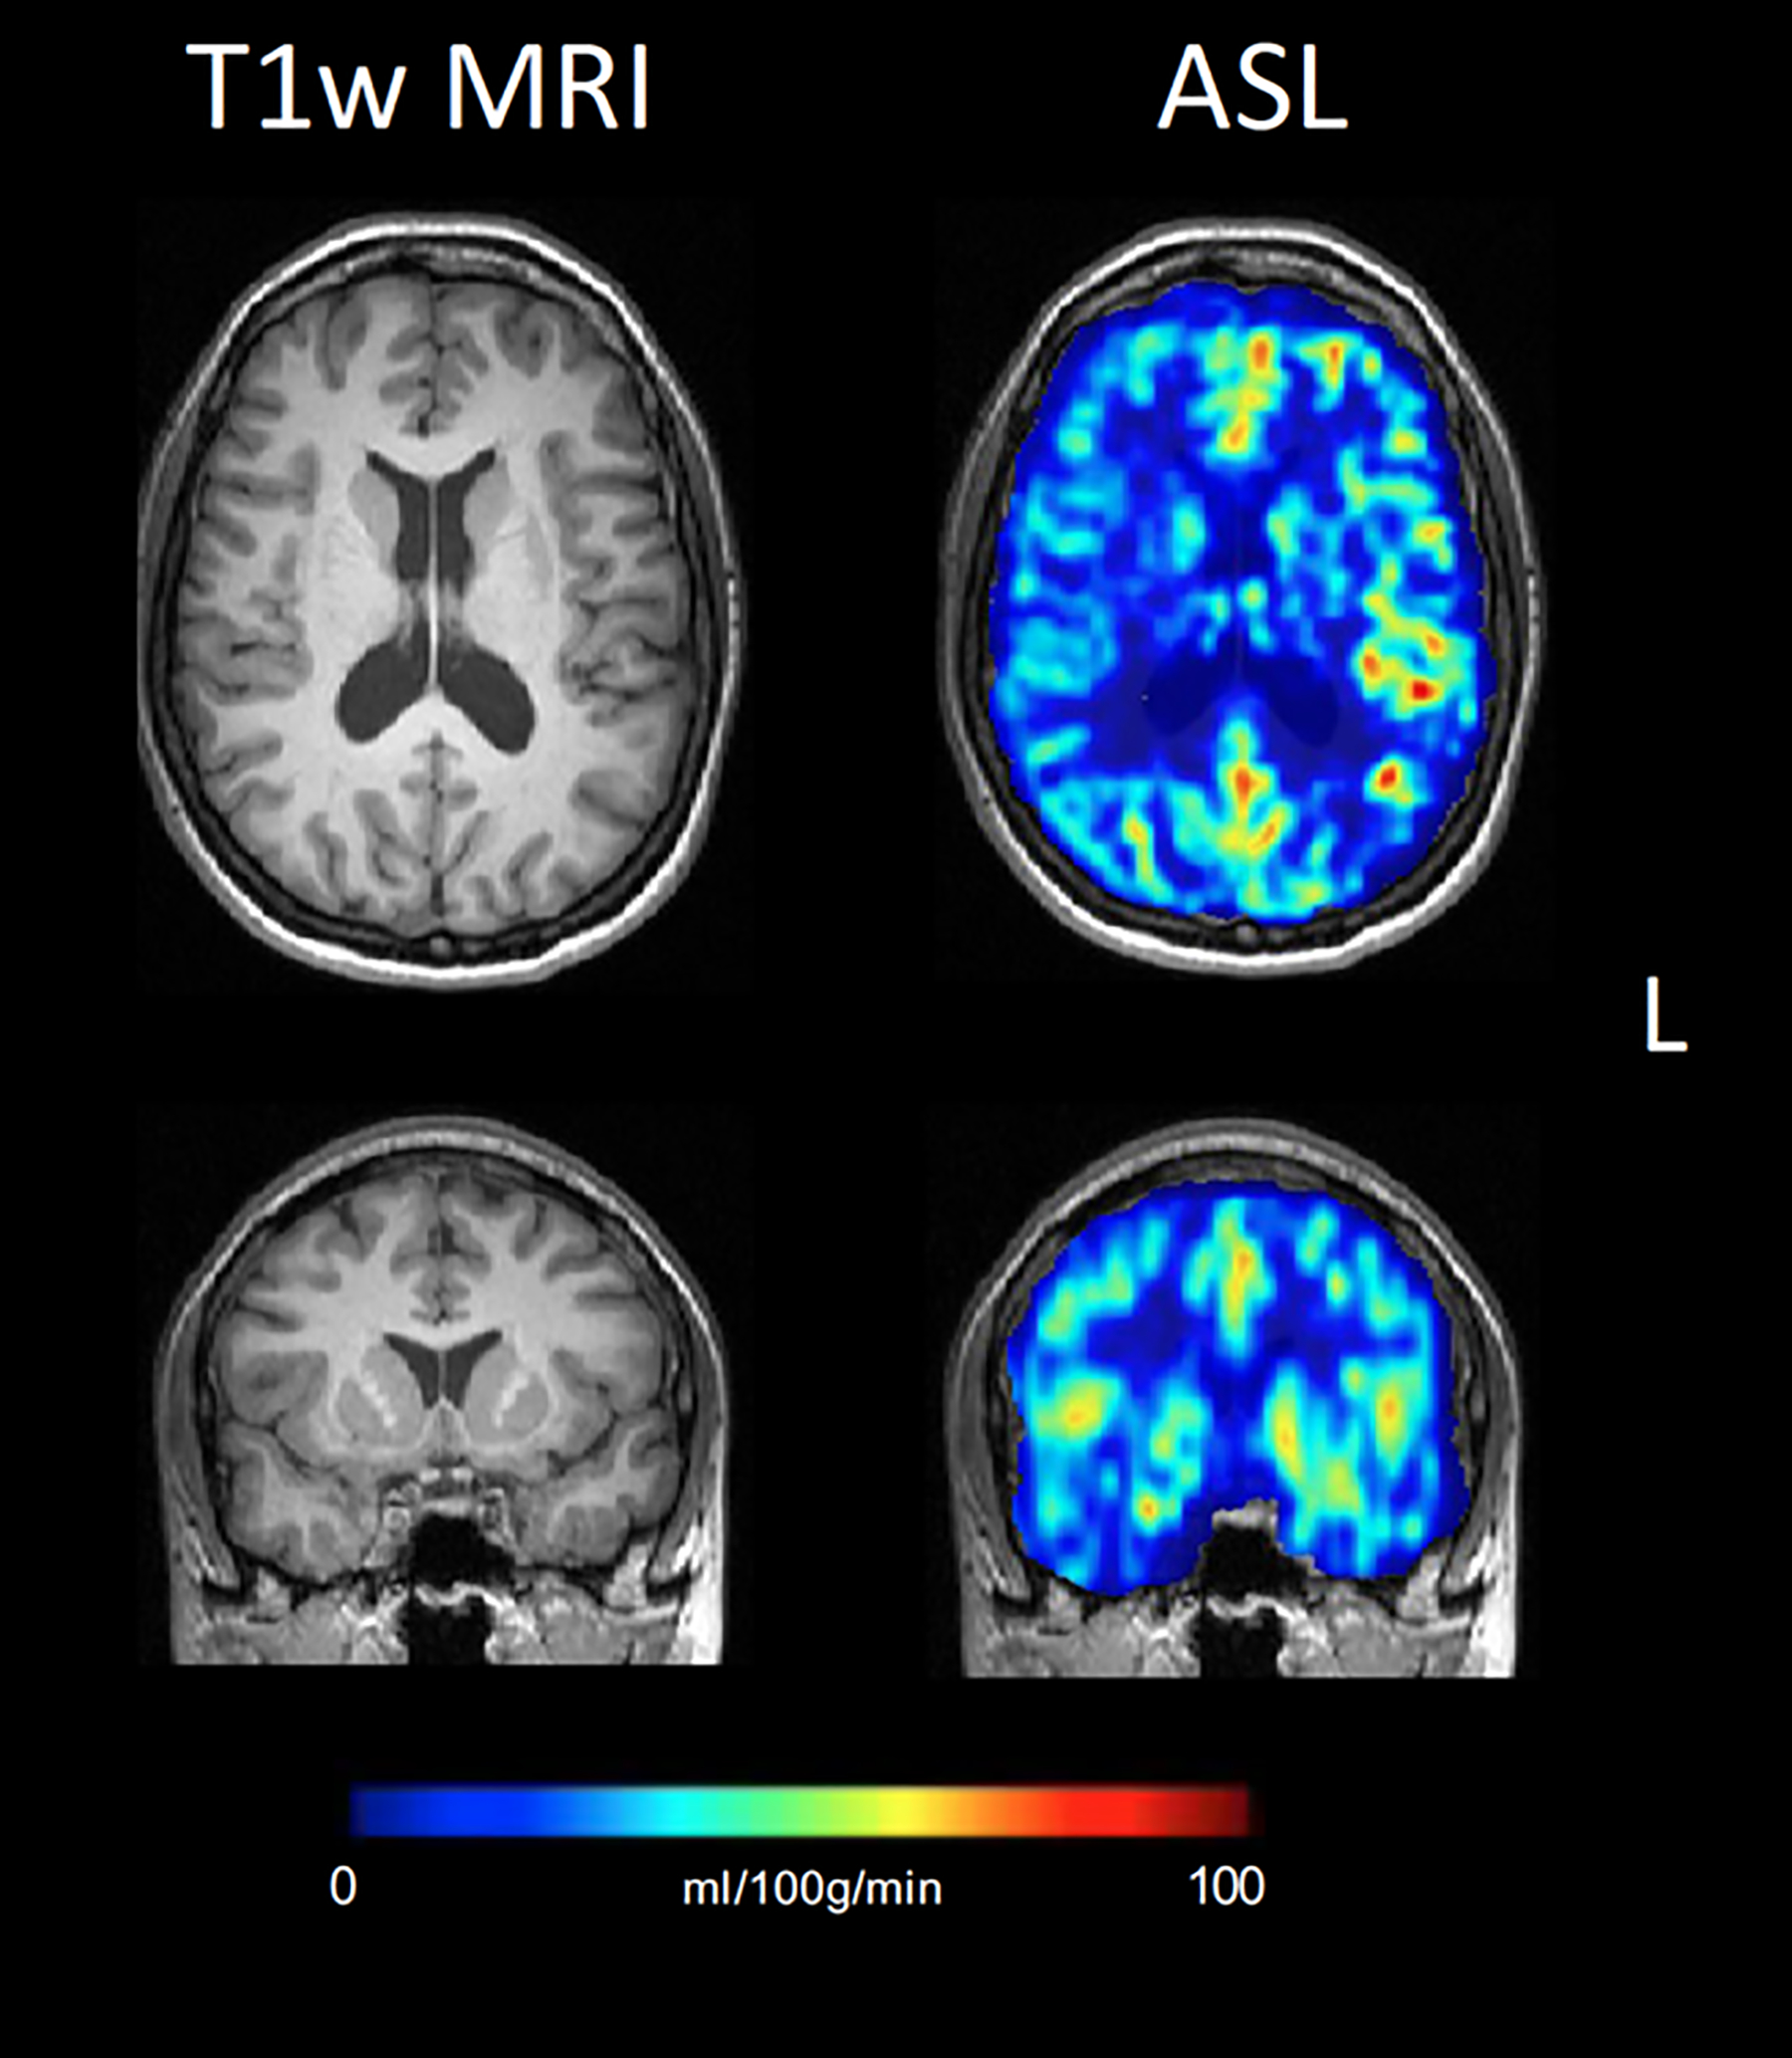
This article focuses on clinical applications of arterial spin labeling (ASL) and is part of a wider effort from the International Society for Magnetic Resonance in Medicine (ISMRM) Perfusion Study Group to update and expand on the recommendations provided in the 2015 ASL consensus paper. Although the 2015 consensus paper provided general guidelines for clinical applications of ASL MRI, there was a lack of guidance on disease-specific parameters. Since that time, the clinical availability and clinical demand for ASL MRI has increased. This position paper provides guidance on using ASL in specific clinical scenarios, including acute ischemic stroke and steno-occlusive disease, arteriovenous malformations and fistulas, brain tumors, neurodegenerative disease, seizures/epilepsy, and pediatric neuroradiology applications, focusing on disease-specific considerations for sequence optimization and interpretation. We present several neuroradiological applications in which ASL provides unique information essential for making the diagnosis. This guidance is intended for anyone interested in using ASL in a routine clinical setting (i.e., on a single-subject basis rather than in cohort studies) building on the previous ASL consensus review.

Keywords: arterial spin labeling; clinical routine ASL; perfusion.


Figures

Figure 1:
Figure 1:
ASL planning. In A), the labeling plane (yellow) and the image volume (red) can be moved freely and independently. In this ideal case, the labeling plane should be placed perpendicular to the carotid arteries around C2/C3 and the image volume along the AC-PC line in concordance with other used transversal sequences. In B) and C) the labeling plane and the image volume are not individually moveable but follow each other. In B) the orientation of the image volume corresponds to the standard orientation (i.e. the AC-PC line) and can be more easily compared to other conventional MR sequences; however, the radiologist must accept a potential reduction in the labeling efficiency that may vary (for example) between the anterior and posterior circulation. In C) the orientation of the imaging volume deviates from the AC-PC line, but the labeling efficiency should not be compromised. Ideally, option (A) is used and will lead to both optimal labeling efficiency and a familiar imaging slice orientation. When A) is not attainable, the decision between B) and C) rests upon the neuroradiologist and should consider the interpretative objectives of the particular case, though more uniform labeling efficiency is typically desired to avoid regions of artifactual hypoperfusion.
Figure 2:
Figure 2:
Two examples of the effect of labeling asymmetry on the CBF images (CBF values are not indicated). A-D: Two consecutive 3D PCASL scans were acquired in the same MRI exam in a patient at a chronic stage of carbon monoxide intoxication. Both scans were planned on a 2D coronal phase contrast MRA (A and C). B and D show the same imaging slice position. In the first run (top row) the labeling distance was 9cm (white arrow on A). Extensive low signal is seen in the territories of the left middle cerebral artery (MCA) and bilateral anterior cerebral arteries (ACA) (arrow heads on B). On the second run (bottom row) the labeling plane was moved down by 2cm, while the other sequence parameters were unchanged. Note that the left ICA (red arrow) is more obliqued relative to the labeling plane on A, while it is more perpendicular to the labeling plane and symmetrical to the right ICA on C. On the second PCASL scan, most of the previously abnormal areas demonstrate increased perfusion, more symmetric with the remainder of anterior circulation territories. This is a case of labeling asymmetry that was corrected with the repositioning of the labeling plane. Also note that the PCA territories show lower signal on both perfusion maps (trapezoid on D), which is a physiological ASL phenomenon often referred to as pseudo-hypoperfusion. It can be observed with the standard (non-fetal) configuration of the posterior cerebral arteries (PCA), with P1 segments arising from the basilar artery, and it is likely caused by a lower labeling efficiency of the vertebral arteries blood flow compared to the ICAs. (Adapted from Pinter et al. (30). E-H: Example of asymmetric perfusion without obvious reason. The planning screenshots (E and F) show the labeling plane (blue) and image volume (red). No hemodynamically relevant stenoses are visible on the neck time-of-flight angiography (G). However, upon closer inspection of the planning angiogram, it was noted that the labeling plane was placed in a tortuous loop of the right ICA. The left ICA was labeled in a straight section, perpendicular to the labeling plane. The final CBF weighted images (H) result in a visible perfusion asymmetry, which could lead to a false positive diagnosis when the underlying reason cannot be determined. Such anatomical variants might not be known in patients, and this example illustrates well the value of providing the planning strategy for interpreting the final ASL images.
Figure 3.
Figure 3.
Example case for the potential diagnostic use of arterial transit artifacts (ATA). 34 year-old postpartum female presenting with severe headache and left-sided weakness. Head CT and CT angiogram initially called negative, without evidence of infarction, large vessel occlusion, or proximal stenosis. Subsequent MRI with ASL demonstrated peripheral curvilinear hyperintensities — i.e., ATA — suspicious for diffuse stenoses versus collaterals (a); retrospective review of CT angiogram revealed multifocal stenosis of distal arterial branches (b, yellow arrows) raising concern for reversible cerebral vasoconstriction syndrome (RCVS). Conventional angiography corroborated the CTA findings of stenosis (c), which reversed after administration of calcium channel blockers (verapamil) (d), thus confirming RCVS diagnosis. In (a) perfusion maps are shown.
Figure 4:
Figure 4:
Two patients with an AIS in the left MCA territory. The first patient in the upper row (A-C) has poor collaterals. The TOF angiogram (A) shows occlusion of the left M1 segment, which has resulted in a large infarct on DWI (B). On the perfusion-weighted ASL image with a PLD of 2000ms (C), there is no visible ATA, indicating a lack of collateral vessels. The second patient (D-F) has robust collaterals. The TOF (D), shows severe narrowing/near occlusion of the left M1 segment and DWI (E) demonstrates a much smaller acute infarct than in the first patient. On the perfusion-weighted ASL images with a PLD of 2000ms (F), there is a serpiginous high signal overlying the left hemisphere. These reflect ATA and presumably correspond to labeled spins in leptomeningeal collateral vessels, which have not reached the brain parenchyma at the 2000ms PLD, yet provide adequate blood supply to prevent a larger infarction (at least at the time of imaging). Images are shown as perfusion values.
Figure 5:
Figure 5:
Delayed arterial flow in chronic ICAD. Normal vasculature and perfusion are seen in the right hemisphere. The left M1 segment has severe chronic stenosis, with diminished signal in distal MCA branches on the Time-of-Flight MRA (A). The corresponding FLAIR image (B) is without findings to suggest a recent infarct, corroborated by a lack of clinical symptoms (note that DWI was not performed). On PCASL with PLD of 1800ms (C) apparent hypoperfusion is seen throughout the left MCA territory, along with arterial transit artifacts in the Sylvian M2 branches and watershed areas (arrow and arrowheads). On a second PCASL with PLD of 2500ms (D) the perfusion signal in the posterior temporal lobe and in the watershed areas normalizes (dotted circles) and the artifacts are markedly reduced, indicating that perfusion is maintained via delayed (collateral) flow. Macrovascular artifacts remain in the Sylvian fissure, consistent with an arrival time >2500ms in these branches, likely persistent ATA. Estimating CBF in the parenchyma fed by these vessels is possible with PLD >2500ms, although the reduction of signal with T1 relaxation will further decrease SNR. (C) and (D) are perfusion maps.
Figure 6:
Figure 6:
A 80-year-old woman presents with diplopia, dizziness, and incoordination. Conventional MR imaging was unremarkable. PCASL demonstrates a markedly hyperintense signal within the left cavernous sinus and superior ophthalmic vein, SOV (a, left column). Time-of-flight MRA shows only subtle flow-related enhancement within the left SOV (a, right column). Suspicion of cavernous-carotid fistula was raised based on the ASL perfusion maps. Conventional angiography confirms the diagnosis and shows early venous drainage into the left cavernous sinus and SOV on arterial (b, top) and parenchymal (b, bottom) phase imaging (b, red arrow).
Figure 7:
Figure 7:
Exemplary post-operative follow-up MRI examinations using ASL. A patient with grade II glioma underwent brain tumor resection. Images are FLAIR, Post-Gd T1-WI, and ASL CBF from top to bottom rows. CBF images show increasing tumor blood flow before treatment, followed by a decreased tumor blood flow after radiation and temozolomide therapy.
Figure 8:
Figure 8:
40-year-old woman with previously resected and radiated left frontoparietal grade III anaplastic astrocytoma. FLAIR (a), post-contrast (b), SWI (c), DSC perfusion (d), and ASL perfusion (e) are shown at time = 0 (top row) and 12 months (bottom row). At time = 0, ASL demonstrates a small focus of hyperperfusion along the resection cavity margins (yellow arrowhead) that raises suspicion for recurrent tumor despite lack of masslike FLAIR abnormality or suspicious enhancement. Importantly, no convincing abnormality is seen on DSC, likely due to susceptibility in the setting of chronic post-surgical blood products (c). At 12 months, there has been marked interval growth, subtly seen on FLAIR and more easily identified by ASL hyperperfusion (yellow arrowheads). DSC again is of poor diagnostic utility and shows only minimal perfusion abnormality.
Figure 9:
Figure 9:
Early perfusion changes in Alzheimer’s disease (AD). Top row: color-coded baseline cerebral blood flow (CBF) maps acquired with ASL overlaid on structural T1w images; bottom row: coronal reconstructions at the level of the hippocampus at baseline and after 3 years. At baseline, hippocampal volume is normal, but hypoperfusion in the posterior cingulate cortex/precuneus (arrow on left) and parietal regions (arrows on right) already suggest AD. Note that the hypoperfusion in the posterior cingulate/precuneus may be missed upon visual inspection, as there is no clear relative perfusion deficit. Perfusion in this area, however, should be much higher than in the rest of the cortex and a quantitative approach confirms the relative hypoperfusion. After 3 years, structural changes consistent with AD, i.e. hippocampal (arrowheads) and global atrophy, also become visible. Adapted from and courtesy of (2).
Figure 10:
Figure 10:
Case example of a 9-year-old girl. ASL revealing mixed CBF with radiological diagnosis of gliomatosis cerebri (left: T2-weighted; mid: T1 post-contrast; right: CBF map images) with hyperperfused (left frontal) and normo- to hypoperfused (e.g. right frontal) regions.
Figure 11.
Figure 11.
8-year-old boy presenting with acute-onset left hemiplegia. Stroke protocol MRI without evidence of large vessel occlusion or high grade stenosis on MR angiogram (a), acute infarction on DWI (b), or signal abnormality on FLAIR (c). ASL demonstrates marked CBF reduction throughout the right hemisphere, including the right MCA territory. Based on clinical presentation and ASL findings, diagnosis of complex hemiplegic migraine was made. The patient recovered without intervention.
Figure 12:
Figure 12:
Seizure activity on ASL. A patient with a history of frontal ganglioneuroma resection 20 years before this presentation had an epileptic seizure, presumably due to encephalomalacia/gliosis. On the peri-ictal MRI, the FLAIR image (A) shows a swollen cortical ribbon in the right medial frontal lobe, with a corresponding increased perfusion signal on 3D ASL (B). Both the FLAIR abnormality and the hyperperfusion are limited to the cortex. Note the contrast between the perfusion signal in the cortex and the subcortical white matter. Lateral to this finding is the stable-appearing surgical cavity with fluid-fluid level and ex vacuo dilation of the right lateral ventricle. At follow-up, the cortical abnormality has almost completely resolved: the cortex is normal size and only minimal FLAIR hyperintensity is visible (C). The ASL scan (D) shows normalized perfusion in the affected region, similar to the left frontal lobe.
Figure 13:
Figure 13:
Interictal ASL CBF map showing right fronto-temporal hypoperfusion in a patient without any morphological-structural alterations identified on structural MRI, but with clinical and EEG localization to the right fronto-temporal lobe and right temporal hypometabolism on interictal PET (not shown).

References

    1. Haller S, Zaharchuk G, Thomas DL, Lovblad K-O, Barkhof F, Golay X. Arterial Spin Labeling Perfusion of the Brain : Emerging Clinical Applications. Radiology 2016;281:337–356. - PubMed
    1. Grade M, Hernandez Tamames JA, Pizzini FB, Achten E, Golay X, Smits M. A neuroradiologist’s guide to arterial spin labeling MRI in clinical practice. Neuroradiology 2015;57:1181–1202. - PMC - PubMed
    1. Deibler AR, Pollock JM, Kraft RA, Tan H, Burdette JH, Maldjian JA. Arterial spin-labeling in routine clinical practice, part 2: hypoperfusion patterns. AJNR Am.J.Neuroradiol 2008;29:1235–1241. - PMC - PubMed
    1. Deibler AR, Pollock JM, Kraft RA, Tan H, Burdette JH, Maldjian JA. Arterial spin-labeling in routine clinical practice, part 3: hyperperfusion patterns. AJNR Am.J.Neuroradiol 2008;29:1428–1435. - PMC - PubMed
    1. van der Plas MCE, Teeuwisse WM, Schmid S, Chappell M, van Osch MJP. High temporal resolution arterial spin labeling MRI with whole-brain coverage by combining time-encoding with Look-Locker and simultaneous multi-slice imaging. Magn. Reson. Med 2019;81:3734–3744. - PMC - PubMed

Publication types