. 2023 Feb 15;136(4):jcs259788.
doi: 10.1242/jcs.259788. Epub 2023 Feb 27.

Lamin A/C phosphorylation at serine 22 is a conserved heat shock response to regulate nuclear adaptation during stress

Affiliations

Lamin A/C phosphorylation at serine 22 is a conserved heat shock response to regulate nuclear adaptation during stress

Laura Virtanen et al. J Cell Sci. .

Abstract

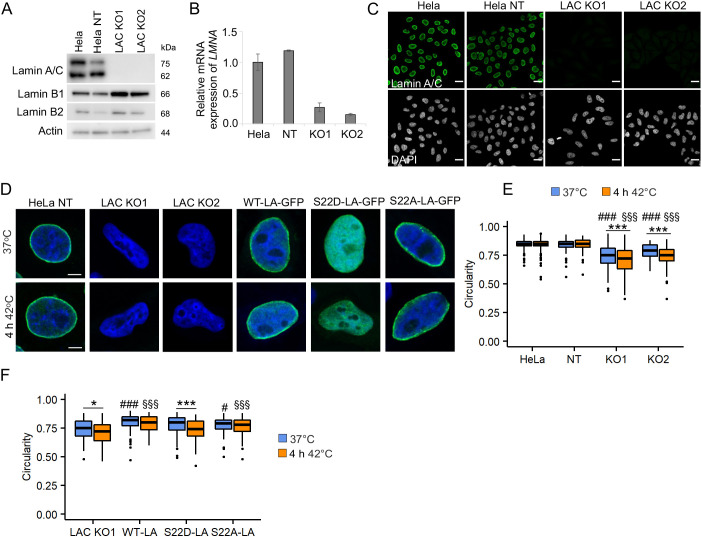
The heat shock (HS) response is crucial for cell survival in harmful environments. Nuclear lamin A/C, encoded by the LMNA gene, contributes towards altered gene expression during HS, but the underlying mechanisms are poorly understood. Here, we show that upon HS, lamin A/C was reversibly phosphorylated at serine 22 in concert with HSF1 activation in human cells, mouse cells and Drosophila melanogaster in vivo. Consequently, the phosphorylation facilitated nucleoplasmic localization of lamin A/C and nuclear sphericity in response to HS. Interestingly, lamin A/C knock-out cells showed deformed nuclei after HS and were rescued by ectopic expression of wild-type lamin A, but not by a phosphomimetic (S22D) lamin A mutant. Furthermore, HS triggered concurrent downregulation of lamina-associated protein 2α (Lap2α, encoded by TMPO) in wild-type lamin A/C-expressing cells, but a similar response was perturbed in lamin A/C knock-out cells and in LMNA mutant patient fibroblasts, which showed impaired cell cycle arrest under HS and compromised survival at recovery. Taken together, our results suggest that the altered phosphorylation stoichiometry of lamin A/C provides an evolutionarily conserved mechanism to regulate lamina structure and serve nuclear adaptation and cell survival during HS.

Keywords: Heat shock; Heat shock response; Lamin A/C; Lap2α; Phosphorylation.


Conflict of interest statement

Competing interests The authors declare no competing or financial interests.

Figures

Fig. 1.
Fig. 1.
Lamin A/C is phosphorylated at serine 22 upon HS. (A) Western blot (WB) analysis of lamin A/C (LAC), phospho-serine 22 lamin A/C (pSer22 LAC), phospho-serine 392 lamin A/C (pSer392 LAC) and heat shock factor 1 (HSF1) after 1–4 h heat shock (HS) at 42°C, and 3 h and 24 h recovery at 37°C in HeLa cells and primary human and mouse fibroblasts. Whole D. melanogaster flies were heat-shocked for 30 min at 37°C and left to recover for 3 or 7 h at 22°C. The average numerical values of signal intensities relative to loading control (GAPDH or actin) from individual experiments are shown below each blot. pSer22 and pSer392 lamin A/C levels were normalized to GAPDH and lamin A/C. (B) Quantification of pSer22 lamin A/C WB intensities upon HS and recovery in HeLa cells (n=5), human fibroblasts, mouse fibroblasts and D. melanogaster fruit flies (n=4). Plots show mean±s.d. and the individual datapoints. The shapes of the datapoints indicate each individual replicate. *P<0.05; **P<0.01 (Mann–Whitney test). (C) Heat shock experiment with synchronized HeLa cells. Aphidicolin was used to synchronize cells to G1/S phase and nocodazole to synchronize cells to mitosis (positive control). GAPDH was used as a loading control (n=2). (D) HeLa cells, human and mouse fibroblasts were cultured either in normal culture conditions or exposed to 4 h HS at 42°C, fixed and stained for lamin A/C (green), pSer22 lamin A/C (magenta) and DAPI (gray). The narrow panels show the orthogonal views of the yz-plane. Scale bars: 10 μm.
Fig. 2.
Fig. 2.
Phosphorylation of lamin A/C correlates with nuclear sphericity in response to HS. (A) Western blot analysis of control and patient fibroblasts carrying the p.S143P mutation in LMNA as detected with antbodies against lamin A/C, pSer22 lamin A/C and HSF1 upon 1–4 h HS at 44°C and at the recovery. The average numerical values of signal intensities relative to the loading control (GAPDH) are shown below each blot (n=5). pSer22 lamin A/C was normalized to GAPDH and lamin A/C. (B) Quantified pSer22 lamin A/C WB intensity in control and patient fibroblasts (n=8). The 0 h time point has been enlarged on the top right corner. *P<0.05 (Kruskal–Wallis/Dunn’s test). (C) Confocal microscopy images of LMNAWT/WT and LMNAWT/S143P fibroblasts stained for lamin A/C in normal culture conditions, after 1 h and 2 h HS at 44°C and after 3 h and 24 h recovery. The narrow panels show the orthogonal views of the yz-plane. Scale bars: 5 µm. (D) Lamin A/C fluorescence intensities at the lamina region and in the nucleoplasm were determined from the mid-plane confocal sections of randomly selected cells and the average ratios of the signals (nucleoplasm/lamina) were plotted (n=50, from three biological replicates). ***P<0.001; #, LMNAWT/WT control versus LMNAWT/WT HS; §, LMNAWT/S143P control versus LMNAWT/S143P HS (two-way ANOVA with Tukey's post hoc test). (E) Scatter plot of lamin A/C nucleoplasm/lamina intensity ratio versus pSer22 lamin A/C intensity determined from randomly selected cells at 37°C and after 1 h and 2 h HS at 44°C (n=70, two biological replicates). **P<0.01 (two-tailed unpaired t-test). (F,G) Nuclear area and nuclear sphericity of LMNAWT/WT and LMNAWT/S143P fibroblasts at 37°C, after 1–4 h HS at 44°C, and after 3 h and 24 h recovery at 37°C (n=50, from three biological replicates). *P<0.05; **P<0.01; ***P<0.001 (two-way ANOVA with Tukey’s post hoc test). (H) Scatter plot of nuclear sphericity versus nuclear area upon 0–2 h HS at 44°C (n=70, two biological replicates). **P<0.01; ***P<0.001 (two-tailed unpaired t-test). (I) Scatter plot of nuclear sphericity versus pSer22 lamin A/C intensity upon 0–2 h HS at 44°C (n=70). **P<0.01; ***P<0.001 (two-tailed unpaired t-test). Boxplots show the 75th, 50th and 25th percentiles, and the whiskers show the 95% c.i. for median. Line plots show the mean±s.e.m. Pearson correlation coefficients (R) are indicated.
Fig. 3.
Fig. 3.
The effect of kinase inhibition on lamin A/C phosphorylation under HS. (A) Immunoblots showing lamin A/C, pSer22 lamin A/C, HSF1, ERK1/2, pERK1/2, AKT, pAKT, caspase-3 and cleaved caspase-3 protein levels in control and heat-shocked HeLa cells treated with different kinase inhibitors. GAPDH was used as a loading control and HeLa cells treated with 2 µM staurosporine (STA) as a positive control for apoptotic cell death. The average numerical values of signal intensities relative to the loading control are shown (GAPDH and lamin A/C, n=5). (B) Quantification of pSer22 lamin A/C WB intensity change (%) in control cells and cells treated with kinase inhibitors after 4 h HS at 42°C (n=5). *P<0.05; **P<0.01 (Mann–Whitney test). (C) Confocal microscopy images of LMNAWT/WT and LMNAWT/S143P fibroblasts stained for lamin A/C (green) and pSer22 lamin A/C (red) at normal culture conditions and after 2 h HS at 44°C with or without STA treatment. Scale bars: 5 µm. (D,E) Corrected total cell fluorescence (CTCF) of average pSer22 lamin A/C intensity values under HS and STA treatment (n=50, from two biological replicates). ***P<0.001; §, compared to untreated 37°C; #, compared to STA 37°C (Kruskal–Wallis/Dunn’s test). (F,G) Nuclear area (F) and sphericity (G) were determined from LMNAWT/WT and LMNAWT/S143P fibroblasts after treatment with STA and exposure to 44°C for 1–2 h (n=50, from two biological replicates). *P<0.05 (two-way ANOVA with Tukey’s post hoc test). Boxplots show the 75th, 50th and 25th percentiles, and the whiskers show the 95% c.i. for median.
Fig. 4.
Fig. 4.
Knockout of the LMNA gene increases nuclear deformability under normal and HS conditions. (A) Western blot analysis showing the expression of lamin A/C, lamin B1 and lamin B2 in parental HeLa cells and cells treated with non-targeting (NT) sgRNA or two different lamin A/C-targeting sgRNAs (LAC KO1 and LAC KO2). (B) Expression of LMNA mRNA in parental HeLa, NT HeLa, LAC KO1 and LAC KO2 cells. (C) Immunofluorescence images of parental HeLa, NT HeLa, LAC KO1 and LAC KO2 cells stained with lamin A/C (green) and DAPI (gray). Scale bars: 20 μm. (D) Representative images from nuclear circularity analysis of NT, KO1 and KO2 cells, as well as KO1 cells transfected with either GFP-tagged WT-LA, S22D-LA or S22A-LA cells at 37°C and after 4 h HS at 42°C. HeLa NT, KO1 and KO2 were stained for lamin A/C (green). All cells were stained with DAPI (blue). Scale bars: 5 μm. (E) Nuclear circularity of parental HeLa, NT HeLa, LAC KO1 and LAC KO2 cells under normal and HS conditions (n=200, from four biological replicates), ***P<0.001, #: compared to HeLa and NT HeLa control, §: compared to HeLa and NT HeLa HS. (F) Nuclear circularity of LAC KO1 cells and cells transfected with either GFP-tagged WT-LA, S22D-LA or S22A-LA under control condition and after 4 h heat shock at 42°C (n=100, from four biological replicates). Boxplots show the 75th, 50th and 25th percentiles, and the whiskers show the 95% c.i. for median. *P<0.05; ***P<0.001 (two-way ANOVA with Tukey's post hoc test). #, compared to LAC KO1 control; §, compared to LAC KO1 HS.
Fig. 5.
Fig. 5.
Lamin A/C phosphorylation at Ser22 is independent of HSF1. (A) Western blot analysis of lamin A/C, pSer22 lamin A/C, heat shock factor 1 (HSF1), and heat shock protein 70 (HSP70) upon HS and after 3 h and 24 h recovery. The average numerical values of signal intensities relative to the loading control (HSC70) are shown below each blot. pSer22 lamin A/C levels were normalized to HSC70 and lamin A/C levels (n=4). (B) Quantification of lamin A WB intensities upon HS and after 3 h and 24 h recovery. Plots show the mean±s.d. *P<0.05; **P<0.01 (Kruskal–Wallis/Dunn’s test). (C) Confocal microscopy images of parental HeLa cells and HSF1-silenced cells stained for lamin A/C, pSer22 lamin A/C and DAPI under normal culture conditions and after 4 h HS. Scale bars: 20 µm. (D) Quantification of nuclear area upon 2–4 h HS and after 24 h recovery. Boxplots show the 75th, 50th and 25th percentiles, and the whiskers show the 95% c.i. for median. ***P<0.001; #, compared to WT control; §, compared to shHSF1 control (two-way ANOVA with Tukey's post hoc test).
Fig. 6.
Fig. 6.
Lap2α is degraded in a lamin A/C-dependent manner under HS. (A) Proximity ligation assay (PLA) with antibodies against lamin A/C and Lap2α was carried out on control and heat-shocked cells. Maximum projections of confocal images are shown. Scale bars: 10 μm. Lamin A/C KO1 cells were used as a negative control. (B) Quantification of PLA signals per nucleus (n=200, three biological replicates). Data show individual observations and mean values of each replicate. ***P<0.001 (two-tailed unpaired Student's t-test). (C) Western blot analysis showing lamin A/C and Lap2α levels in HeLa, NT HeLa and LAC KO1 cells at different time points under HS and at the recovery. The average numerical values of signal intensities relative to the loading control (GAPDH) are shown below the blot. Each cell line has been normalized to its own control sample to highlight the change of Lap2α protein levels between the time points (n=5). (D) Confocal microscopy images showing Lap2α aggregation upon 4 h heat shock in HeLa, NT HeLa and LAC KO1 cells. Scale bars: 5 μm. (E) Western blot analysis of LAC KO1 cells transfected with different GFP-tagged lamin A vectors and detected with antibodies against pSer22 lamin A, HSF1 and Lap2α. The average numerical values of signal intensities relative to the loading control (actin) are shown below the blot (n=3). (F) Western blot analysis of Lap2α protein levels in heat-shocked parental HeLa cells treated with either 10 μM cycloheximide (CHX), 10 μM epoxymycin (EPO), 10 μM chloroquine (CQ) or both EPO and CQ. The average numerical values of signal intensities relative to the loading control (GAPDH) and percentage of intensity change between control and heat-shocked cells are shown below the blot (n=2).
Fig. 7.
Fig. 7.
LMNA mutant cells are hypersensitive to severe HS. (A) Western blot analysis of LMNAWT/WT and LMNAWT/S143P fibroblasts as detected with antibodies against Lap2α and cleaved PARP-1. The average numerical values of signal intensities relative to the loading control (GAPDH) are shown below each blot (Lap2α, n=5; cleaved PARP-1, n=2). (B) Quantification of Lap2α WB intensities under HS (n=5). (C) Representative confocal images of LMNAWT/WT and LMNAWT/S143P cells cultured in normal conditions or exposed to 44°C for 2 h prior to fixation. The cells were stained for Lap2α (magenta), Ki-67 (green) and DAPI (gray). Scale bars: 10 μm. (D) The percentage of Ki-67-positive cells at 37°C and after 1–4 h at 44°C (n=1200, from four biological replicates). (E) The percentage of mitotic cells at 37°C and after 1–4 h HS at 44°C (n=900, from three biological replicates). (F) Cell numbers counted after 2 h HS at 44°C (time point 0 h) and after 24 h, 48 h and 96 h recovery at 37°C (n=5). Line plots show the mean±s.d. and datapoints from each replicate. *P<0.05; **P<0.01; ***P<0.001 (Kruskal–Wallis/Dunn’s test). #, compared to LMNAWT/WT control; §, compared to LMNAWT/S143P control.

References

    1. Adli, M. (2018). The CRISPR tool kit for genome editing and beyond. Nat. Commun. 9, 1911. 10.1038/s41467-018-04252-2 - DOI - PMC - PubMed
    1. Åkerfelt, M., Morimoto, R. I. and Sistonen, L. (2010). Heat shock factors: integrators of cell stress, development and lifespan. Nat. Rev. Mol. Cell Biol. 11, 545-555. 10.1038/nrm2938 - DOI - PMC - PubMed
    1. Bainer, R. and Weaver, V. (2013). Strength under tension. Science 341, 965-966. 10.1126/science.1243643 - DOI - PubMed
    1. Buxboim, A., Swift, J., Irianto, J., Spinler, K. R., Dingal, P. C. D. P., Athirasala, A., Kao, Y. R. C., Cho, S., Harada, T., Shin, J. W.et al. (2014). Matrix elasticity regulates lamin-A,C phosphorylation and turnover with feedback to actomyosin. Curr. Biol. 24, 1909-1917. 10.1016/j.cub.2014.07.001 - DOI - PMC - PubMed
    1. Carlson, S. M., Chouinard, C. R., Labadorf, A., Lam, C. J., Schmelzle, K., Fraenkel, E. and White, F. M. (2011). Large-scale discovery of ERK2 substrates identifies ERK-mediated transcriptional regulation by ETV3. Sci. Signal. 4, rs11. 10.1126/scisignal.2002010 - DOI - PMC - PubMed

Publication types

LinkOut - more resources