. 2023 Jan 1;16(1):dmm049727.
doi: 10.1242/dmm.049727. Epub 2023 Jan 25.

Increased cysteine metabolism in PINK1 models of Parkinson's disease

Affiliations

Increased cysteine metabolism in PINK1 models of Parkinson's disease

Marco Travaglio et al. Dis Model Mech. .

Abstract

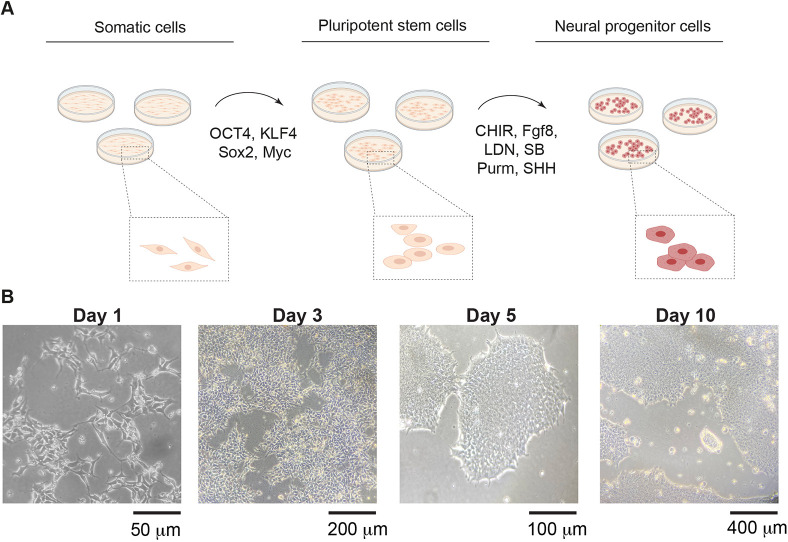
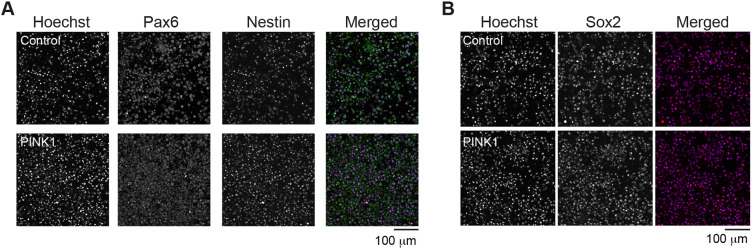
Parkinson's disease (PD), an age-dependent neurodegenerative disease, is characterised by the selective loss of dopaminergic neurons in the substantia nigra (SN). Mitochondrial dysfunction is a hallmark of PD, and mutations in PINK1, a gene necessary for mitochondrial fitness, cause PD. Drosophila melanogaster flies with pink1 mutations exhibit mitochondrial defects and dopaminergic cell loss and are used as a PD model. To gain an integrated view of the cellular changes caused by defects in the PINK1 pathway of mitochondrial quality control, we combined metabolomics and transcriptomics analysis in pink1-mutant flies with human induced pluripotent stem cell (iPSC)-derived neural precursor cells (NPCs) with a PINK1 mutation. We observed alterations in cysteine metabolism in both the fly and human PD models. Mitochondrial dysfunction in the NPCs resulted in changes in several metabolites that are linked to cysteine synthesis and increased glutathione levels. We conclude that alterations in cysteine metabolism may compensate for increased oxidative stress in PD, revealing a unifying mechanism of early-stage PD pathology that may be targeted for drug development. This article has an associated First Person interview with the first author of the paper.

Keywords: Drosophila; Metabolism; Mitochondria; PINK1; Parkinson's disease; Stem cell research.


Conflict of interest statement

Competing interests L.M.M., M.T., Y.Y. and R.P. declare no conflicts of interest. M.C., F.M. and E.F. are employees of AstraZeneca and have stock ownership and/or stock options or interests in the company.

Figures

Fig. 1.
Fig. 1.
Pink1-mutant flies show alterations in cysteine metabolism. (A) Workflow used to identify metabolic alterations in Drosophila pink1-mutant flies. The canonical pathways algorithm (Ingenuity Pathway Analysis) was used to determine changes in amino acid metabolism pathways. (B) Coordinated changes in the network of cysteine metabolites detected in pink1-mutant flies. Red or blue correspond to the metabolites that were significantly up- or downregulated, respectively (P≤0.05). The statistical significance was determined using Welch's two-sample t-test (n=8). Numbers encircled in green denote relevant pathways linked to cysteine metabolism. (C) Increased mitochondrial reactive oxygen species (ROS) in the brain of pink1-mutant flies. Top: Schematic of analysed brain area. Middle: Representative confocal images. Bottom: Quantitative analysis of mitochondrial ROS by using a MitoSOX Red mitochondrial superoxide indicator in control and pink1 genotypes. Intensity levels are visualised using a five-tone heatmap. Data are shown as the mean±s.e.m. (n=3 per genotype; asterisks, two-tailed Student's t-test, *P<0.05). (D) Workflow used to identify transcriptome changes in pink1-mutant flies. (E) Analysis of the canonical pathways in Drosophila pink1-mutant flies. Red and blue circles correspond to pathways (as shown at the y-axis) that are significantly up- (Z≥2) or downregulated (Z≤−2). (F) Plotted is the upregulation of pathway components for cysteine biosynthesis (red) and the concomitant downregulation of components relevant in the mitochondrial electron transport chain (blue) in pink1-mutant flies. (G) Schematic of the integrated metabolomics and transcriptomics alterations in the cysteine metabolism in Drosophila pink1 mutants. Three transcripts involved in synthesis and degradation of cysteine, i.e. cystathionine gamma-lyase (CTH), adenosyl homocysteinase (AHCY) and aspartate aminotransferase 2 (GOT2)] are upregulated in pink1-mutant flies (log2-fold change ≥1.5). (H) Comparison of metabolic alterations in the cysteine metabolism of pink1-mutant or parkin-mutant flies. The red outline corresponds to a comparison with lower statistical significance (0.05<P<0.10). The statistical significance was determined using Welch's two-sample t-test (n=8). Genotypes used: w; +; daGAL4/+ (control) and pink1B9; +; +, (pink1) for A-G; w1118; +; +(control) and w; +; park25 (parkin) for H. Metabolites significantly upregulated are indicated in red; metabolites significantly downregulated blue; P≤0.05 (A,B,D-H).
Fig. 2.
Fig. 2.
Characterisation of iPSC-derived NPCs. (A) Outline of the neural differentiation protocol used to obtain neural precursor cells (NPCs) from human somatic cells via cell reprogramming. Further details can be found in Materials and Methods. Illustration was created using BioRender. CHIR, CHIR99021; LDN, LDN193189; Purm, purmorphamine; SB, SB431542; SHH, SHH-C24II. (B) Representative phase-contrast images showing the overall morphology of cells across the differentiation timeline. Images are from three independent experiments.
Fig. 3.
Fig. 3.
Analysis of neural progenitor markers in PINK1-mutant NPCs. (A,B) Immunofluorescence images showing the levels of Pax6 and nestin (A) or Sox2 (B) in control and PINK1-mutant NPCs (PINK1). Images are from three independent experiments. Control, CRISPR–Cas9-corrected N368I; PINK1, PINK1 I368N.
Fig. 4.
Fig. 4.
PINK1-mutant cells show mitochondrial deficits and increased respiration. (A) Representative immunofluorescence images showing a loss in mitochondrial membrane potential (Δσm) in PINK1-mutant NPCs (PINK1). (B) Quantitative analysis of TMRM fluorescence for CRISPR–Cas9-corrected N368I (control) and PINK1 I368N (PINK1). Analysis was performed in iPSC-derived NPCs 12 days post differentiation. Intensity levels are visualised according to a five-tone heatmap (mean±s.e.m.; ****P<0.0001, unpaired Student's t-test, n=3). (C) Schematic of the workflow measuring the oxygen consumption rate (OCR) in NPCs. (D) Basal respiration levels of PINK1 NPCs are similar to those of control cells (mean±s.e.m.; unpaired Student's t-test, n=3). Each circle indicates the average OCR of five technical replicates per condition. Non-mitochondrial respiration was subtracted from each measurement. (E) PINK1 NPCs show a significant decrease in cellular ATP. ATP levels were measured by mass spectrometry (mean±s.e.m.; *P<0.05, unpaired Student's t-test, n=3). (F) PINK1 NPCs show an increased proton leak (mean±s.e.m.; **P<0.01, unpaired Student's t-test, n=3). Genotypes: control, CRISPR−Cas9-corrected N368I; PINK1, PINK1 I368N.
Fig. 5.
Fig. 5.
Enhanced glycolysis in PINK1-mutant NPCs. (A) Analysis of basal glycolysis in PINK1-mutant NPCs (PINK1) and control cells (mean±s.e.m.; *P<0.05, unpaired Student's t-test, n=6-7) as determined by Seahorse ECAR assay. Each circle indicates the average glycolytic proton efflux rate (glycoPER). (B-D) Assessment of mitochondrial mass in PINK1-mutant cells shows equivalent mass in control and PINK1-mutant NPCs. Mitochondrial mass was evaluated by either normalising levels of the mitochondrial marker TOMM20 to those of the transcription factor Sox2 (B,C) or by comparing the activity of the mitochondrial matrix enzyme citrate synthase in control and PINK1-mutant cells (D); unpaired Student's t-test, n=5. Representative immunofluorescence images (B) and quantitative analysis (C) in the indicated genotype. Analysis was performed in iPSC-derived NPCs 12 days post differentiation. Intensity levels of TOMM20 were normalised to those of Sox2 (mean±s.e.m., unpaired Student's t-test, n=3). Data are the result of three independent experiments. Genotypes: control, CRISPR−Cas9-corrected N368I; PINK1, PINK1 I368N.
Fig. 6.
Fig. 6.
Increased cysteine metabolism in PINK1-mutant NPCs. (A) Workflow used for the identification of intracellular and intercellular metabolites by mass spectrometry. (B,C) Principal component analysis (PCA) of intracellular (B) and extracellular (C) global metabolic changes in PINK1 NPCs (PINK1). (D,E) Significantly increased (red) or decreased (blue) intracellular (D) or extracellular (E) metabolites in PINK1 NPCs. Significance was determined using Student's t-test; with P<0.05 considered significantly different and an absolute log2-fold-change >0.5. Dashed lines denote significance levels of metabolites above −(log10) P>1.3 and log2-fold changes of >0.5 or −0.5. (F) Altered metabolites in the extracellular space of PINK1 NPCs. Red and blue correspond to significantly up- or downregulated metabolites, respectively (P≤0.05). Statistical significance was determined using Welch's two-sample Student's t-test (n=3). (G) Coordinated changes in the metabolite abundance in PINK1 NPCs. Shown on the left are the relative levels of selected metabolites in the intracellular space of PINK1 NPCs (detected with mass spectrometry and liquid chromatography with tandem mass spectrometry analysis). Data are the result of one experiment with three technical replicates. Genotypes: control, CRISPR−Cas9-corrected N368I; PINK1, PINK1 I368N.

Similar articles

Cited by

References

    1. Ando, M., Fiesel, F. C., Hudec, R., Caulfield, T. R., Ogaki, K., Górka-Skoczylas, P., Koziorowski, D., Friedman, A., Chen, L., Dawson, V. L.et al. (2017). The PINK1 p.I368N mutation affects protein stability and ubiquitin kinase activity. Mol. Neurodegener. 12, 32. 10.1186/s13024-017-0174-z - DOI - PMC - PubMed
    1. Bezard, E., Yue, Z., Kirik, D. and Spillantini, M. G. (2013). Animal models of Parkinson's disease: limits and relevance to neuroprotection studies. Movement Disorder. 28, 61-70. 10.1002/mds.25108 - DOI - PMC - PubMed
    1. Celardo, I., Martins, L. M. and Gandhi, S. (2014). Unravelling mitochondrial pathways to Parkinson's disease. Br. J. Pharmacol. 171, 1943-1957. 10.1111/bph.12433 - DOI - PMC - PubMed
    1. Celardo, I., Costa, A. C., Lehmann, S., Jones, C., Wood, N., Mencacci, N. E., Mallucci, G. R., Loh, S. H. Y. and Martins, L. M. (2016). Mitofusin-mediated ER stress triggers neurodegeneration in pink1/parkin models of Parkinson's disease. Cell Death Dis. 7, e2271. 10.1038/cddis.2016.173 - DOI - PMC - PubMed
    1. Celardo, I., Lehmann, S., Costa, A. C., Loh, S. H. Y. and Miguel Martins, L. (2017). dATF4 regulation of mitochondrial folate-mediated one-carbon metabolism is neuroprotective. Cell Death Differ. 24, 638-648. 10.1038/cdd.2016.158 - DOI - PMC - PubMed

Publication types

MeSH terms