. 2023 Feb 3;22(2):491-500.
doi: 10.1021/acs.jproteome.2c00714. Epub 2023 Jan 25.

Data-Driven and Machine Learning-Based Framework for Image-Guided Single-Cell Mass Spectrometry

Data-Driven and Machine Learning-Based Framework for Image-Guided Single-Cell Mass Spectrometry

Yuxuan Richard Xie et al. J Proteome Res. .

Abstract

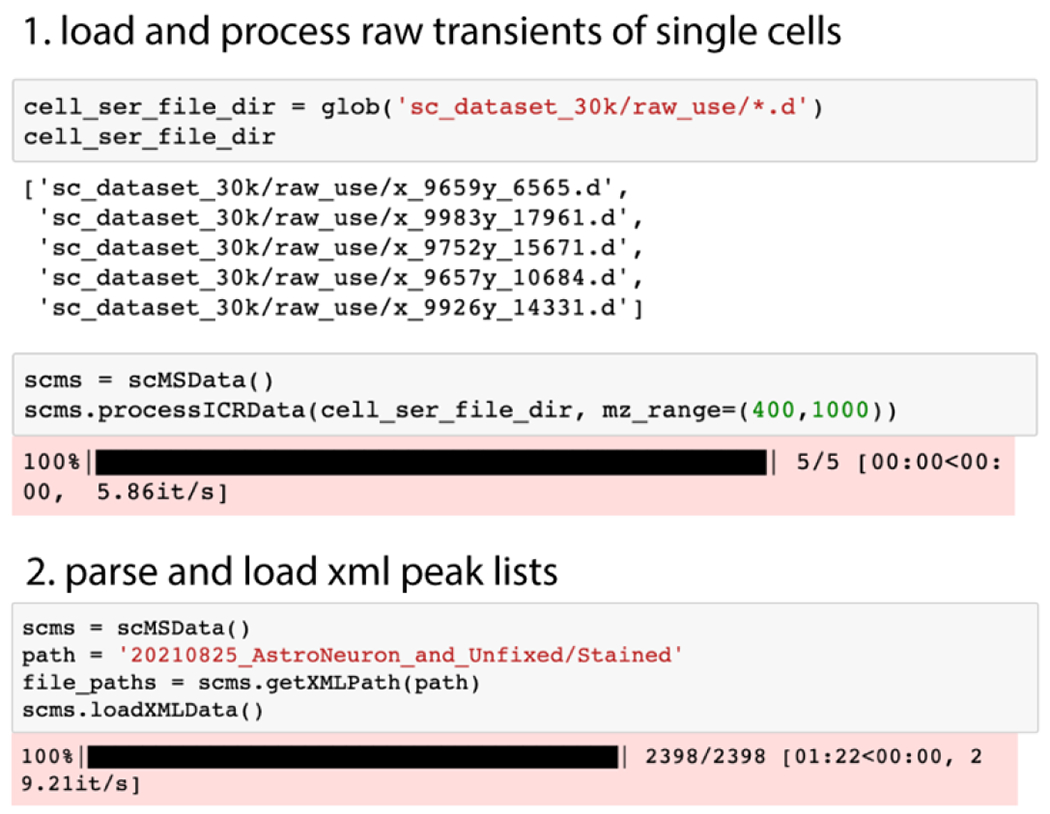
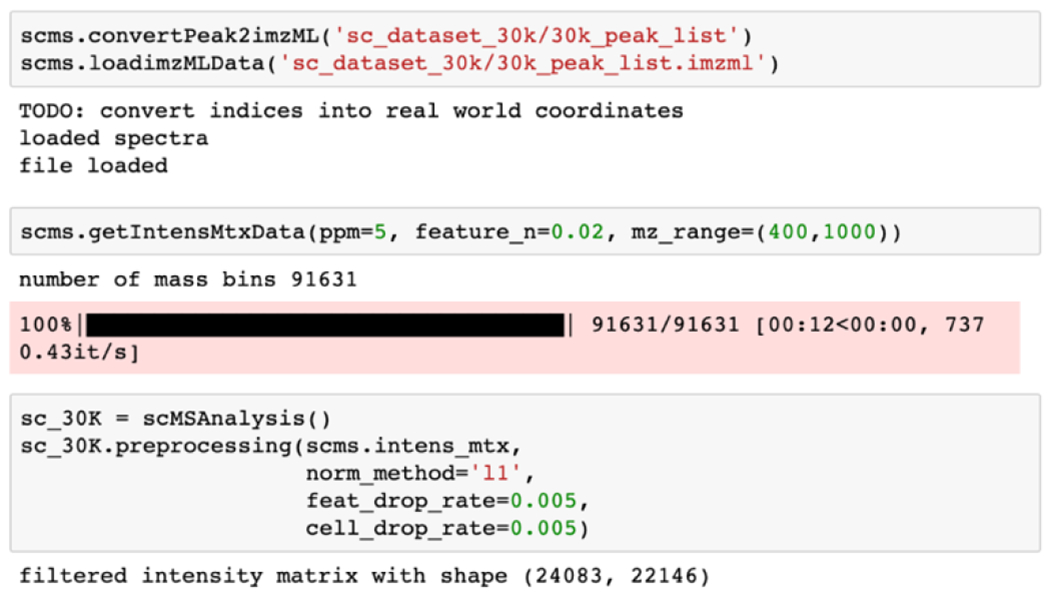
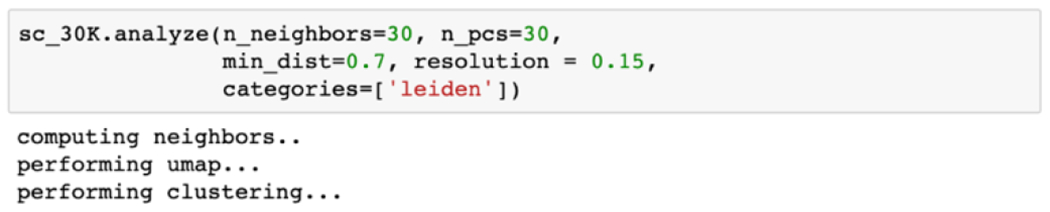
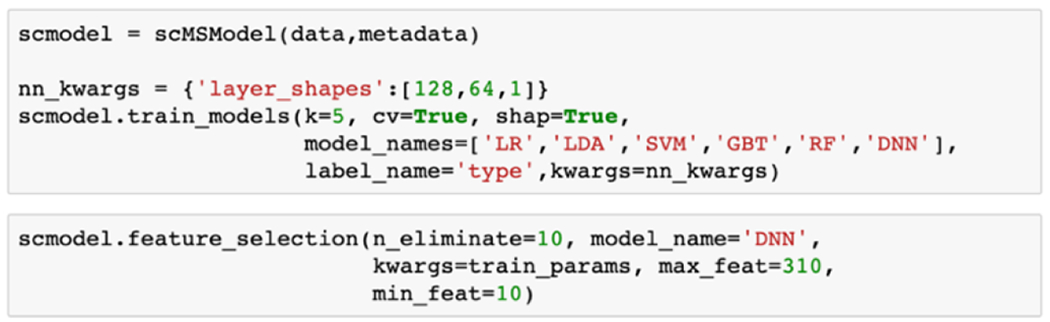
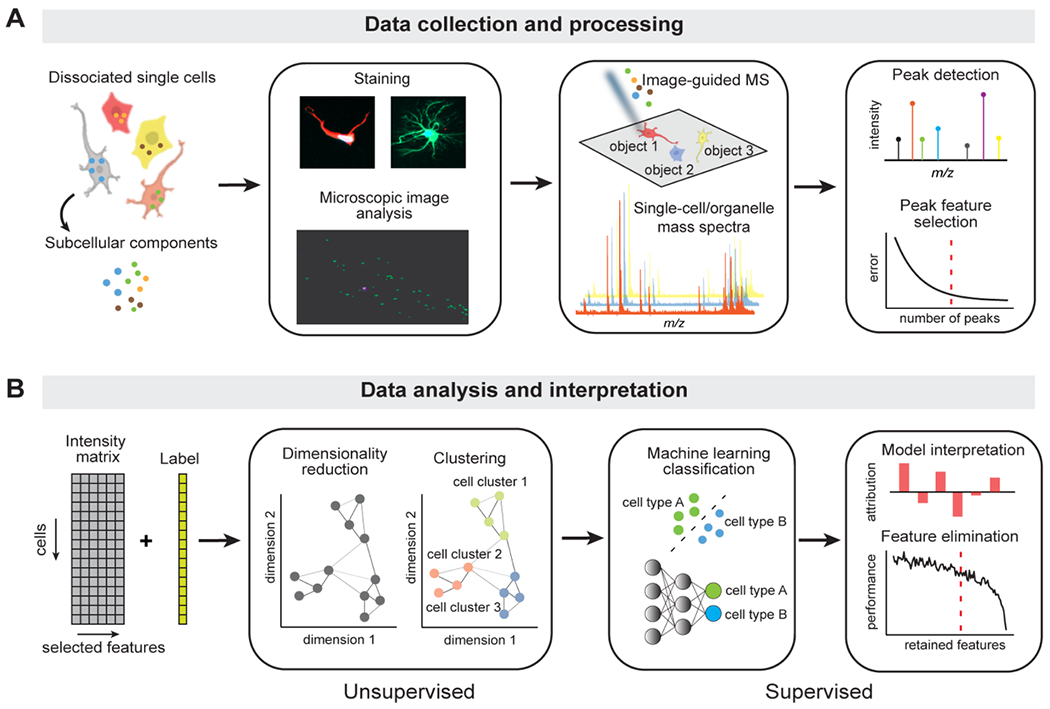
Improved throughput of analysis and lowered limits of detection have allowed single-cell chemical analysis to go beyond the detection of a few molecules in such volume-limited samples, enabling researchers to characterize different functional states of individual cells. Image-guided single-cell mass spectrometry leverages optical and fluorescence microscopy in the high-throughput analysis of cellular and subcellular targets. In this work, we propose DATSIGMA (DAta-driven Tools for Single-cell analysis using Image-Guided MAss spectrometry), a workflow based on data-driven and machine learning approaches for feature extraction and enhanced interpretability of complex single-cell mass spectrometry data. Here, we implemented our toolset with user-friendly programs and tested it on multiple experimental data sets that cover a wide range of biological applications, including classifying various brain cell types. Because it is open-source, it offers a high level of customization and can be easily adapted to other types of single-cell mass spectrometry data.

Keywords: data-driven analysis; machine learning; mass spectrometry; single-cell analysis.


Conflict of interest statement

CONFLICT OF INTEREST.

The authors declare no competing financial interest.

Figures

Demo code 1.
Demo code 1.
Demo code 2.
Demo code 2.
Demo code 3.
Demo code 3.
Demo code 4.
Demo code 4.
Figure 1.
Figure 1.. The overview of DATSIGMA.
(A) The workflow of the data collection and processing steps. Populations of isolated single cells or organelles are deposited on a glass slide. Brightfield or fluorescence microscopy is used to generate images used in guiding of the MS acquisition. Since the resulting high-resolution MS spectra have a large size, a subset of features is selected from the raw data for the optimized downstream analysis. (B) Illustration of the methods for analyzing and interpreting preprocessed single-cell or single-organelle MS data. Depending on the cell labels, exploratory unsupervised methods (dimensionality reduction and clustering) are used when no biological priors (labels) are given, and supervised methods (ML classification) to differentiate cells or organelles when ground truth labels are acquired. We can interpret the trained models through feature attributions and selections that are important to class predictions.
Figure 2.
Figure 2.. Fast and reproducible preprocessing of large high-resolution single-cell data sets.
(A) Offline visualization and processing of a raw Fourier-transform ion cyclotron resonance transient signal of a single cell provides the mass spectrum with full resolution for enhanced peak detection. (B) Low-rank reconstruction of the data set with m/z features ranked by statistical leverage scores allows (C) selection of a subset of important features and removal of less variable and noise-related artefacts without the use of intensity thresholding. (D) Explained variance for the first 10 principal components. (E) First principal component plotted against the total normalized signal intensity per cell, colored by the fraction of nonzero features.
Figure 3.
Figure 3.. Exploratory analysis of neuronal cell heterogeneity with DATSIGMA.
(A) Cells were filtered based on the fluorescent intensity levels of the markers to only include the neuronal cell populations for further analysis. (B) Microscopic images of the included cells display clear neuronal morphology, while the corresponding mass spectra are notably different. (C) UMAP and Leiden clustering of the mass spectral profiles from 600 selected neuronal cells encapsulates the cell-to-cell differences of probable neuronal subpopulations. (D) Volcano plot of the differential analysis identifies features that are highly specific to cluster 4, with some putatively assigned to lipids with a 3 ppm error threshold.
Figure 4.
Figure 4.. Classification of cell or organelle types and feature elimination using machine learning.
(A) We evaluated the performance (F1 score) of different machine learning models through cross-validation for the neuron vs. astrocyte (top) and dense-core vs. lucent vesicle (bottom) classification. (B) Model performances as the input features ranked by their importance scores are iteratively eliminated for training. When performance drops, we heuristically selected the retained features as the minimal feature set. (C) Intensity difference of the average spectra between cell or organelle types, with retained m/z features highlighted in red.
Figure 5.
Figure 5.. Supervised UMAP and clustering of the Aplysia ganglion neuron data set.
(A) Confusion matrix of the model prediction on the test set. (B) Unsupervised UMAP of the 19,244 Aplysia neurons collected from 6 ganglia and UMAP of the SHAP values obtained from the model to predict the ganglion neuron types. Leiden clustering on the SHAP values shows 21 clusters. From the supervised clustering, we identified a particular cluster of neurons that have the feature contribution of buccalin toward model prediction of pedal ganglia.

Similar articles

Cited by

References

    1. Zenobi R Single-Cell Metabolomics: Analytical and Biological Perspectives. Science 2013, 342 (6163). 10.1126/science.1243259. - DOI - PubMed
    1. Oomen PE; Aref MA; Kaya I; Phan NTN; Ewing AG Chemical Analysis of Single Cells. Anal. Chem 2019, 91 (1), 588–621. 10.1021/acs.analchem.8b04732. - DOI - PubMed
    1. Neumann EK; Do TD; Comi TJ; Sweedler JV Exploring the Fundamental Structures of Life: Non-Targeted, Chemical Analysis of Single Cells and Subcellular Structures. Angewandte Chemie International Edition 2019, 58 (28), 9348–9364. 10.1002/anie.201811951. - DOI - PMC - PubMed
    1. Rubakhin SS; Romanova EV; Nemes P; Sweedler JV Profiling Metabolites and Peptides in Single Cells. Nat Methods 2011, 8 (4), S20–S29. 10.1038/nmeth.1549. - DOI - PMC - PubMed
    1. Tajik M; Baharfar M; Donald WA Single-Cell Mass Spectrometry. Trends in Biotechnology 2022, 0 (0). 10.1016/j.tibtech.2022.04.004. - DOI - PubMed

Publication types