. 2023 Jan;131(1):17004.
doi: 10.1289/EHP11155. Epub 2023 Jan 25.

Prenatal Exposure to PM2.5 Oxidative Potential and Lung Function in Infants and Preschool- Age Children: A Prospective Study

Affiliations

Prenatal Exposure to PM2.5 Oxidative Potential and Lung Function in Infants and Preschool- Age Children: A Prospective Study

Anouk Marsal et al. Environ Health Perspect. 2023 Jan.

Abstract

Background: Fine particulate matter (PM2.5) has been found to be detrimental to respiratory health of children, but few studies have examined the effects of prenatal PM2.5 oxidative potential (OP) on lung function in infants and preschool children.

Objectives: We estimated the associations of personal exposure to PM2.5 and OP during pregnancy on offspring objective lung function parameters and compared the strengths of associations between both exposure metrics.

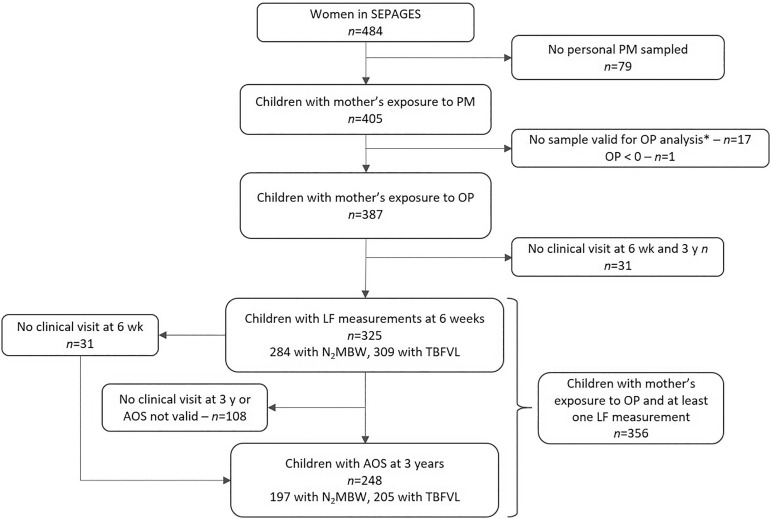
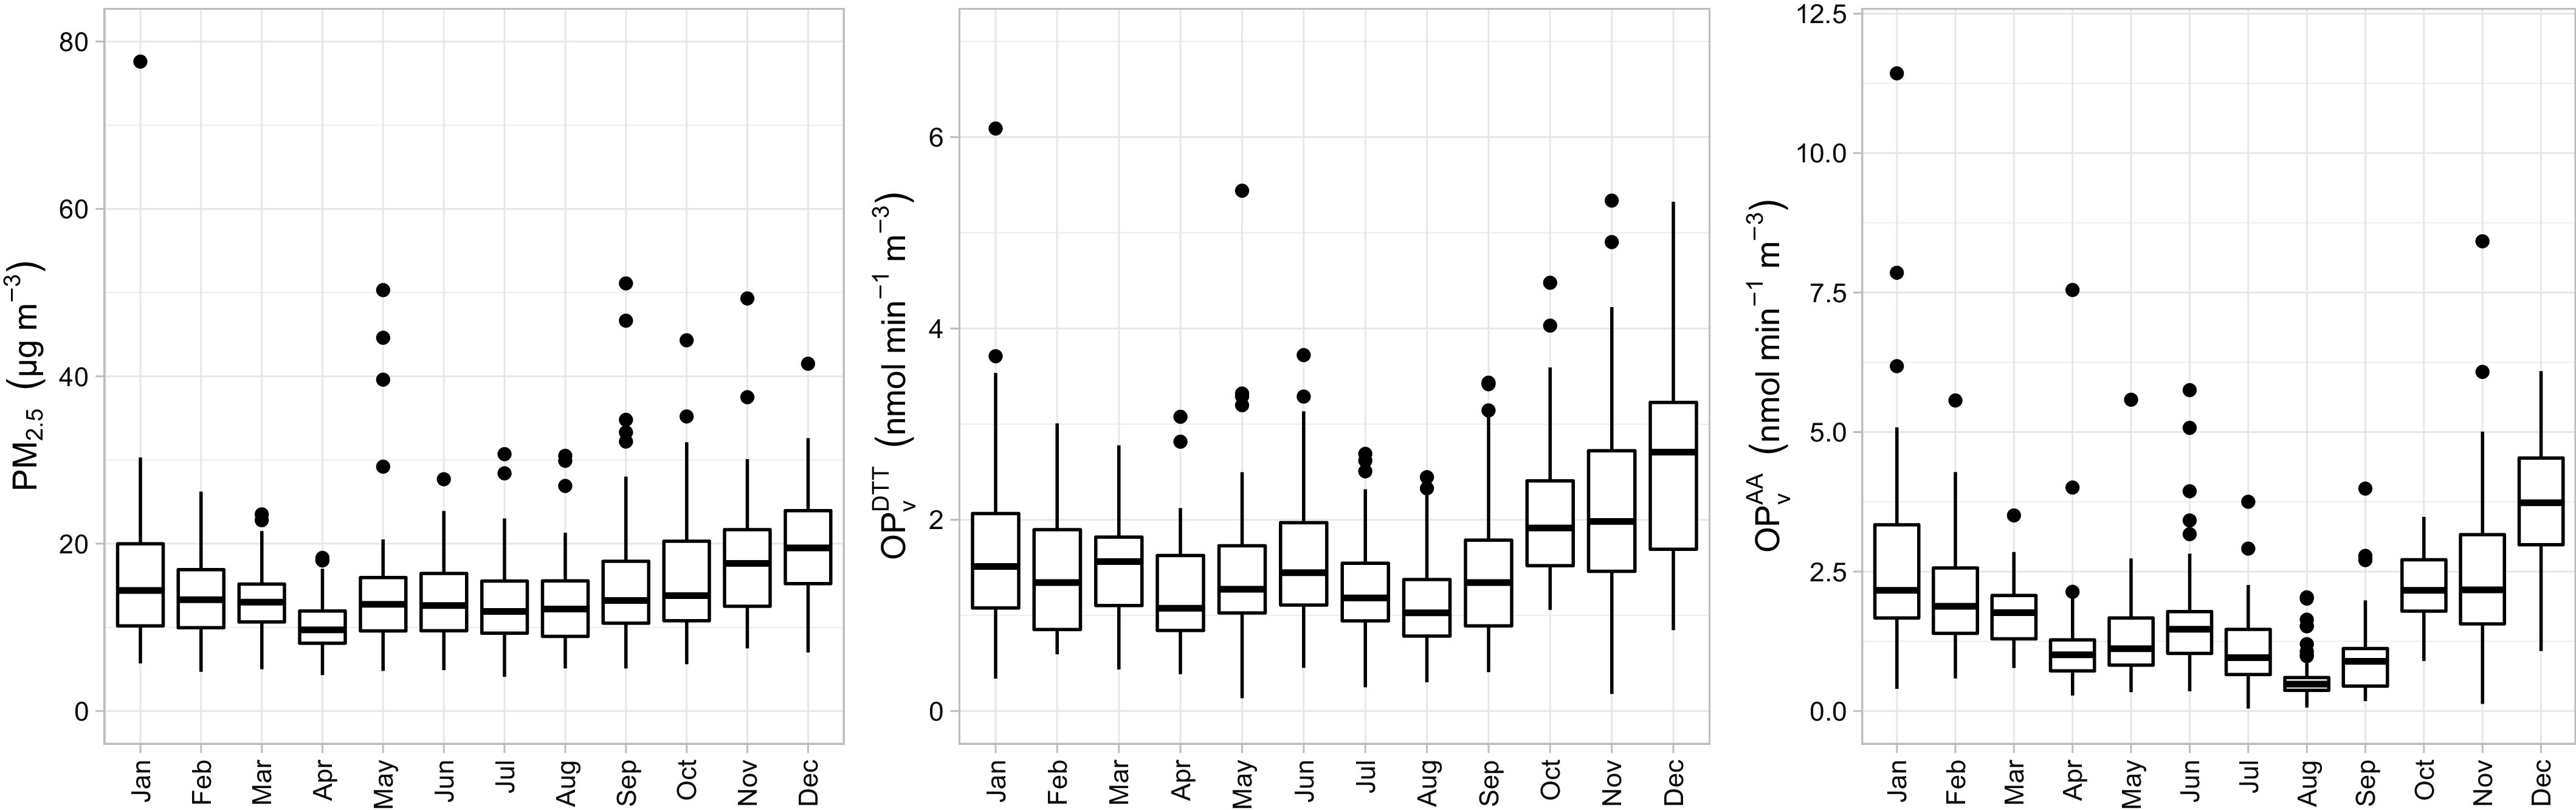
Methods: We used data from 356 mother-child pairs from the SEPAGES cohort. PM filters collected twice during a week were analyzed for OP, using the dithiothreitol (DTT) and the ascorbic acid (AA) assays, quantifying the exposure of each pregnant woman. Lung function was assessed with tidal breathing analysis (TBFVL) and nitrogen multiple-breath washout (N2MBW) test, performed at 6 wk, and airwave oscillometry (AOS) performed at 3 y. Associations of prenatal PM2.5 mass and OP with lung function parameters were estimated using multiple linear regressions.

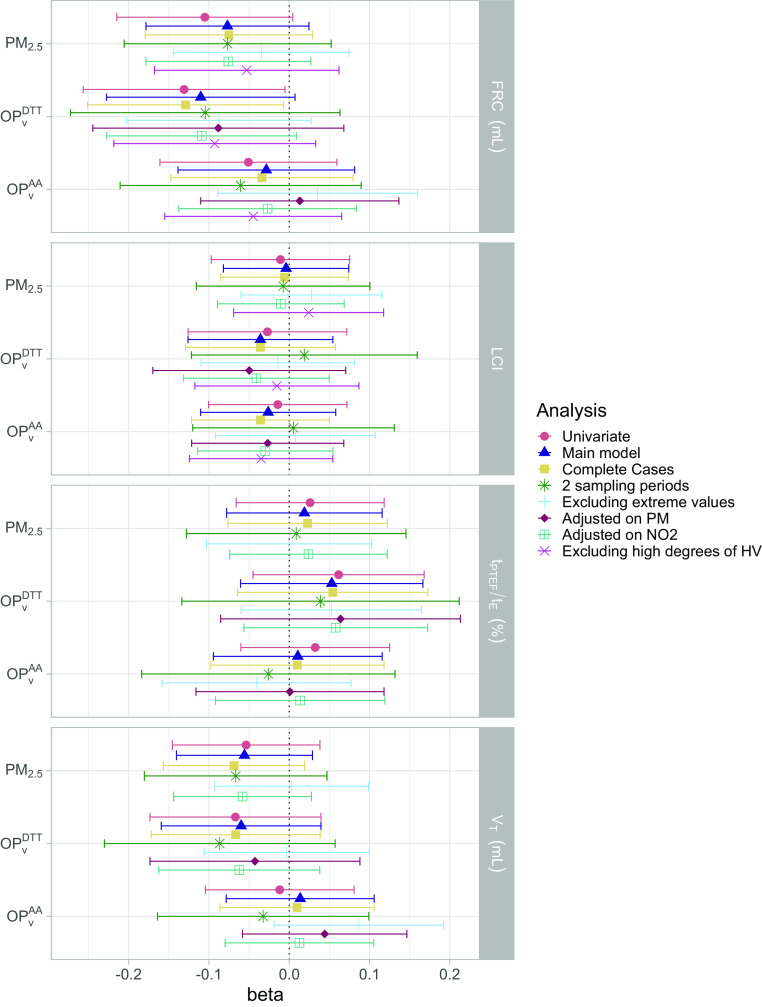
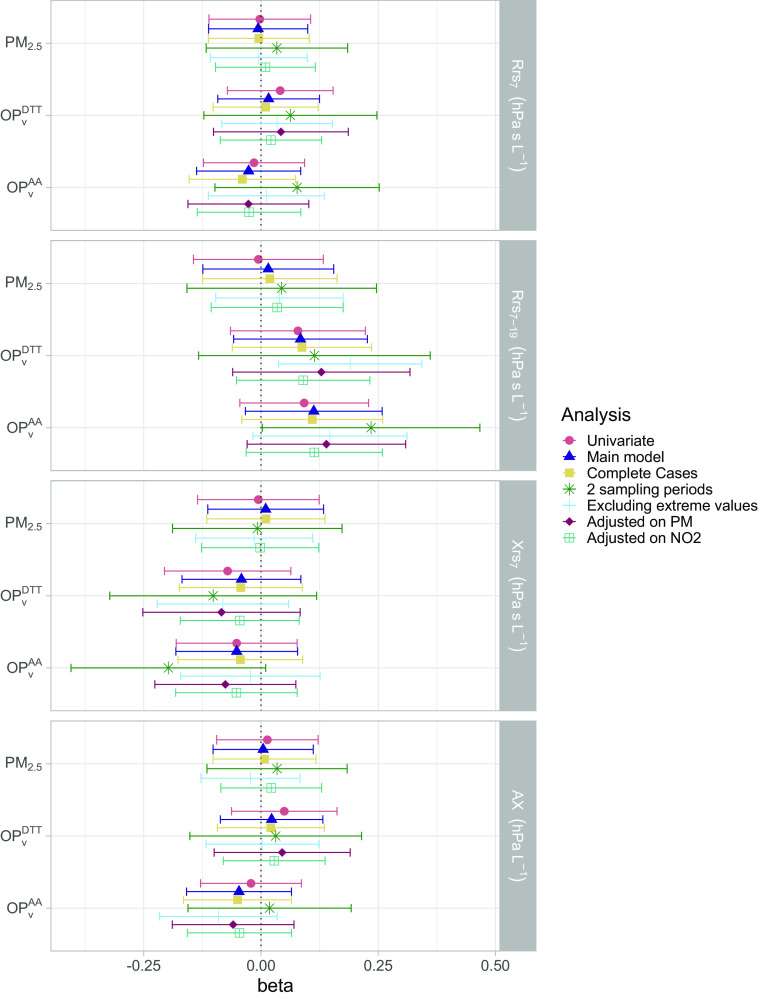
Results: In neonates, an interquartile (IQR) increase in OPvDTT (0.89 nmol/min/m3) was associated with a decrease in functional residual capacity (FRC) measured by N2MBW [β=-2.26mL; 95% confidence interval (CI): -4.68, 0.15]. Associations with PM2.5 showed similar patterns in comparison with OPvDTT but of smaller magnitude. Lung clearance index (LCI) and TBFVL parameters did not show any clear association with the exposures considered. At 3 y, increased frequency-dependent resistance of the lungs (Rrs7-19) from AOS tended to be associated with higher OPvDTT (β=0.09 hPa×s/L; 95% CI: -0.06, 0.24) and OPvAA (IQR=1.14 nmol/min/m3; β=0.12 hPa×s/L; 95% CI: -0.04, 0.27) but not with PM2.5 (IQR=6.9 μg/m3; β=0.02 hPa×s/L; 95% CI: -0.13, 0.16). Results for FRC and Rrs7-19 remained similar in OP models adjusted on PM2.5.

Discussion: Prenatal exposure to OPvDTT was associated with several offspring lung function parameters over time, all related to lung volumes. https://doi.org/10.1289/EHP11155.


Figures

Figure 1 is a flowchart with 6 steps. Step 1: There are 484 cases of women in SEPAGES. Step 2: There are 405 cases of children with their mother's exposure to particulate matter, after excluding 79 cases in which no personal particulate matter was sampled. Step 3: There are 387 children with oxidative potential from their mother, excluding 17 cases of no sample valid for oxidative potential analysis and 1 case of oxidative potential less than 0. Step 4: There are 325 cases of children with lung function measurements at 6 weeks, of which 284 cases are with nitrogen multiple-breath washout and 309 cases are with tidal breathing flow-volume loops. 31 cases were excluded with no clinical visit at both 6 weeks and 3 years. Out of 325, 108 cases were excluded for no clinical visit at 3 years or for airwave oscillometry not being valid, and 31 cases were excluded for no clinical visit at 6 weeks. Step 5: There are 248 cases of children with airwave oscillometry at 3 years; of those, 197 cases are with nitrogen multiple-breath washout and 205 cases are with tidal breathing flow-volume loops. Step 6: There are 356 children with their mother's oxidative potential exposure and at least one lung function measurement.
Figure 1.
Flow chart for the selection of the study population. Note: *PM2.5 net weight <4μg. AOS, airwave oscillometry; LF, lung function; N2MBW, nitrogen multiple-breath washout; OP, oxidative potential; PM, particulate matter; PM2.5, PM with aerodynamic diameter <2.5μm; TBFVL, tidal breathing flow-volume loops.
Figure 2 is a set of three box and whiskers graph, plotting particulate matter with a diameter smaller than 2.5 microns (in microgram per cubic meter), ranging from 0 to 80 in increments of 20; volume-normalized oxidative potential measured by the dithiothreitol assay (in nanomole per minute per cubic meter), ranging from 0 to 6 in increments of 2; volume-normalized oxidative potential measured by the ascorbic acid assay (in nanomole per minute per cubic meter), ranging from 0.0 to12.5 in increments of 2.5 (y-axis) across months from January to December (x-axis).
Figure 2.
Monthly distribution of personal measurements of PM2.5 (left), OPvDTT (center), and OPvAA (right). See Table S2 for corresponding numeric data. Note: Boxes represent 25th–75th percentiles; the middle horizontal line represents the median; whiskers extend to the most extreme point within 1.5 IQRs of the box and the dots outside boxes indicate outliers. Note: AA, ascorbic acid; DTT, dithiothreitol; IQR, interquartile range; OPvAA, volume-normalized oxidative potential measured by the AA assay (nmol/min/m3); OPvDTT, volume-normalized oxidative potential measured by the DTT assay (nmol/min/m3); PM, particulate matter; PM2.5, PM with an aerodynamic diameter <2.5μm (μg/m3).
Figure 3 is a set of four forest plots, plotting (bottom to top), volume-normalized oxidative potential measured by the ascorbic acid assay, volume-normalized oxidative potential measured by the dithiothreitol assay, particulate matter with a diameter smaller than 2.5 microns (left y-axis) and tidal volume (milliliter), ratio of time to peak tidal expiratory flow to expiratory time (percentage), lung clearance index, functional residual capacity (milliliter) (right y-axis) across beta, ranging from negative 0.2 to 0.2 in increments of 0.1 (x-axis) for Analysis, including Univariate, Main model, Complete Cases, 2 sampling periods, Excluding extreme values, Adjusted on Particulate matter, Adjusted on Nitrogen dioxide, and Excluding high degrees of H V.
Figure 3.
Association between personal exposure to PM2.5, OPvDTT, and OPvAA during pregnancy and lung function parameters measured at 6 wk in the univariate and multiple linear models and in the sensitivity analyses. Outcomes and exposures were scaled by their IQR. See Tables S4 and S6 for corresponding numeric data. Whiskers represent the 95% confidence interval around the estimate. The main model was adjusted on child’s height, weight, sex, age, season of sampling, breastfeeding, environmental tobacco smoke, maternal age and BMI before pregnancy, parental level of education, parental history of rhinitis, and mean temperature during pregnancy. In addition, “2 sampling periods” are the analyses reduced to the children that had 2 wk of prenatal measurements of air pollution (63%–66% of the population); “Excluding extreme values” are the analyses excluding the exposures and outcomes below the first percentile and above the 99th (exclusion of approximately 5% of the population); “Adjusted on PM” corresponds to adding personal exposure to PM2.5 in the set of confounders, “Adjusted on NO2” corresponds to adding personal exposure to NO2 in the set of confounders, and the last analyses were performed excluding children that had the highest hypoventilation degree during the nitrogen multiple breath washout test (excluding 25% of the population). Note: AA, ascorbic acid; BMI, body mass index; DTT, dithiothreitol; FRC, functional residual capacity; IQR, interquartile range; LCI, lung clearance index; OPvAA, volume-normalized oxidative potential measured by the AA assay (nmol/min/m3); OPvDTT, volume-normalized oxidative potential measured by the DTT assay (nmol/min/m3); PM, particulate matter; PM2.5, PM with an aerodynamic diameter <2.5μm (μg/m3); tPTEF/tE, ratio of time to peak tidal expiratory flow to expiratory time; VT, tidal volume.
Figure 4 is a set of four forest plots, plotting (bottom to top), volume-normalized oxidative potential measured by the ascorbic acid assay, volume-normalized oxidative potential measured by the dithiothreitol assay, particulate matter with a diameter smaller than 2.5 microns (left y-axis) and area under the reactance curve (hPa per Liter), reactance at a frequency of 7 hertz (hPa seconds per liter), difference between the resistance at 7 hertz and at 19 hertz (hPa seconds per liter), and resistance at a frequency of 7 hertz (hPa seconds per liter) (right y-axis) across beta, ranging negative 0.25 to 0.50 in increments of 0.25 (x-axis) for analysis, including Univariate, Main model, Complete Cases, 2 sampling periods, Excluding extreme values, Adjusted on Particulate matter, and Adjusted on nitrogen dioxide.
Figure 4.
Association between personal exposure to PM2.5, OPvDTT, and OPvAA during pregnancy and lung function parameters measured at 3 y in the univariate and multiple linear models and in the sensitivity analyses. Outcomes and exposures were scaled by their IQR. See Tables S5 and S7 for corresponding numeric data. Whiskers represent the 95% confidence interval around the estimate. The main model was adjusted on child’s height, weight, sex, age, season of sampling, breastfeeding, environmental tobacco smoke, maternal age and BMI before pregnancy, parental level of education, parental history of rhinitis and mean temperature during pregnancy. In addition, “2 sampling periods” are the analyses reduced to the children that had 2 wk of prenatal measurements of air pollution (61% of the population); “Excluding extreme values” are the analyses excluding the exposures and outcomes below the first percentile and above the 99th (exclusion of approx. 5% of the population); “Adjusted on PM” corresponds to adding personal exposure to PM2.5 in the set of confounders; “Adjusted on NO2” corresponds to adding personal exposure to NO2 in the set of confounders. Note: AA, ascorbic acid; AX, area under the reactance curve; BMI, body mass index; DTT, dithiothreitol; IQR, interquartile range; OPvAA, volume-normalized oxidative potential measured by the AA assay (nmol/min/m3); OPvDTT, volume-normalized oxidative potential measured by the DTT assay (nmol/min/m3); PM, particulate matter; PM2.5, PM with an aerodynamic diameter <2.5μm (μg/m3); Rrs7, resistance at a frequency of 7 Hz; Rrs719, difference between the resistance at 7 Hz and at 19 Hz; Xrs7, reactance at a frequency of 7 Hz.

Similar articles

Cited by

References

    1. Janssen NAH, Brunekreef B, van Vliet P, Aarts F, Meliefste K, Harssema H, et al. . 2003. The relationship between air pollution from heavy traffic and allergic sensitization, bronchial hyperresponsiveness, and respiratory symptoms in Dutch schoolchildren. Environ Health Perspect 111(12):1512–1518, PMID: , 10.1289/ehp.6243. - DOI - PMC - PubMed
    1. Murray CJL, Aravkin AY, Zheng P, Abbafati C, Abbas KM, Abbasi-Kangevari M, et al. . 2020. Global burden of 87 risk factors in 204 countries and territories, 1990–2019: a systematic analysis for the global burden of disease study 2019. Lancet 396(10258):1223–1249, 10.1016/S0140-6736(20)30752-2. - DOI - PMC - PubMed
    1. WHO (World Health Organization). 2016. Ambient Air Pollution: A Global Assessment of Exposure and Burden of Disease. https://www.who.int/phe/publications/air-pollution-global-assessment/en/ [accessed 5 May 2021].
    1. Capello F, Pili G. 2018. Air Pollution in Infancy, Childhood and Young Adults. In: Clinical Handbook of Air Pollution-Related Diseases. Capello F, Gaddi AV, eds. Cham, Switzerland: Springer International Publishing, 141–186, 10.1007/978-3-319-62731-1_10. - DOI
    1. Sly PD, Flack F. 2008. Susceptibility of children to environmental pollutants. Ann NY Acad Sci 1140(1):163–183, PMID: , 10.1196/annals.1454.017. - DOI - PubMed

Publication types