

Physical inactivity by tail suspension alters markers of metabolism, structure, and autophagy of the mouse heart
- PMID: 36695670
- PMCID: PMC9875748
- DOI: 10.14814/phy2.15574
Physical inactivity by tail suspension alters markers of metabolism, structure, and autophagy of the mouse heart
Abstract
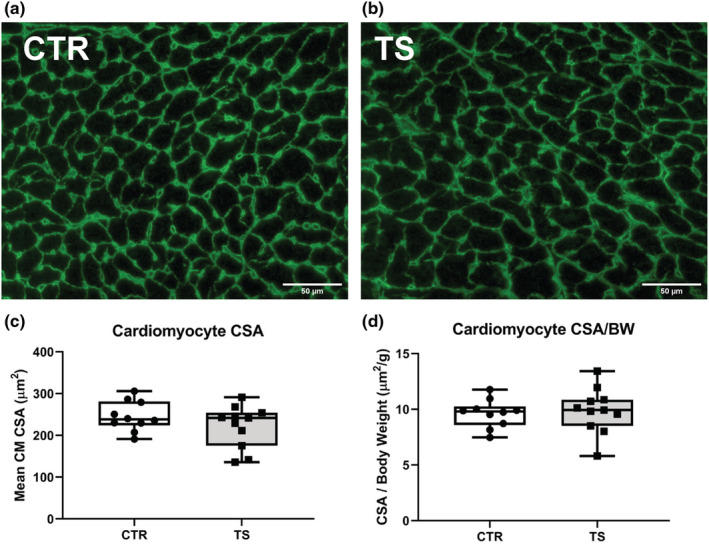
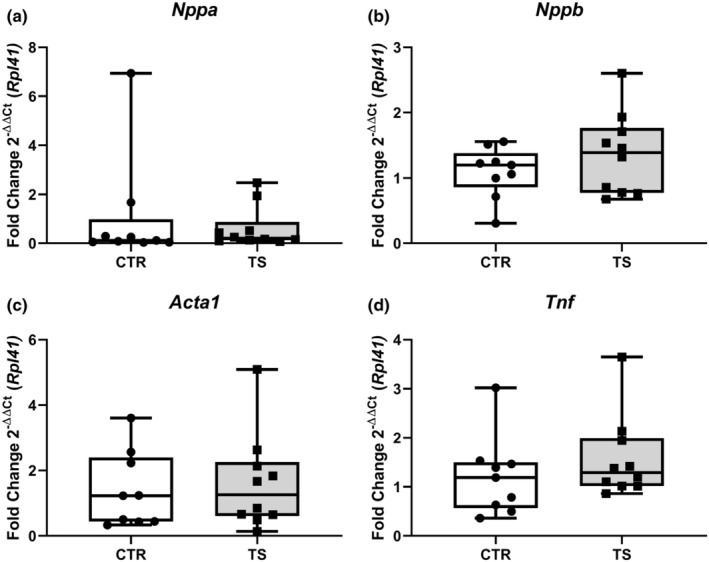
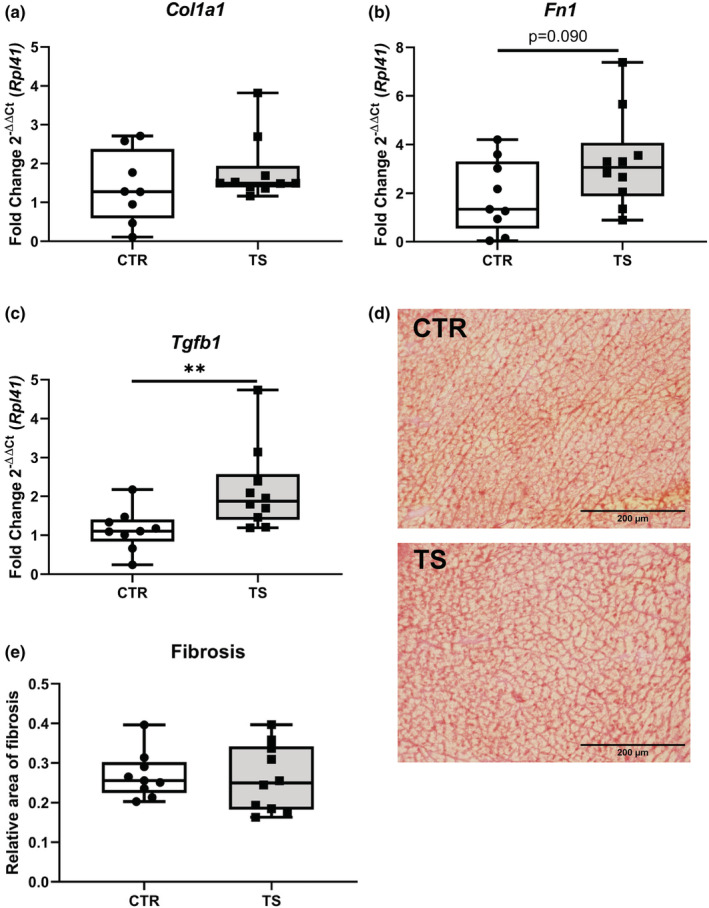
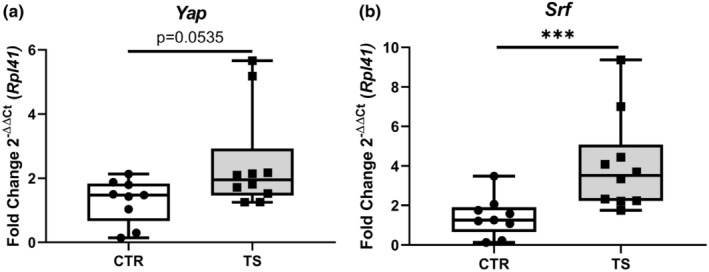
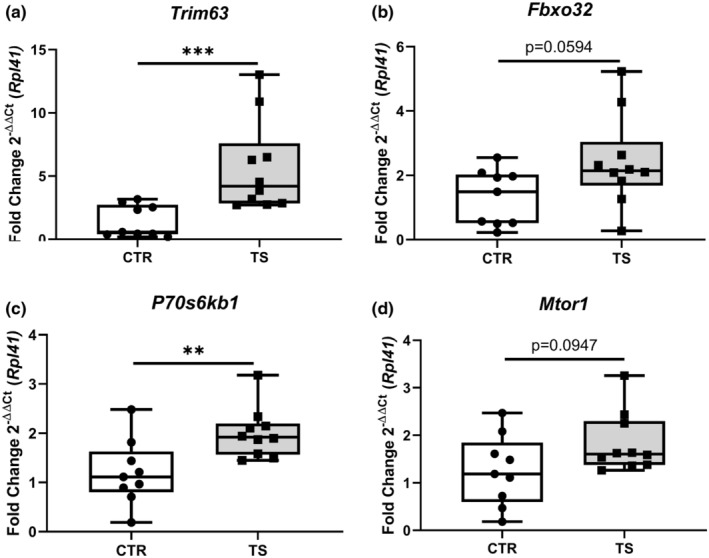
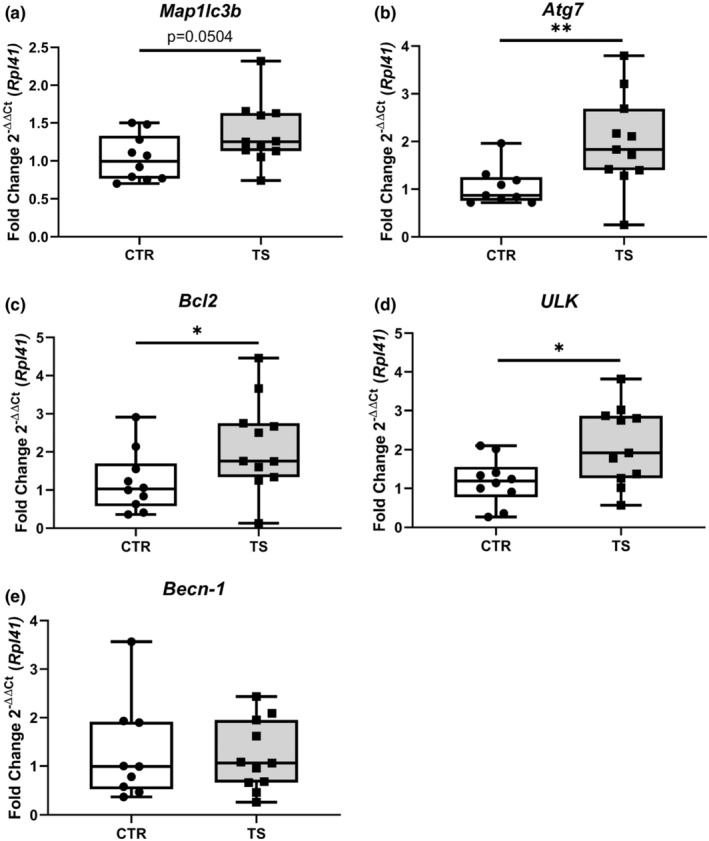
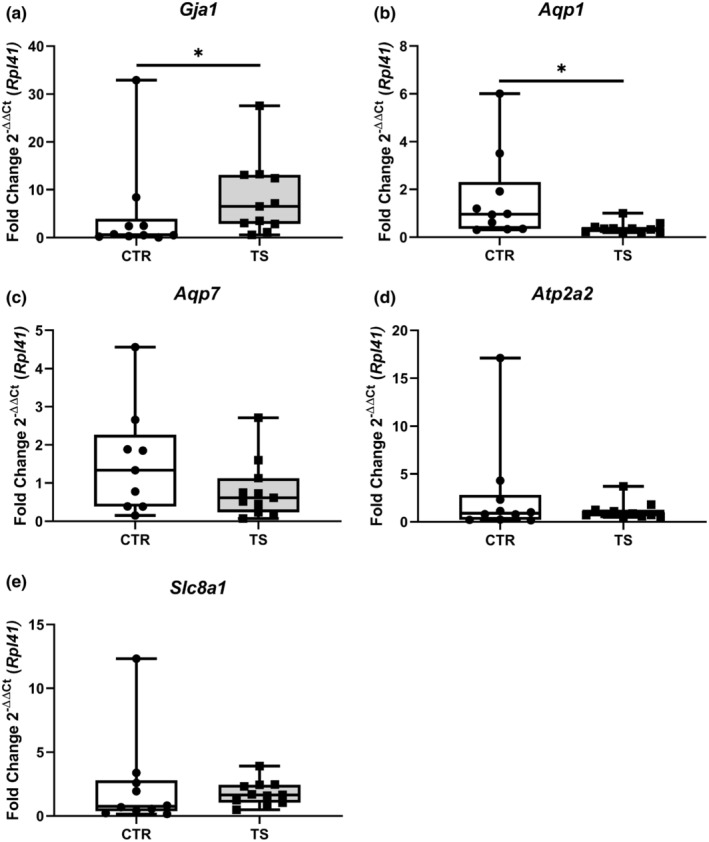
Sedentary behavior has become ingrained in our society and has been linked to cardiovascular diseases. Physical inactivity is the main characteristic of sedentary behavior. However, its impact on cardiovascular disease is not clear. Therefore, we investigated the effect of physical inactivity in an established mouse model on gene clusters associated with cardiac fibrosis, electrophysiology, cell regeneration, and tissue degradation/turnover. We investigated a sedentary group (CTR, n = 10) versus a tail suspension group (TS, n = 11) that caused hindlimb unloading and consequently physical inactivity. Through histological, protein content, and transcript analysis approaches, we found that cardiac fibrosis-related genes partly change, with significant TS-associated increases in Tgfb1, but without changes in Col1a1 and Fn1. These changes are not translated into fibrosis at tissue level. We further detected TS-mediated increases in protein degradation- (Trim63, p < 0.001; Fbxo32, p = 0.0947 as well as in biosynthesis-related [P70s6kb1, p < 0.01]). Corroborating these results, we found increased expression of autophagy markers such as Atg7 (p < 0.01) and ULK1 (p < 0.05). Two cardiomyocyte regeneration- and sarcomerogenesis-related genes, Yap (p = 0.0535) and Srf (p < 0.001), increased upon TS compared to CTR conditions. Finally, we found significant upregulation of Gja1 (p < 0.05) and a significant downregulation of Aqp1 (p < 0.05). Our data demonstrate that merely 2 weeks of reduced physical activity induce changes in genes associated with cardiac structure and electrophysiology. Hence, these data should find the basis for novel research directed to evaluate the interplay of cardiac functioning and physical inactivity.
Keywords: cardiomyocytes; heart; mouse; physical inactivity; tail suspension.
© 2023 The Authors. Physiological Reports published by Wiley Periodicals LLC on behalf of The Physiological Society and the American Physiological Society.
Conflict of interest statement
The authors declare no conflicts of interests.
Figures
Similar articles
-
Loss and recovery of myocardial mitochondria in mice under different tail suspension time: Apoptosis and mitochondrial fission, fusion and autophagy.Exp Physiol. 2023 Sep;108(9):1189-1202. doi: 10.1113/EP090518. Epub 2023 Aug 11. Exp Physiol. 2023. PMID: 37565298 Free PMC article.
-
Inhibition of autophagy recovers cardiac dysfunction and atrophy in response to tail-suspension.Life Sci. 2015 Jan 15;121:1-9. doi: 10.1016/j.lfs.2014.10.023. Epub 2014 Dec 2. Life Sci. 2015. PMID: 25476825
-
Long-term physical inactivity exacerbates hindlimb unloading-induced muscle atrophy in young rat soleus muscle.J Appl Physiol (1985). 2021 Apr 1;130(4):1214-1225. doi: 10.1152/japplphysiol.00494.2020. Epub 2021 Feb 18. J Appl Physiol (1985). 2021. PMID: 33600278
-
Nuances between sedentary behavior and physical inactivity: cardiometabolic effects and cardiovascular risk.Rev Assoc Med Bras (1992). 2021 Feb;67(2):335-343. doi: 10.1590/1806-9282.67.02.20200746. Rev Assoc Med Bras (1992). 2021. PMID: 34406261 Review.
-
Waging war on modern chronic diseases: primary prevention through exercise biology.J Appl Physiol (1985). 2000 Feb;88(2):774-87. doi: 10.1152/jappl.2000.88.2.774. J Appl Physiol (1985). 2000. PMID: 10658050 Review.
References
-
- Bernardo, B. C. , Ooi, J. Y. Y. , Weeks, K. L. , Patterson, N. L. , & McMullen, J. R. (2018). Understanding key mechanisms of exercise‐induced cardiac protection to mitigate disease: Current knowledge and emerging concepts. Physiological Reviews, 98, 419–475. 10.1152/physrev.00043.2016 - DOI - PubMed
-
- Butler, T. L. , Au, C. G. , Yang, B. , Egan, J. R. , Tan, Y. M. , Hardeman, E. C. , North, K. N. , Verkman, A. S. , & Winlaw, D. S. (2006). Cardiac aquaporin expression in humans, rats, and mice. American Journal of Physiology. Heart and Circulatory Physiology, 291, 705–713. 10.1152/ajpheart.00090.2006 - DOI - PubMed
-
- Camberos, V. , Baio, J. , Bailey, L. , Hasaniya, N. , Lopez, L. V. , & Kearns‐Jonker, M. (2019). Effects of spaceflight and simulated microgravity on YAP1 expression in cardiovascular progenitors: Implications for cell‐based repair. International Journal of Molecular Sciences, 20, 1–15. 10.3390/ijms20112742 - DOI - PMC - PubMed
Publication types
MeSH terms
LinkOut - more resources
Full Text Sources
Medical
Miscellaneous
