. 2023 Mar 6;222(3):e202204102.
doi: 10.1083/jcb.202204102. Epub 2023 Jan 25.

A nucleotide binding-independent role for γ-tubulin in microtubule capping and cell division

Affiliations

A nucleotide binding-independent role for γ-tubulin in microtubule capping and cell division

Adi Y Berman et al. J Cell Biol. .

Abstract

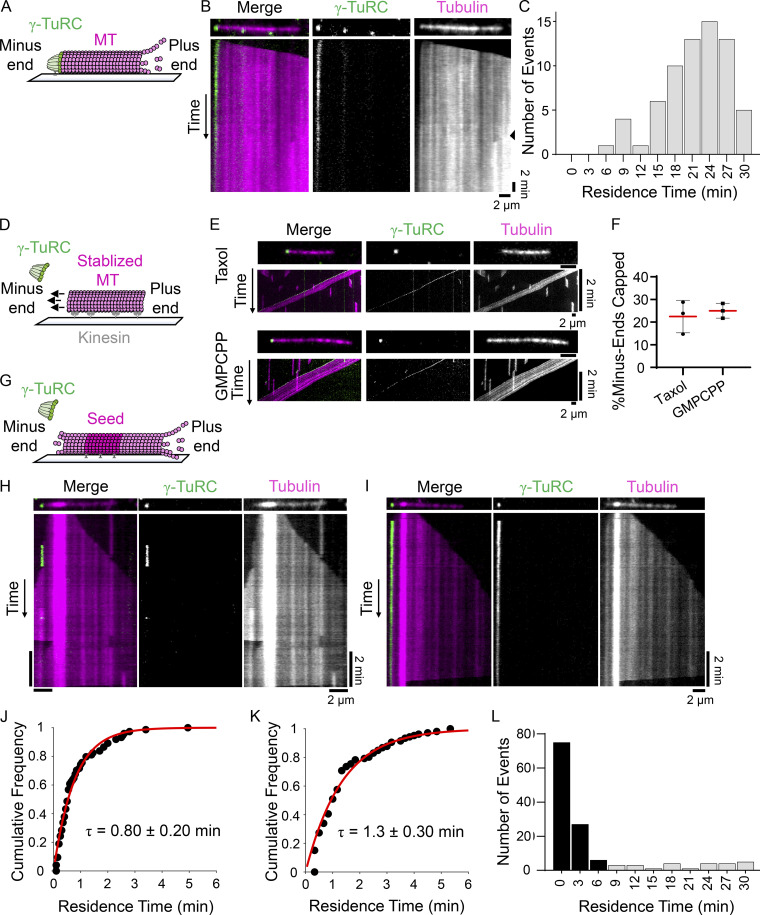
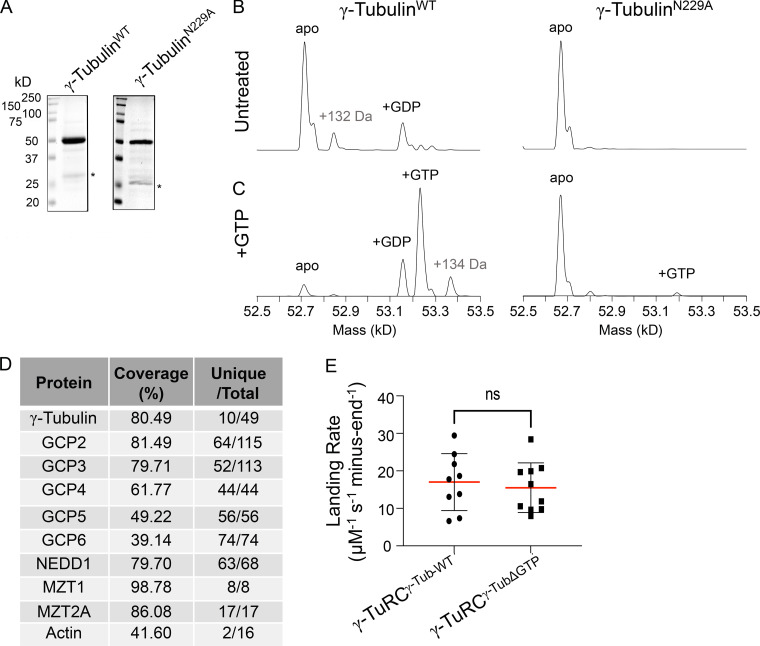
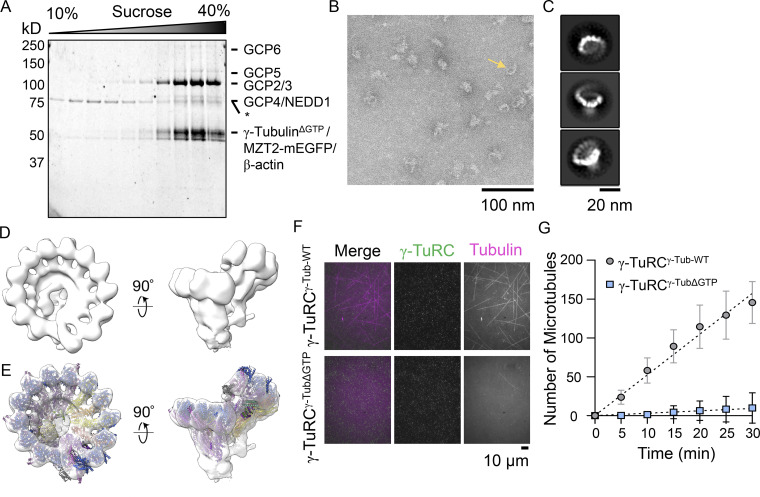
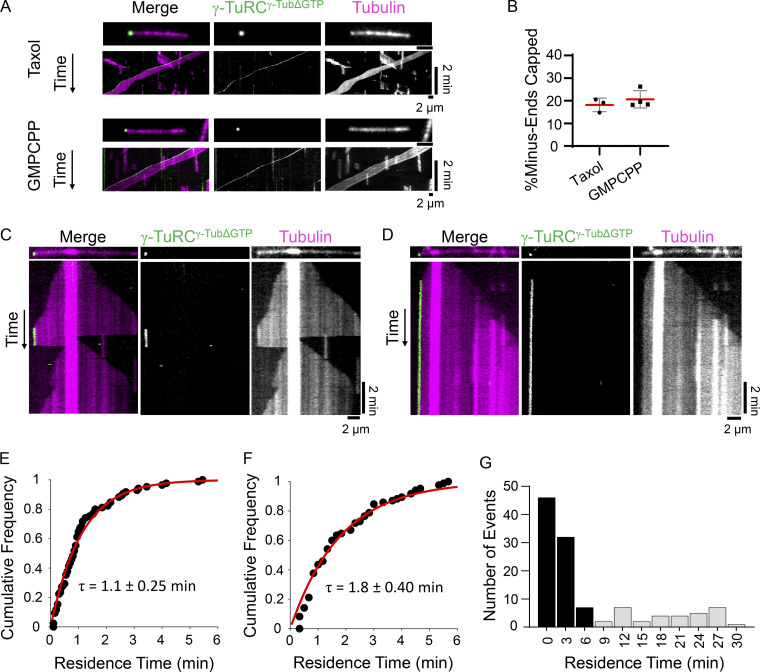
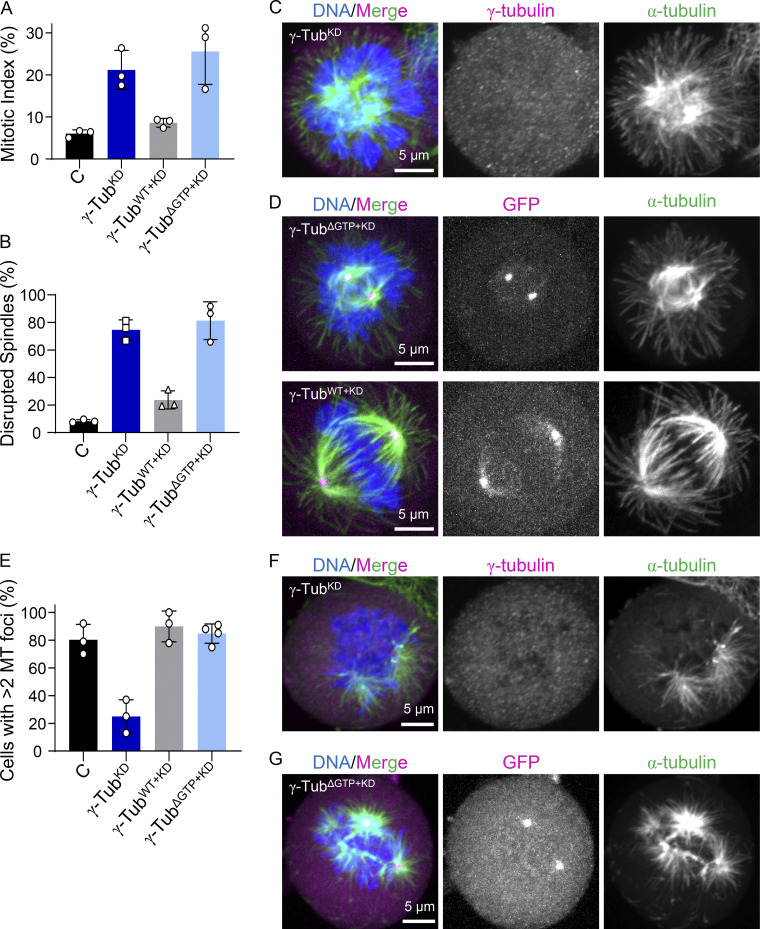
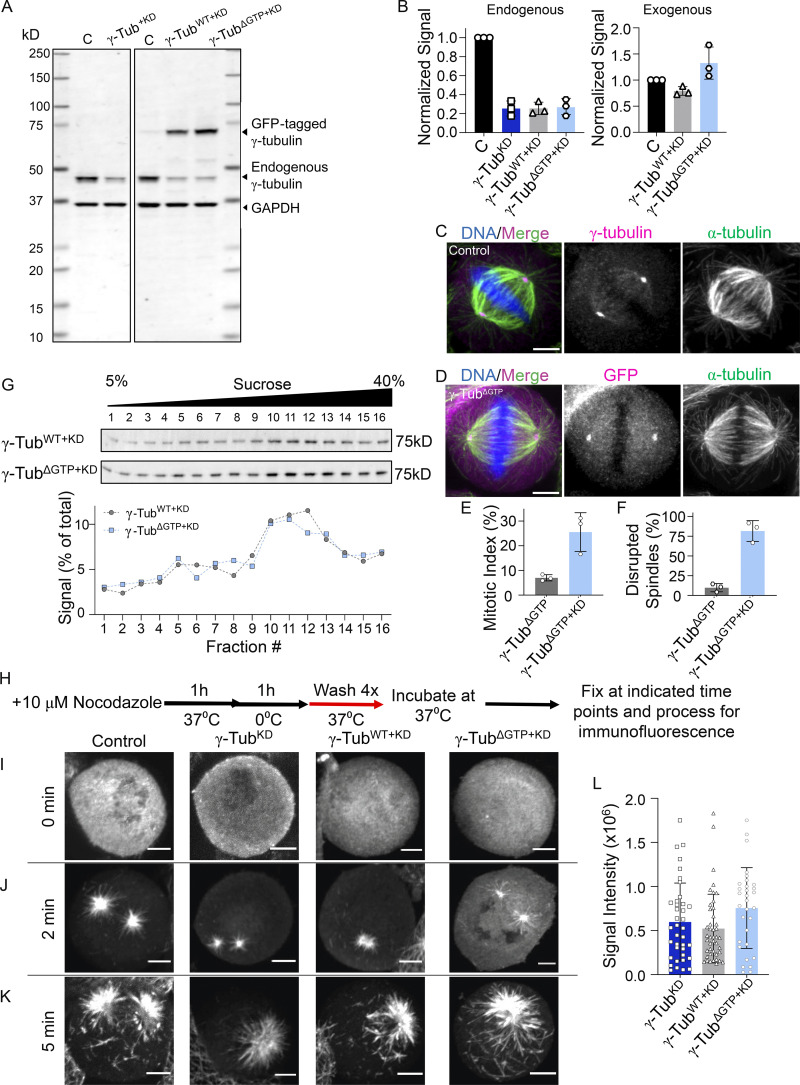
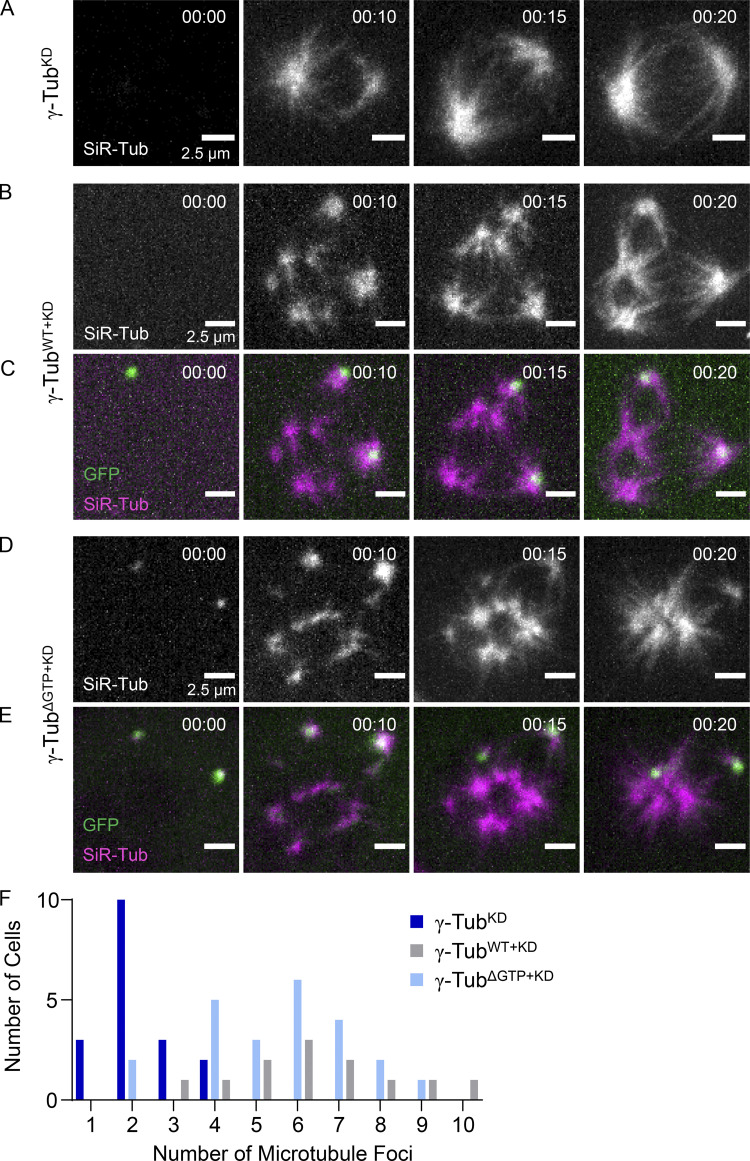
The γ-tubulin ring complex (γ-TuRC) has essential roles in centrosomal and non-centrosomal microtubule organization during vertebrate mitosis. While there have been important advances in understanding γ-TuRC-dependent microtubule nucleation, γ-TuRC capping of microtubule minus-ends remains poorly characterized. Here, we utilized biochemical reconstitutions and cellular assays to characterize the human γ-TuRC's capping activity. Single filament assays showed that the γ-TuRC remained associated with a nucleated microtubule for tens of minutes. In contrast, caps at dynamic microtubule minus-ends displayed lifetimes of ∼1 min. Reconstituted γ-TuRCs with nucleotide-binding deficient γ-tubulin (γ-tubulinΔGTP) formed ring-shaped complexes that did not nucleate microtubules but capped microtubule minus-ends with lifetimes similar to those measured for wild-type complexes. In dividing cells, microtubule regrowth assays revealed that while knockdown of γ-tubulin suppressed non-centrosomal microtubule formation, add-back of γ-tubulinΔGTP could substantially restore this process. Our results suggest that γ-TuRC capping is a nucleotide-binding-independent activity that plays a role in non-centrosomal microtubule organization during cell division.


Conflict of interest statement

Disclosures: The authors declare no competing interests exist.

Figures

Figure 1.
Figure 1.
Recombinant γ-TuRCγ-Tub-WT caps nucleated microtubules and pre-formed minus-ends. (A) Schematic of the TIRF-based assay to analyze microtubules nucleated by recombinant γ-TuRC. Surface immobilized GFP-tagged γ-TuRC (green) and polymerized tubulin (pink) are shown. (B) Image and kymograph of a microtubule nucleation event from γ-TuRCγ-Tub-WT. Two-color overlay of tubulin (magenta) and γ-TuRCγ-Tub–WT (green), and single-channel images are shown. Black triangle (right kymograph) marks signal from the appearance of another polymerizing microtubule nucleated nearby. (C) Frequency distribution of the residence times of γ-TuRCγ-Tub-WT at microtubule minus-ends after a nucleation event. Bin size = 3 min, n = 67 events, N = 3 independent experiments. (D) Schematic of the assay to analyze GFP-tagged γ-TuRC (green) capping of stabilized microtubules (pink) bound to surface-immobilized kinesin motor domains (non-fluorescent). Arrows indicate the directional movement of microtubules in the presence of MgATP (100 µM). (E) Images and kymographs of γ-TuRCγ-Tub–WT capping taxol- or GMPCPP-stabilized microtubules. Two-color overlay of tubulin (magenta) and γ-TuRCγ-Tub–WT (green), and single channel images are shown. The images and kymographs are shown at different scales. (F) Percentage of taxol- or GMPCPP-stabilized microtubule minus-ends capped by γ-TuRCγ-Tub-WT at 3 min from the start of imaging. Mean (red line) and error (SD) are shown. Taxol: n = 1,770 total microtubules from N = 3 independent experiments. GMPCPP: n = 2,326 total microtubules from N = 3 independent experiments. (G) Schematic of the assay to analyze recombinant γ-TuRC capping dynamic microtubule minus-ends. Biotinylated “bright” GMPCPP seed (magenta, 12.5% X-rhodamine-tubulin), polymerizing “dim” (pink, 2.5% X-rhodamine-tubulin) minus- and plus-end extensions, and GFP-tagged γ-TuRCs (green) are shown. (H and I) Images and kymographs of γ-TuRCγ-Tub–WT capping events on dynamic microtubules. Two-color overlay of tubulin (magenta) and γ-TuRCγ-Tub–WT (green), and single-channel images are shown. (J and K) Cumulative frequency of the residence times of γ-TuRCγ-Tub-WT capping events where association and dissociation of the cap were observed from short (10 min; J) or long (30 min; K) duration experiments, fitted to a single exponential (red line) with indicated mean residence time, τ. Error = 95% C.I. J: n = 74 events (83% of total events), N = 3 independent experiments. K: n = 107 events (80% of total events) from N = 3 independent experiments. (L) Frequency distribution of γ-TuRCγ-Tub-WT residence times from longer duration experiments (30 min). Events where γ-TuRCγ-Tub-WT dissociation from minus-ends is observed (black bars) and where γ-TuRCγ-Tub-WT remained associated with minus-ends throughout the course of imaging (gray bars) are plotted. Bin size = 3 min. n = 134 total events from N = 2 independent experiments. Scale bars: distance (horizontal) = 2 μm, time (vertical) = 2 min.
Figure S1.
Figure S1.
Native mass spectrometry analysis of γ-tubulinN229A and further analysis of γ-TuRCγ-TubΔGTP. (A) SDS-PAGE analysis (Coomasie) of recombinant, purified γ-tubulinWT (left) and γ-tubulinN229A (right) after gel filtration. Asterisk indicates a contaminant at ∼25 kD. (B and C) Native mass spectrometry analysis of γ-tubulinWT and γ-tubulinN229A before (B) and after (C) incubation with MgGTP. (D) γ-TuRC proteins identified in liquid chromatography–mass spectrometry analysis of the γ-TuRCγ-TubΔGTP complex. Coverage represents the percentage of identified protein sequences. “Unique/Total” designates the ratio of unique and total peptides identified. (E) Landing rates = number of capping events/[(µM γ-TuRC)×(experiment duration in seconds)×(number of total minus-ends)] of γ-TuRCγ-Tub-WT or γ-TuRCγ-TubΔGTP under short (10 min) duration experimental conditions. Mean (red line) and error (SD) are shown. γ-TuRCγ-Tub-WT, n = 9 replicates, γ-TuRCγ-TubΔGTP, n = 10 replicates, from N = 3 independent experiments. ns = not significant, unpaired two-sided Student’s t test, P = 0.65. Source data are available for this figure: SourceData FS1.
Figure 2.
Figure 2.
Recombinant γ-TuRCγ-TubΔGTP assembles into a 14-spoke assembly and cannot nucleate microtubules. (A) SDS-PAGE analysis (Coomasie) of γ-TuRCγ-TubΔGTP after sucrose gradient centrifugation and fractionation. The percentage (W/V) of sucrose is indicated at the top. Asterisk (*) indicates a 70-kD contaminant with a sedimentation peak at a lower sucrose percentage than the γ-TuRCγ-TubΔGTP components. (B) Transmission EM micrograph of negatively stained γ-TuRCγ-TubΔGTP. Scale bar = 100 nm. (C) 2D averages showing three orientations of γ-TuRCγ-TubΔGTP particles. Scale bar = 20 nm. (D) Two views of a 3D reconstruction of γ-TuRCγ-TubΔGTP. (E) Rigid body fit of the native human γ-TuRC model in the γ-TuRCγ-TubΔGTP density map (Protein Data Bank accession nos. 6V6S, 6X0U, and 6X0V). (F) Images of nucleation assays in the presence of γ-TuRCγ-Tub-WT (top) or γ-TuRCγ-TubΔGTP (bottom). Two-color overlay of tubulin (magenta) and γ-TuRCγ-TubΔGTP (green), and single-channel images are shown. Scale bar = 10 μm. (G) Quantification of the number of microtubules at the indicated time points per field of view for γ-TuRCγ-Tub-WT or γ-TuRCγ-TubΔGTP microtubule nucleation assays. Mean (symbols) and error (SD) are shown. Data were fitted using linear regression (dashed lines). n = 4 total replicates from N = 2 independent experiments. Source data are available for this figure: SourceData F2.
Figure 3.
Figure 3.
Recombinant γ-TuRCγ-TubΔGTP caps dynamic and stable microtubule minus-ends. (A) Images and kymographs of γ-TuRCγ-TubΔGTP capping taxol- or GMPCPP- stabilized microtubules bound to surface-immobilized kinesin motor domains. Two-color overlay of tubulin (magenta) and γ-TuRCγ-Tub–WT (green), and single-channel images are shown. The images and kymographs are shown at different scales. (B) Quantification of the percentage of taxol- or GMPCPP-stabilized microtubule minus-ends capped by γ-TuRCγ-TubΔGTP at 3 min from the start of imaging. Mean (red line) and error (SD) are shown. Taxol: n = 1,503 total microtubules from N = 3 independent experiments. GMPCPP: n = 1,634 total microtubules from N = 4 independent experiments. (C and D) Images and kymographs of γ-TuRCγ-TubΔGTP capping events on dynamic microtubules. Two-color overlay of tubulin (magenta) and γ-TuRCγ-TubΔGTP (green), and single-channel images are shown. (E and F) Cumulative frequency of the residence times of γ-TuRCγ-TubΔGTP capping events where association and dissociation of the cap were observed under short (10 min; E) or long (30 min; F) duration experiments fitted to a single exponential (red line) with indicated mean residence time, τ. Error = 95% C.I. 10 min: n = 85 total events (81% of total) from N = 3 independent experiments. 30 min: n = 85 events (77% of total) from N = 2 independent experiments. (G) Frequency distribution of γ-TuRCγ-Tub-WT residence times from longer duration experiments (30 min). Events where γ-TuRCγ-TubΔGTP dissociation is observed (black bars) and where γ-TuRCγ-TubΔGTP's minus-end association persisted (gray bars) are plotted. Bin size = 3 min. n = 111 total events from N = 2 independent experiments. Scale bars: distance (horizontal) = 2 µm, time (vertical) = 2 min.
Figure 4.
Figure 4.
γ-tubulinΔGTP+KD cells form disrupted spindles but display non-centrosomal microtubule formation. (A) Analysis of the mean mitotic index. n = >2,000 cells per condition from N = 3 independent experiments. (B) The mean percentage of mitotic cells that displayed disrupted spindles. n = >200 cells per condition from N = 3 independent experiments. (C and D) Images of fixed mitotic γ-tubulinKD, γ-tubulinΔGTP+KD, and γ-tubulinWT+KD cells. Single-channel images (maximum-intensity projections) and overlays show γ-tubulin (immunofluorescence; C) or GFP (fluorescent signal; D; magenta), α-tubulin (green), and DNA (blue). (E) Quantification of the mean percentage of mitotic cells that display >2 microtubule foci at 5 min after nocodazole washout. n = >45 cells per condition from N ≥ 3 independent experiments. (F and G) Images of fixed mitotic γ-tubulinKD and γ-tubulinΔGTP+KD cells 5 min after nocodazole washout. Single-channel images (maximum-intensity projections) and overlays show γ-tubulin (immunofluorescence; C) or GFP (fluorescent signal; D; magenta), α-tubulin (green), and DNA (blue). Scale bars = 5 µm. Error bars = standard deviation (A, B, and E).
Figure S2.
Figure S2.
Characterization of γ-tubulin cell lines and microtubule regrowth assay in fixed cells. (A) Western blot analysis of cell lysates. Uncropped blots are shown. Bands corresponding to the expected molecular weights of GFP-tagged γ-tubulin, endogenous γ-tubulin, and GAPDH are indicated, along with the corresponding molecular weight standard. (B) Quantification of endogenously and exogenously expressed γ-tubulin levels in these cell lines determined by Western blotting, relative to loading control (GAPDH). The signal relative to the control is plotted. Mean and error (SD) are shown. N = 3 independent experiments. (C and D) Images of fixed, untransfected control (C) and γ-tubulinΔGTP (D) cells. Single-channel images (maximum-intensity projections) and overlays show (C) γ-tubulin (immunofluorescence, magenta) or (D) GFP (fluorescent signal; magenta), α-tubulin (green), and DNA (blue). (E) Quantification of the mean mitotic index in γ-tubulinΔGTP and γ-tubulinΔGTP+KD cells (values from Fig. 3 A are shown for comparison). n = >2,000 cells counted per condition from N = 3 independent experiments. (F) Mean percentage of mitotic cells that display disrupted spindles in γ-tubulinΔGTP and γ-tubulinΔGTP+KD cells (values from Fig. 3 B are shown for comparison). n = >200 cells counted per condition from N = 3 independent experiments. (G) Analysis of whole-cell lysates from γ-tubulinWT+KD and γ-tubulinΔGTP+KD cell lines using sucrose gradient centrifugation. Western blot of γ-tubulin (top) and quantification of the percentage of γ-tubulin antibody signal within each sucrose gradient fraction (bottom) are shown. (H) Schematic of fixed cell microtubule regrowth assay. Cells were fixed at the indicated time points and processed for immunofluorescence. (I–K) Images of fixed mitotic cells at 0 (I), 2 (J), and 5 (K) min after nocodazole washout. Single-channel images (maximum-intensity projections) of α-tubulin are shown. (L) Quantification of the mean microtubules fluorescent signal at 2 min after nocodazole washout in the indicated cell lines. n = >30 cells per condition from N = 3 independent experiments. Scale bars = 5 µm. Error bars = SD (B, E, F, L). Source data are available for this figure: SourceData FS2.
Figure S3.
Figure S3.
Analysis of live cell microtubule regrowth assays. (A) Schematic of the live cell microtubule regrowth assay. (B) Examples demonstrating the workflow for counting the number of microtubule foci. (1) The raw images were compiled as maximum intensity projections. (2) A signal intensity threshold of >90% was applied. (3) The image was binarized. (4) The signal was segmented using the Watershed plugin in FIJI. (5) Any particles greater than 1 µm2 were counted using the Analyze Particles tool in FIJI. Example 1 illustrates this workflow in a γ-tubulinKD cell. Examples 2 and 3 illustrate this workflow in γ-tubulinWT+KD and γ-tubulinΔGTP+KD cells where the foci were either small and dispersed (Example 2), or large and clustered together (Example 3). Scale bar = 2.5 µm.
Figure 5.
Figure 5.
Microtubule foci formation and coalescence in live γ-tubulinΔGTP+KD cells. (A–E) Live imaging of microtubule regrowth assay by spinning disc confocal microscopy in γ-tubulinKD (A; no GFP signal), γ-tubulinWT+KD (B and C), and γ-tubulinΔGTP+KD (D and E) cells. Maximum-intensity projections at individual time points are shown. Timestamps = hh:mm. Single-channel images (A, B, D) show SiR–tubulin-labeled microtubules. Overlays (C and E) show GFP-tagged γ-tubulin (green) and SiR–Tubulin-labeled microtubules (magenta). Scale bar = 2.5 µm. (F) Quantification of the number of microtubule foci in γ-tubulinKD (dark blue bars, n = 18 total cells from N = 2 independent experiments), γ-tubulinWT+KD (gray bars, n = 13 total cells from N = 3 independent experiments), and γ-tubulinΔGTP+KD (light blue bars, n = 23 total cells from N = 3 independent experiments) cells.

Similar articles

Cited by

References

    1. Akhmanova, A., and Kapitein L.. 2022. Mechanisms of microtubule organization in differentiated animal cells. Nature Reviews Molecular Cell Biology. 23:541–558. 10.1038/s41580-022-00473-y - DOI - PubMed
    1. Aldaz, H., Rice L.M., Stearns T., and Agard D.A.. 2005. Insights into microtubule nucleation from the crystal structure of human γ-tubulin. Nature. 435:523–527. 10.1038/nature03586 - DOI - PubMed
    1. Baumgart, J., Kraus M., Ziehm M., Kirchner M., Schafstedde M., Kelm M., Niquet S., Stephen N.M., Baczko I., Knosalla C., et al. . 2019. Soluble tubulin is significantly enriched at mitotic centrosomes. J Cell Biol. 218:3977–3985. 10.1083/jcb.201902069 - DOI - PMC - PubMed
    1. Brilot, A.F., Lyon A.S., Zelter A., Viswanath S., Maxwell A., MacCoss M.J., Muller E.G., Sali A., Davis T.N., and Agard D.A.. 2021. CM1-driven assembly and activation of yeast γ-tubulin small complex underlies microtubule nucleation. Elife. 10:e65168. 10.7554/eLife.65168 - DOI - PMC - PubMed
    1. Chen, Y., Deffenbaugh N.C., Anderson C.T., and Hancock W.O.. 2014. Molecular counting by photobleaching in protein complexes with many subunits: Best practices and application to the cellulose synthesis complex. Mol. Biol. Cell. 25:3630–3642. 10.1091/mbc.e14-06-1146 - DOI - PMC - PubMed

Publication types