

Genome concentration, characterization, and integrity analysis of recombinant adeno-associated viral vectors using droplet digital PCR
- PMID: 36696399
- PMCID: PMC9876284
- DOI: 10.1371/journal.pone.0280242
Genome concentration, characterization, and integrity analysis of recombinant adeno-associated viral vectors using droplet digital PCR
Abstract
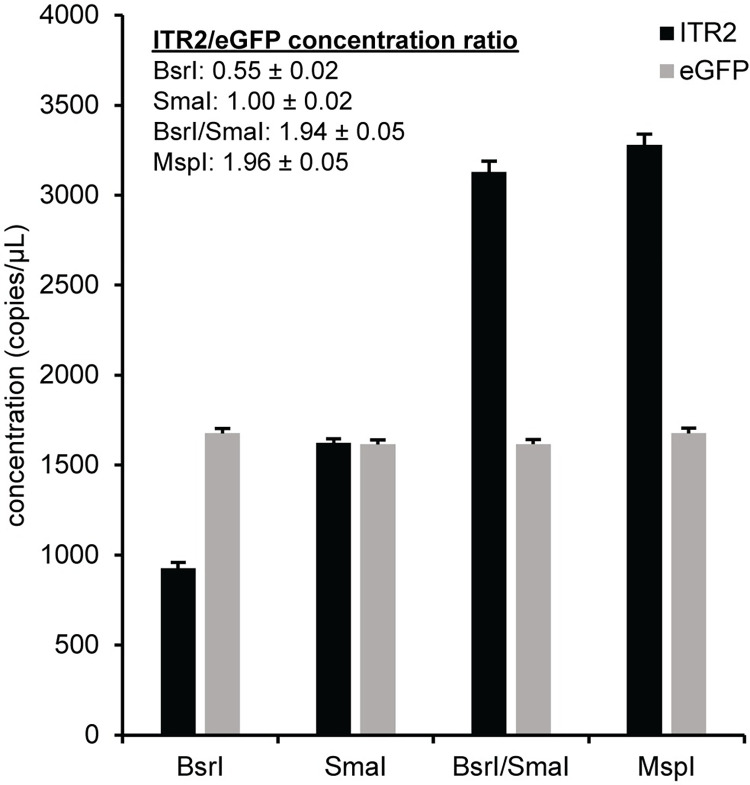
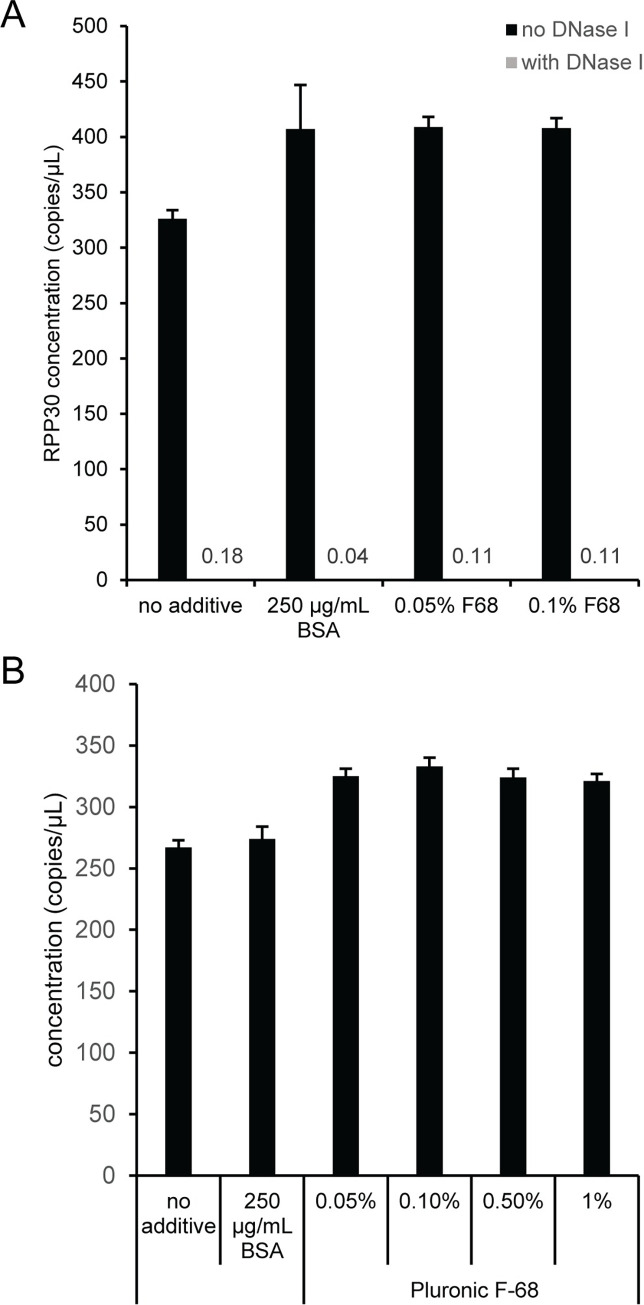
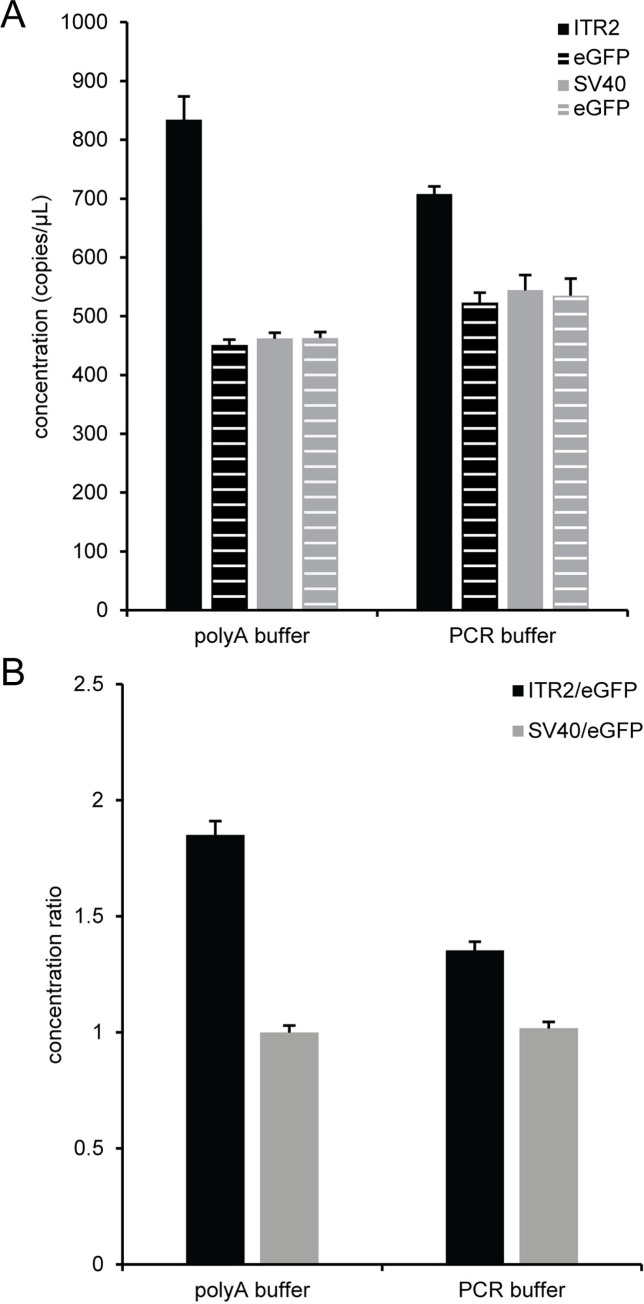
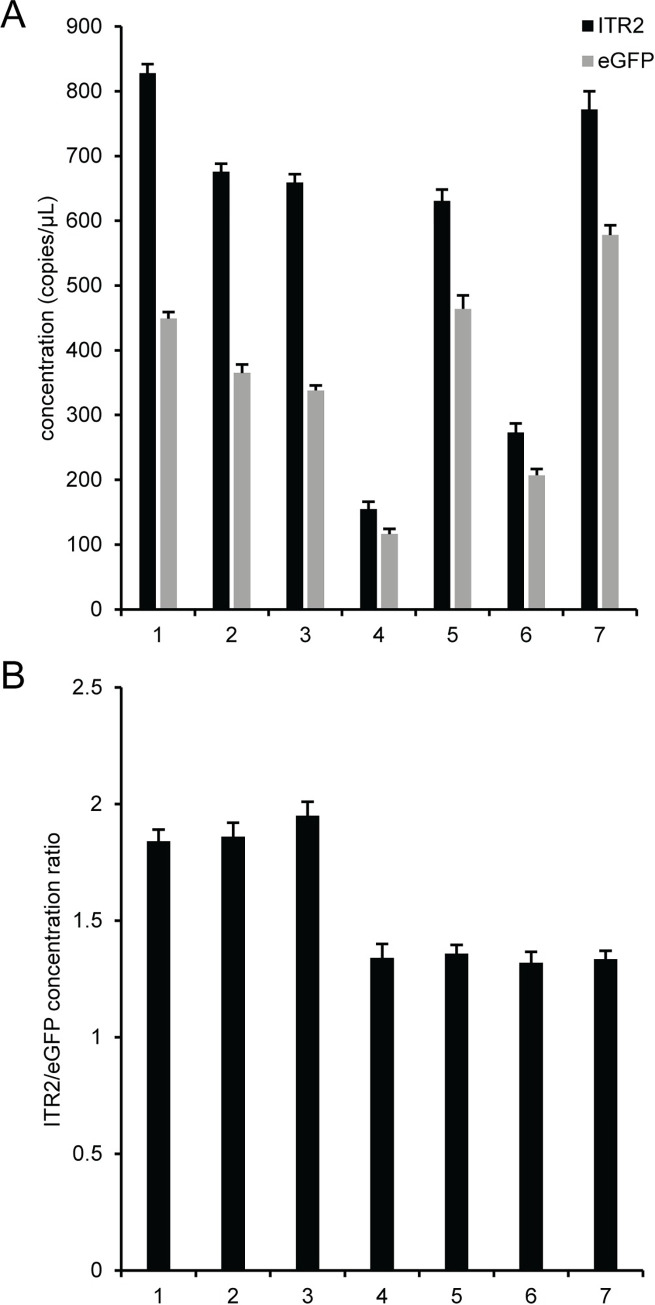
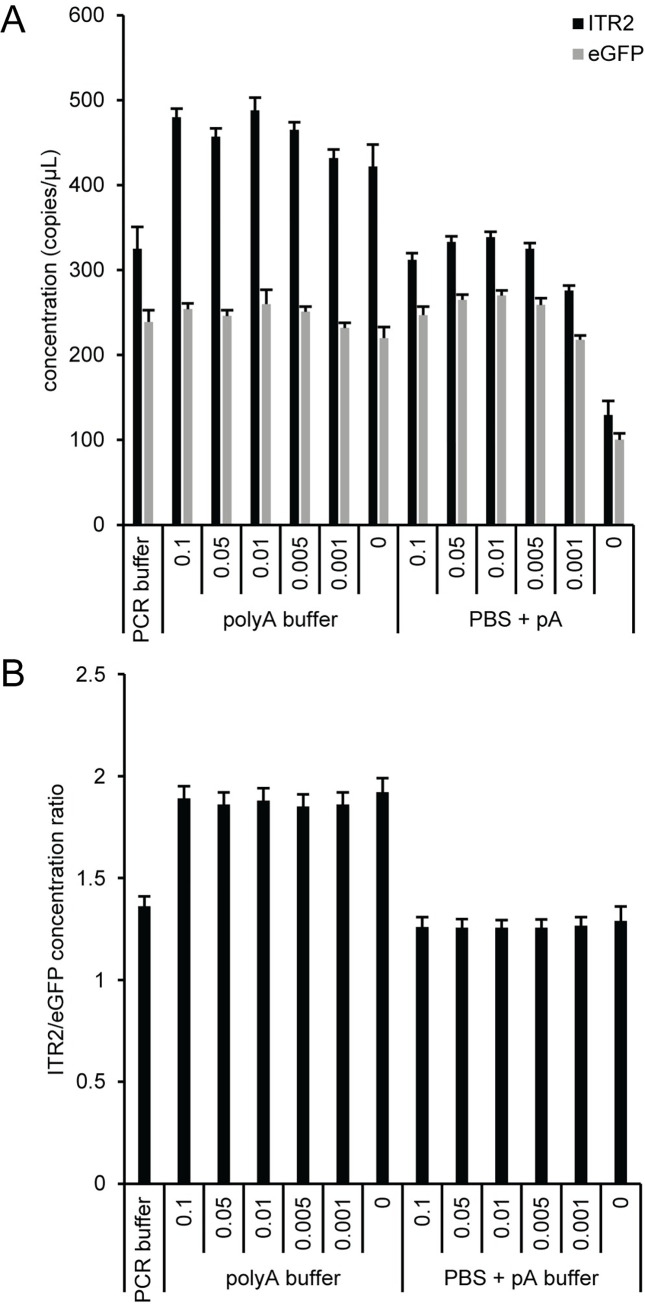
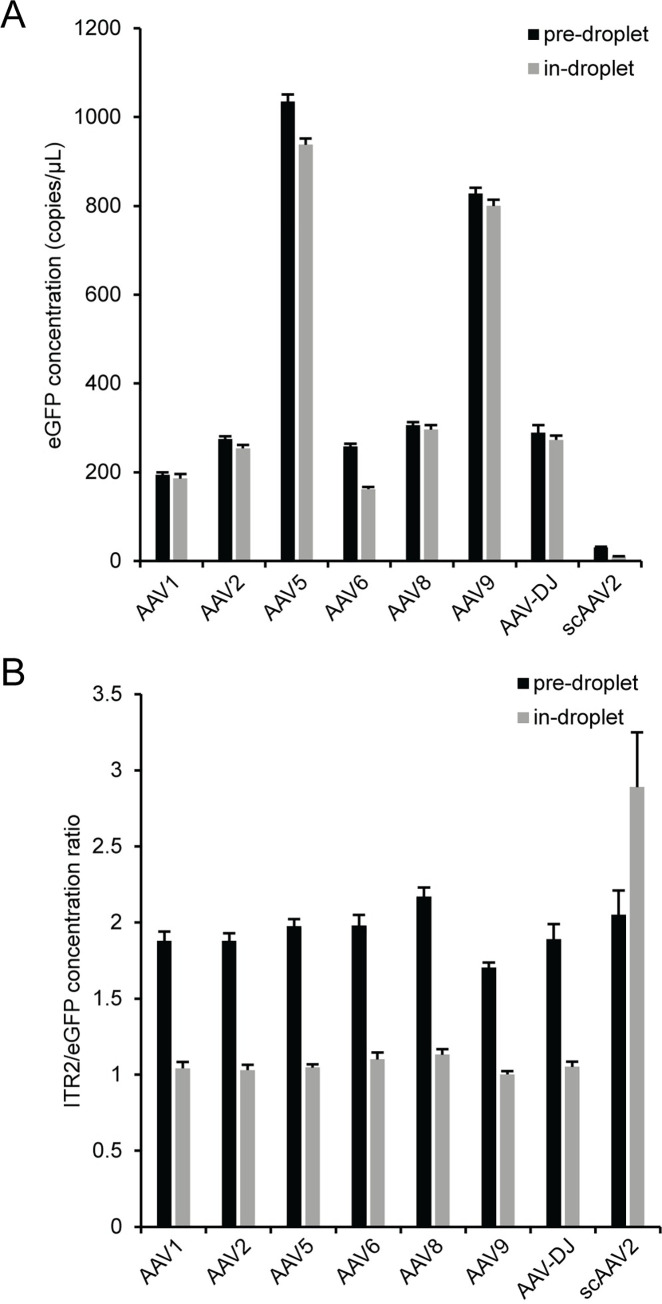
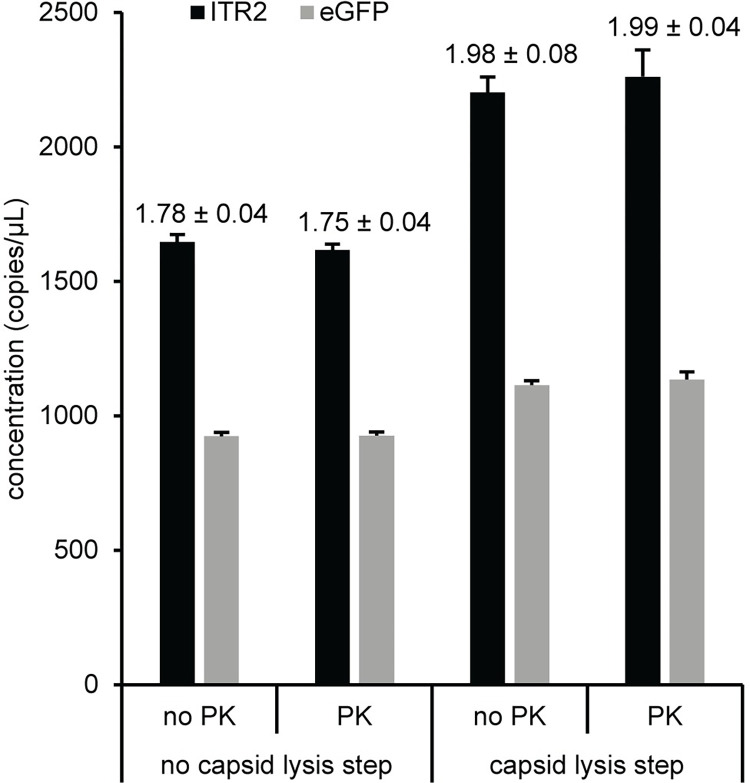
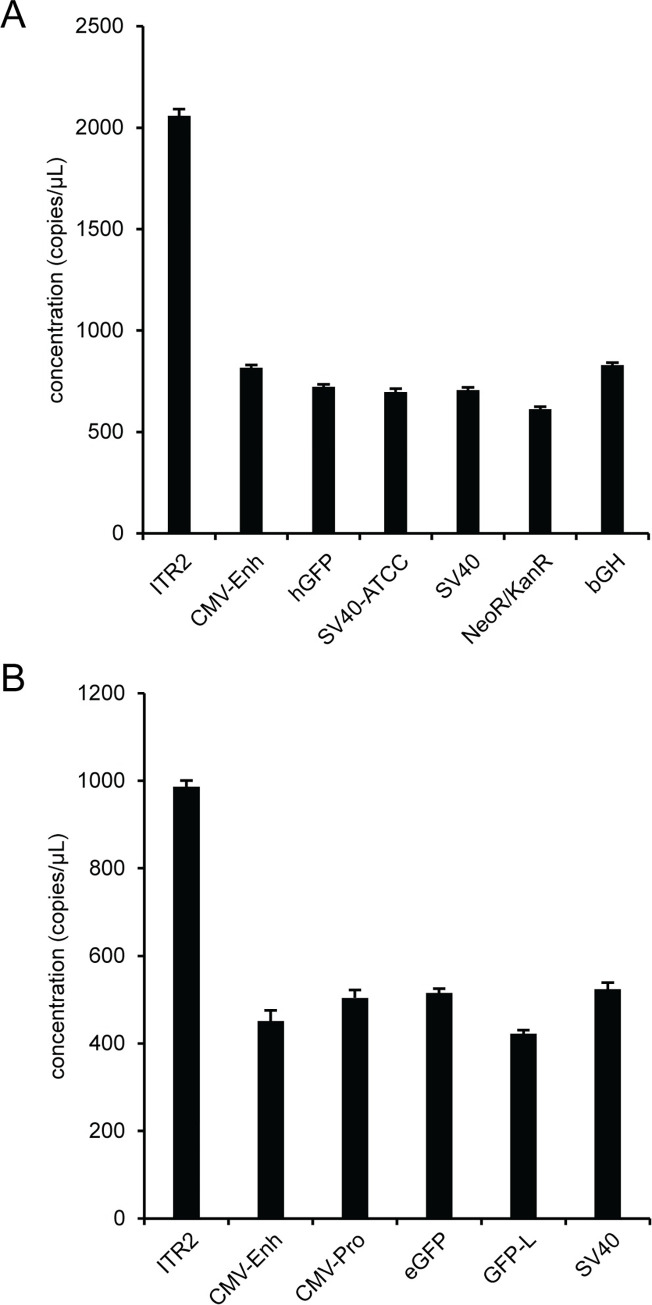
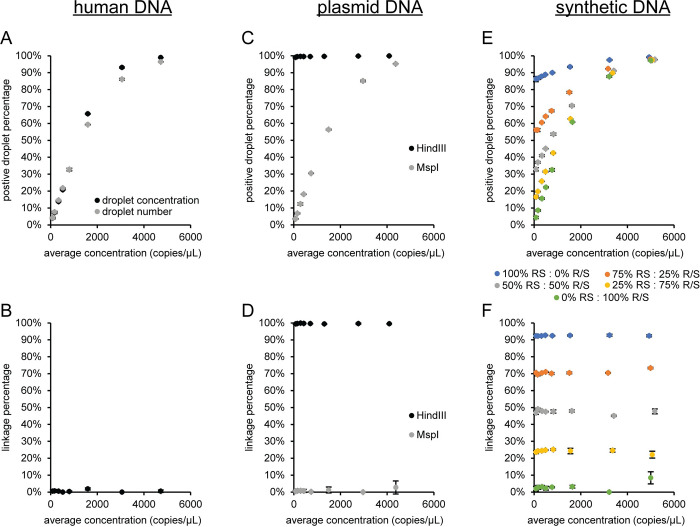
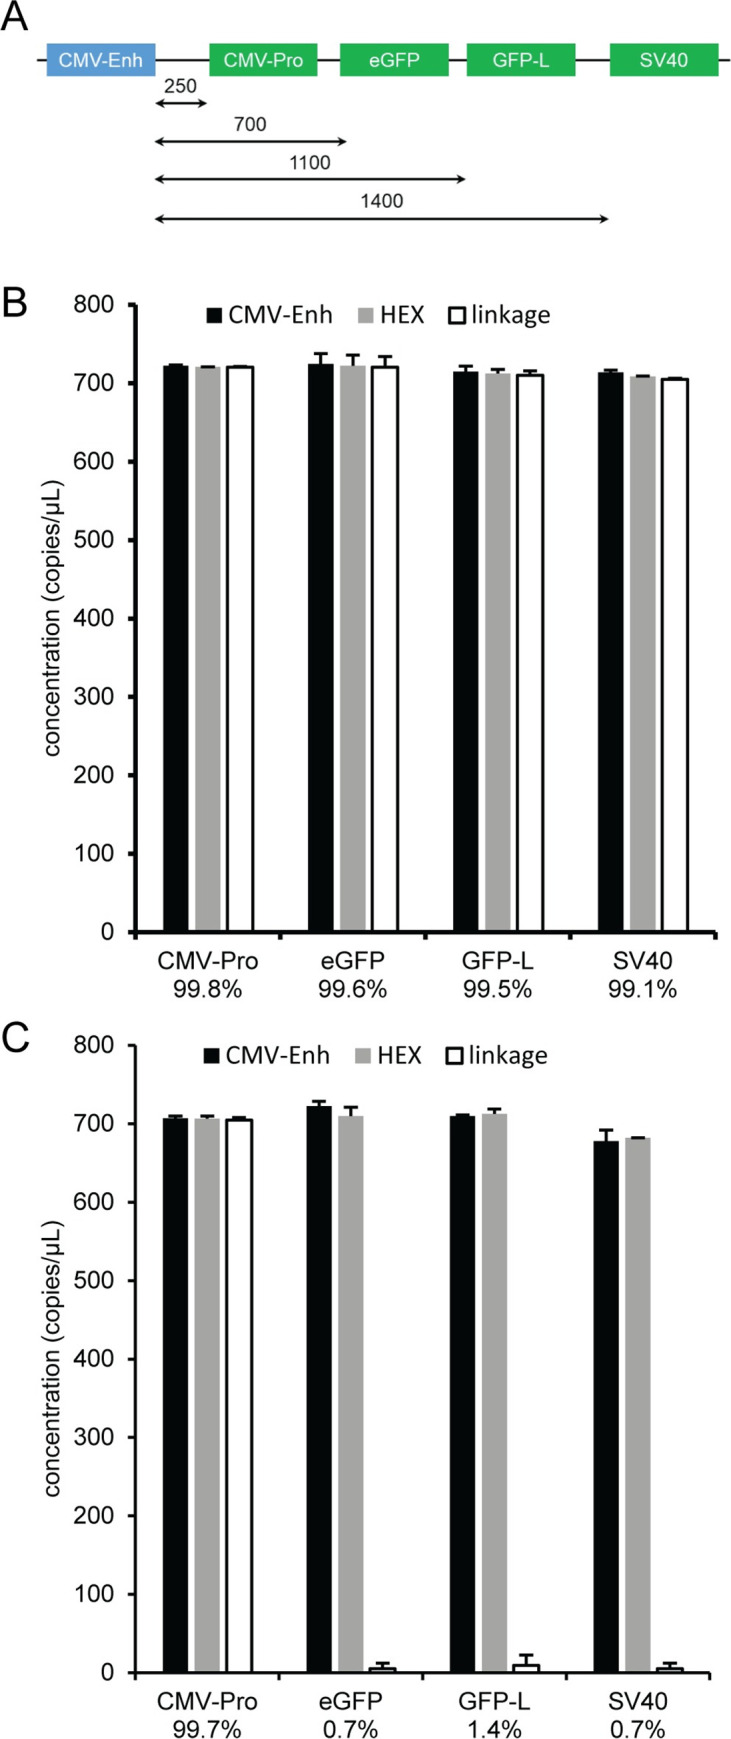
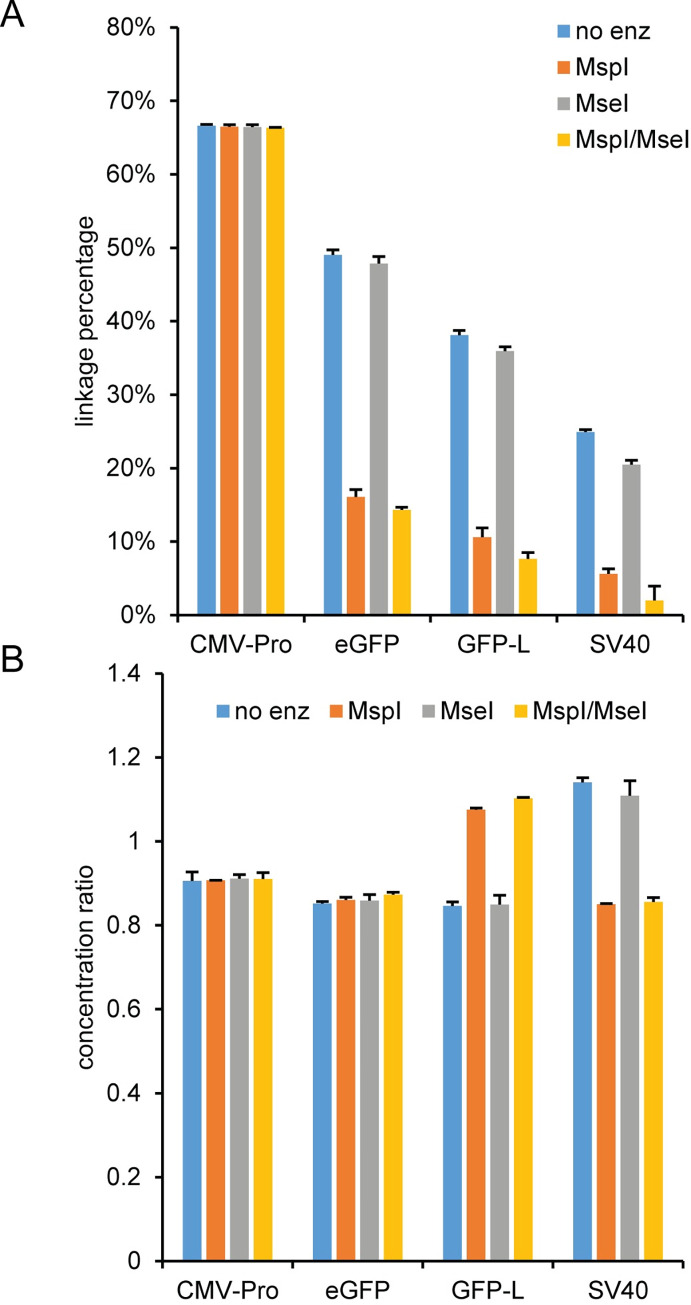
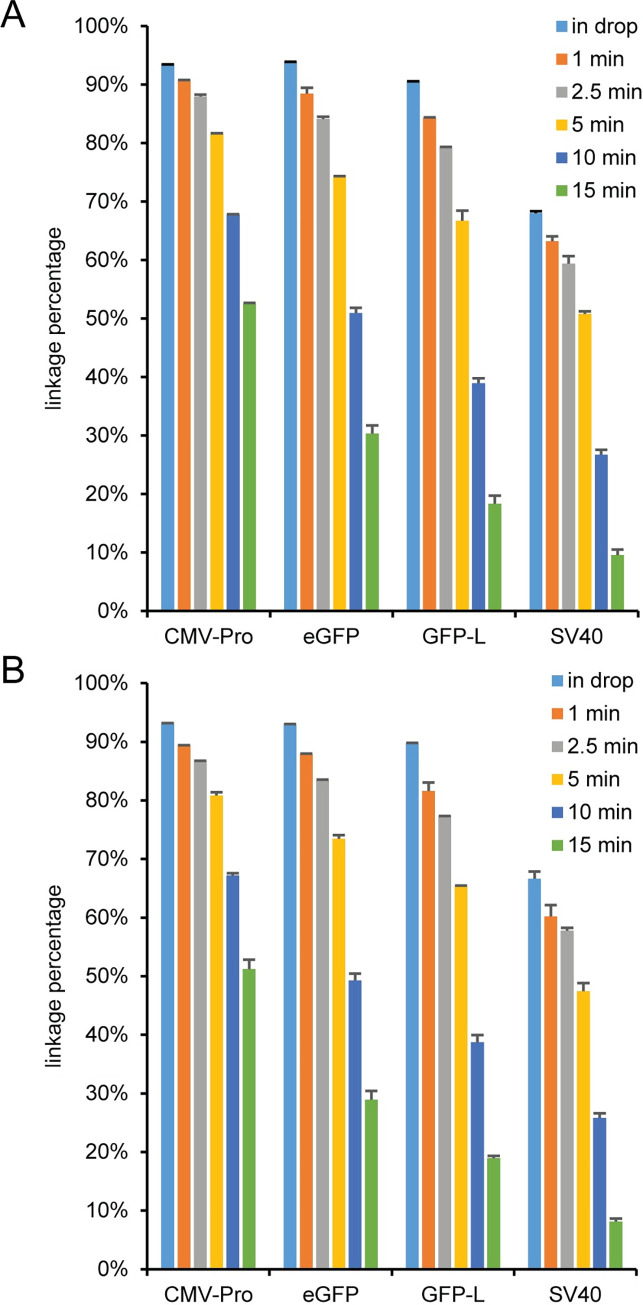
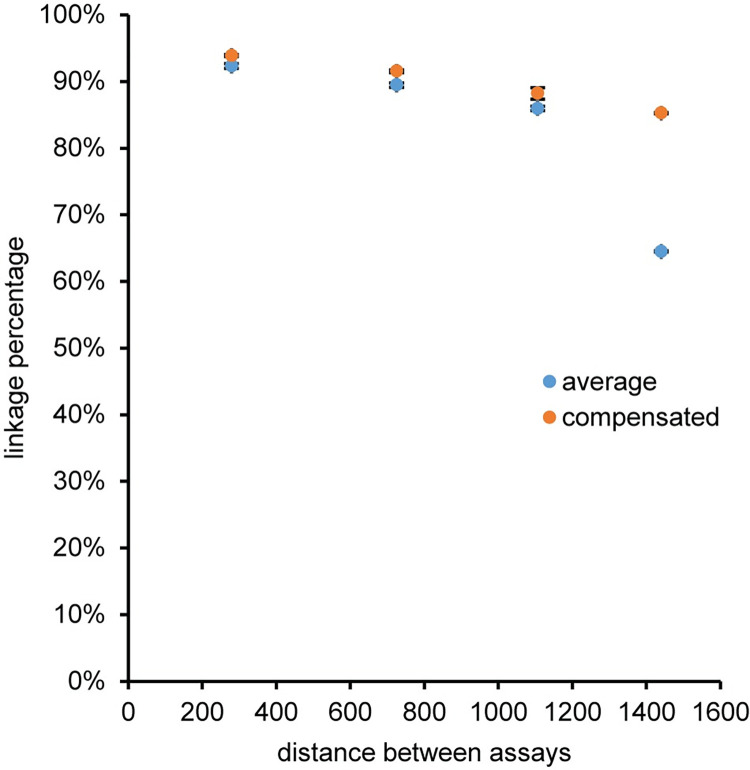
Precise, reproducible characterization of AAV is critical for comparing preclinical results between laboratories and determining a safe and effective clinical dose for gene therapy applications. In this study, we systematically evaluated numerous parameters to produce a simple and robust ddPCR protocol for AAV characterization. The protocol uses a low ionic strength buffer containing Pluronic-F68 and polyadenylic acid to dilute the AAV into the ddPCR concentration range and a 10-minute thermal capsid lysis prior to assembling ddPCR reactions containing MspI. A critical finding is that the buffer composition affected the ITR concentration of AAV but not the ITR concentration of a double stranded plasmid, which has implications when using a theoretical, stoichiometric conversion factor to obtain the titer based on the ITR concentration. Using this protocol, a more comprehensive analysis of an AAV vector formulation was demonstrated with multiple ddPCR assays distributed throughout the AAV vector genome. These assays amplify the ITR, regulatory elements, and eGFP transgene to provide a more confident estimate of the vector genome concentration and a high-resolution characterization of the vector genome identity. Additionally, we compared two methods of genome integrity analysis for three control sample types at eight different concentrations for each sample. The genome integrity was independent of sample concentration and the expected values were obtained when integrity was determined based on the excess number of positive droplets relative to the number of double positive droplets expected by chance co-encapsulation of two DNA targets. The genome integrity was highly variable and produced unexpected values when the double positive droplet percentage was used to calculate the genome integrity. A protocol using a one-minute thermal capsid lysis prior to assembling ddPCR reactions lacking a restriction enzyme used the non-ITR assays in a duplex ddPCR milepost experiment to determine the genome integrity using linkage analysis.
Copyright: © 2023 Prantner, Maar. This is an open access article distributed under the terms of the Creative Commons Attribution License, which permits unrestricted use, distribution, and reproduction in any medium, provided the original author and source are credited.
Conflict of interest statement
I have read the journal’s policy and the authors of this manuscript have the following competing interests: Both authors are employees of Bio-Rad Laboratories. This does not alter our adherence to PLOS ONE policies on sharing data and materials.
Figures
Similar articles
-
Three-dimensional linkage analysis with digital PCR for genome integrity and identity of recombinant adeno-associated virus.Sci Rep. 2025 Jan 16;15(1):2154. doi: 10.1038/s41598-024-77378-7. Sci Rep. 2025. PMID: 39820513 Free PMC article.
-
Absolute determination of single-stranded and self-complementary adeno-associated viral vector genome titers by droplet digital PCR.Hum Gene Ther Methods. 2014 Apr;25(2):115-25. doi: 10.1089/hgtb.2013.131. Epub 2014 Feb 14. Hum Gene Ther Methods. 2014. PMID: 24328707 Free PMC article.
-
Quantitative and Digital Droplet-Based AAV Genome Titration.Methods Mol Biol. 2019;1950:51-83. doi: 10.1007/978-1-4939-9139-6_4. Methods Mol Biol. 2019. PMID: 30783968 Free PMC article.
-
Expressing Transgenes That Exceed the Packaging Capacity of Adeno-Associated Virus Capsids.Hum Gene Ther Methods. 2016 Feb;27(1):1-12. doi: 10.1089/hgtb.2015.140. Hum Gene Ther Methods. 2016. PMID: 26757051 Free PMC article. Review.
-
Recent Advances in the Analysis Full/Empty Capsid Ratio and Genome Integrity of Adeno-associated Virus (AAV) Gene Delivery Vectors.Curr Mol Med. 2020;20(10):806-813. doi: 10.2174/1566524020999200730181042. Curr Mol Med. 2020. PMID: 32748744 Review.
Cited by
-
Residual DNA impurities in AAV vectors-nature and transcription.Mol Ther Methods Clin Dev. 2025 Jun 4;33(3):101503. doi: 10.1016/j.omtm.2025.101503. eCollection 2025 Sep 11. Mol Ther Methods Clin Dev. 2025. PMID: 40599703 Free PMC article.
-
Recombinant Virus Quantification Using Single-Cell Droplet Digital PCR: A Method for Infectious Titer Quantification.Viruses. 2023 Apr 26;15(5):1060. doi: 10.3390/v15051060. Viruses. 2023. PMID: 37243145 Free PMC article.
-
Assessment of Key Factors Impacting Variability in AAV Vector Genome Titration by Digital PCR.Int J Mol Sci. 2024 May 9;25(10):5149. doi: 10.3390/ijms25105149. Int J Mol Sci. 2024. PMID: 38791184 Free PMC article.
-
Therapeutic Application and Structural Features of Adeno-Associated Virus Vector.Curr Issues Mol Biol. 2024 Aug 2;46(8):8464-8498. doi: 10.3390/cimb46080499. Curr Issues Mol Biol. 2024. PMID: 39194716 Free PMC article. Review.
-
An improved high-resolution method for quantitative separation of empty and filled AAV8 capsids by strong anion exchange HPLC.Front Bioeng Biotechnol. 2024 Oct 1;12:1436857. doi: 10.3389/fbioe.2024.1436857. eCollection 2024. Front Bioeng Biotechnol. 2024. PMID: 39411057 Free PMC article.
References
-
- Lock M, Alvira MR, Chen SJ, Wilson JM. Absolute determination of single-stranded and self-complementary adeno-associated viral vector genome titers by droplet digital PCR. Hum Gene Ther Methods. 2014;25(2):115–25. Epub 2013/12/18. doi: 10.1089/hgtb.2013.131 ; PubMed Central PMCID: PMC3991984. - DOI - PMC - PubMed
MeSH terms
LinkOut - more resources
Full Text Sources
Other Literature Sources
