. 2023 Jan 25;19(1):e1010610.
doi: 10.1371/journal.pgen.1010610. eCollection 2023 Jan.

Mitochondrial remodelling is essential for female germ cell differentiation and survival

Affiliations

Mitochondrial remodelling is essential for female germ cell differentiation and survival

Vernon Leander Monteiro et al. PLoS Genet. .

Abstract

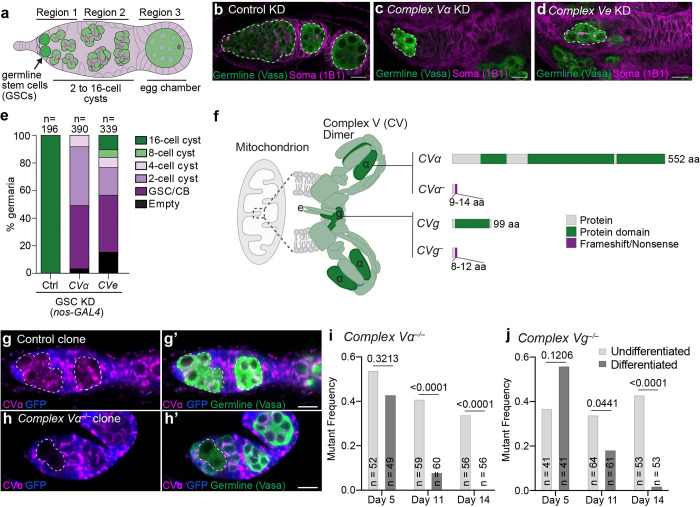
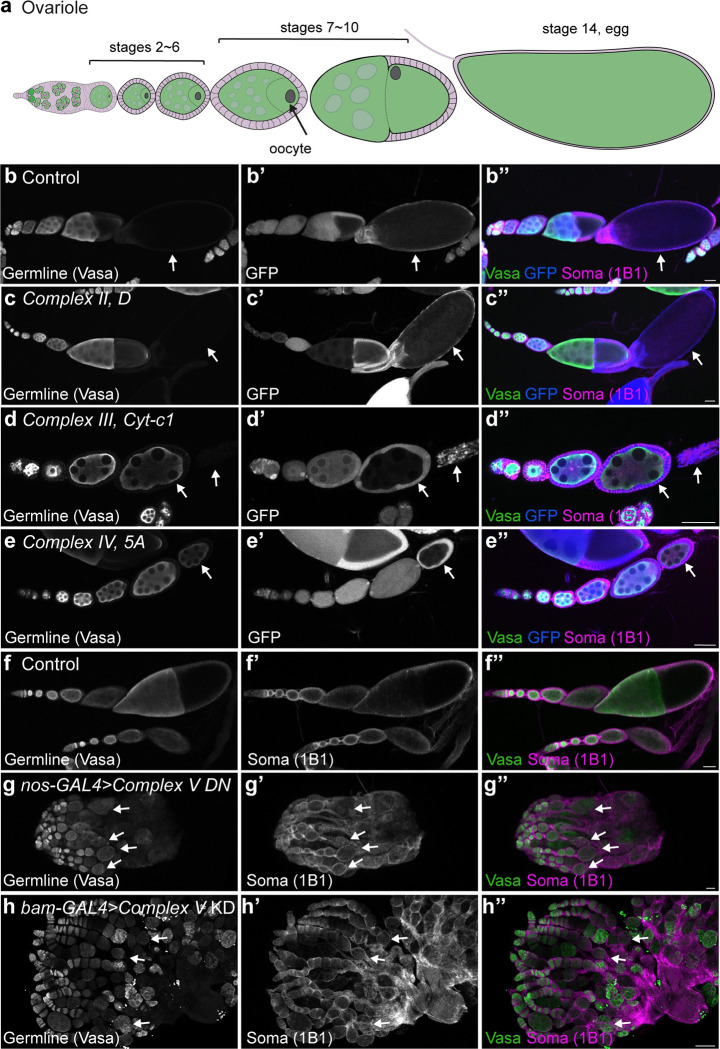
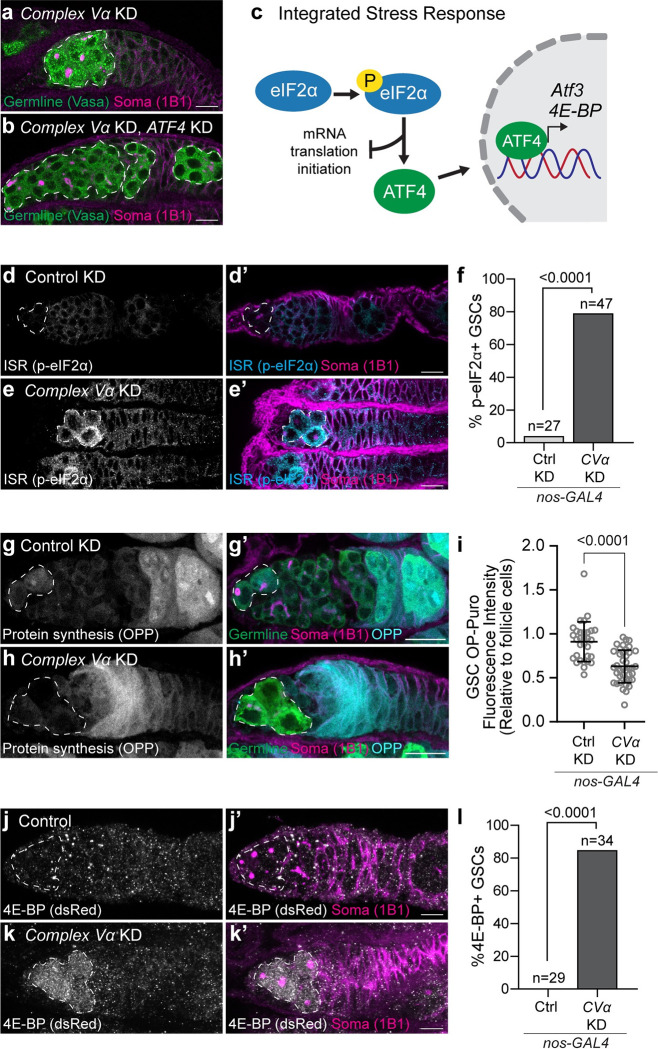
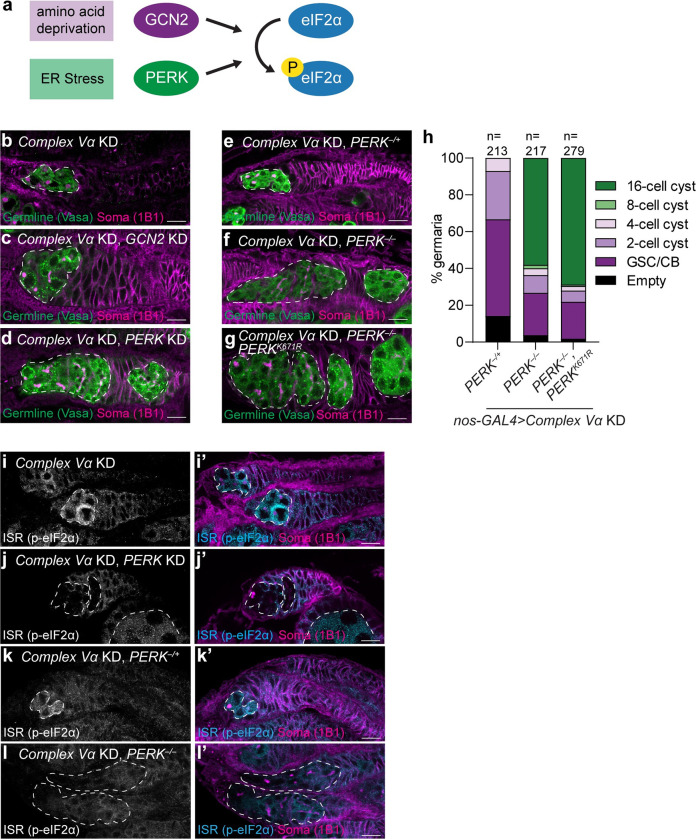
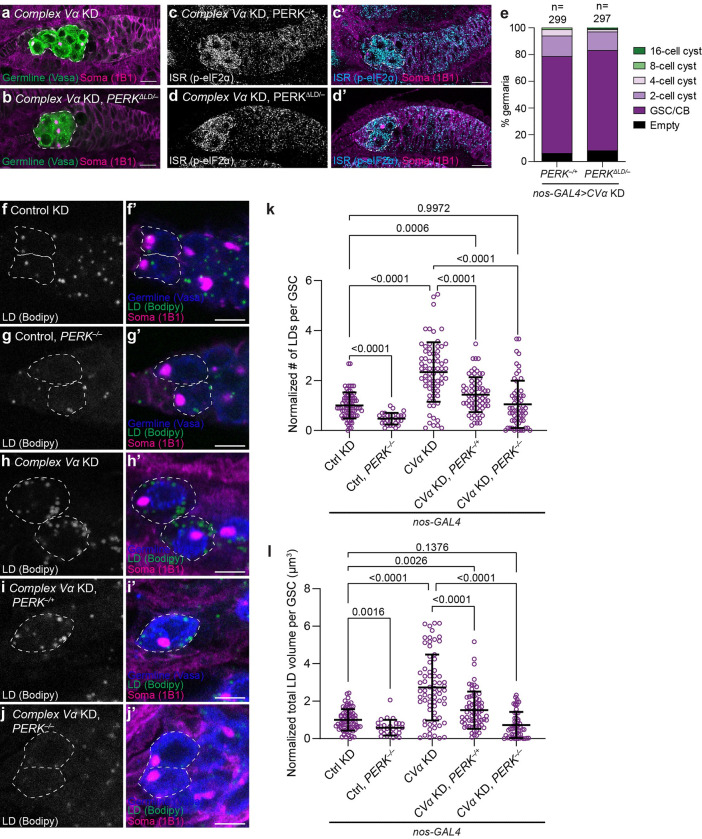
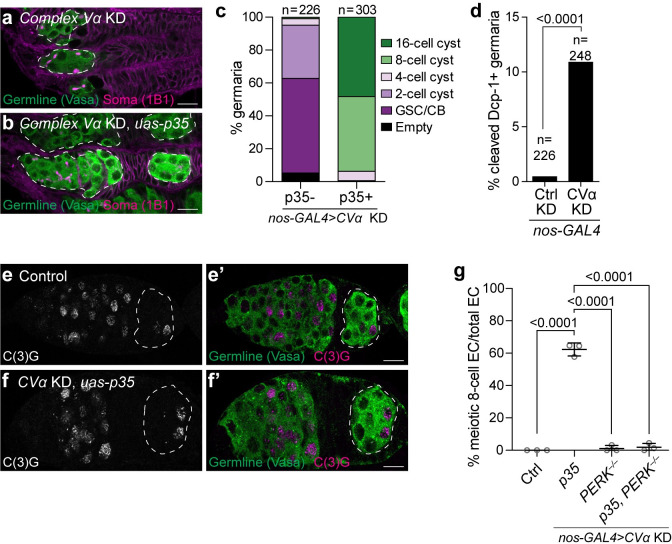
Stem cells often possess immature mitochondria with few inner membrane invaginations, which increase as stem cells differentiate. Despite this being a conserved feature across many stem cell types in numerous organisms, how and why mitochondria undergo such remodelling during stem cell differentiation has remained unclear. Here, using Drosophila germline stem cells (GSCs), we show that Complex V drives mitochondrial remodelling during the early stages of GSC differentiation, prior to terminal differentiation. This endows germline mitochondria with the capacity to generate large amounts of ATP required for later egg growth and development. Interestingly, impairing mitochondrial remodelling prior to terminal differentiation results in endoplasmic reticulum (ER) lipid bilayer stress, Protein kinase R-like ER kinase (PERK)-mediated activation of the Integrated Stress Response (ISR) and germ cell death. Taken together, our data suggest that mitochondrial remodelling is an essential and tightly integrated aspect of stem cell differentiation. This work sheds light on the potential impact of mitochondrial dysfunction on stem and germ cell function, highlighting ER lipid bilayer stress as a potential major driver of phenotypes caused by mitochondrial dysfunction.


Conflict of interest statement

The authors have declared that no competing interests exist.

Figures

Fig 1
Fig 1. Complex V is essential for germline stem cell differentiation.
(a) Drosophila germarium. GSCs at the anterior tip of germaria asymmetrically divide and differentiate. The differentiating cell undergoes four rounds of mitosis with incomplete cytokinesis to generate a 16-cell interconnected cysts. The 16-cell cyst buds off as an egg chamber to further mature into an egg. (b-d) Representative images of 1-day old Control (mCherry) (b), CVα (c), and CVe (d) KD germaria driven by nos-GAL4. White-dashed lines mark the germline. (e) Quantification of the latest differentiation stage in germaria of indicated genotypes. RNAi were driven by nos-GAL4. Number of germaria scored is indicated above each bar. (f) Complex V dimer at the tip of mitochondrial cristae. CVα forms one of the main catalytic components of the complex. Subunits g and e are required for dimerization. Putative null alleles in α and g were generated. (g, h) Representative images of Control (g) and CVα (h) mosaic germaria 14-days after clone induction. Mutant GFP-negative clones are marked with the white-dashed lines. (i, j) Frequency of CVα (i) and CVg (j) mutant clones 5-, 11- or 14-days after clone induction. Undifferentiated: germline cells in region 1 including GSC, cystoblasts, 2-, 4- and 8-cell cysts. Differentiated: germline cells in region 2 containing 16-cell cysts. Number of germaria observed are given inside the bars. P-values were calculated using Fisher’s exact test. For all images scale bars represent 10 μm. For exact genotypes see S2 Table.
Fig 2
Fig 2. Egg development requires mitochondrial oxidative phosphorylation.
(a) Schematic of an ovariole. An egg chamber is comprised of one oocyte, fifteen nurse cells and surrounding somatic follicle cells. Oogenesis comprises 14 stages resulting in the formation of a mature egg. (b-e) Representative images of Control (b), Complex II subunit D (c), Complex III Cyt-c1 (d) and Complex IV subunit 5A (e) mosaic ovarioles 14-days post-clone induction. Arrows indicate GFP-negative mutant cells. (f, g) Representative images of 2–3 day old Control (f) and germline expressed (nos-GAL4) Complex V dominant negative (DN) (g) in heterozygous CVc deficiency ovaries. (h) Representative image of a 2–3 day old bam-GAL4 driven CVα RNAi ovary. Arrows indicate the last stage observed in the representative ovariole. For all images scale bars represent 100 μm. For exact genotypes see S2 Table.
Fig 3
Fig 3. Complex V knockdown activates the Integrated Stress Response.
(a, b) Representative images of 2–3 day old CVα KD (a), and CVα and ATF4 KD (b) germaria. (c) Schematic of the Integrated Stress Response (ISR). Phosphorylation of eIF2α activates the ISR by inhibiting global cap-dependent translation and selectively upregulating the translation of the transcription factor, ATF4. ATF4 upregulates the transcription of stress response genes including 4E-BP and Atf3. (d, e) Representative images of 2–3 day old Control (mCherry) (d) and CVα (e) KD germaria. (f) Frequency of GSCs with high phosphorylated eIF2α relative to surrounding somatic cells from (d, e). (g, h) Representative images of 1-day old Control (mCherry) (g) and CVα (h) KD germaria incubated with O-propargyl-puromycin (OPP) to visualize protein synthesis. (i) Intensity of fluorescently derivatized OPP in GSCs relative to follicle cells of Control (mCherry) KD (n = 31) and CVα KD (n = 40). Data are the mean ± s.d. and an unpaired t-test was used for statistical analysis. (j, k) Representative images of less than one week old Control (j) and CVα (k) KD germaria expressing ATF4 reporter, 4E-BPintron-dsRed. (l) Frequency of dsRed-positive GSCs in (g, h). For (f, l) number of GSC analyzed and P-value (Fisher’s exact test) are given above bars. For (a, b) white-dashed lines demark the germline, and for (d-e, g-h, j-k) white-dashed line demark GSCs. All RNAi were driven by nos-GAL4. For exact genotypes see S2 Table.
Fig 4
Fig 4. Complex V knockdown activates the Integrated Stress Response through PERK.
(a) Schematic of Drosophila eIF2α kinases. Amino acid deprivation or endoplasmic reticulum (ER) stress activate either GCN2 or PERK, respectively. Both kinases dimerize and phosphorylate eIF2α. (b-d) Representative images of 2–3 day old CVα KD (b), CVα, GCN2 KD (c), and CVα, PERK KD (d) germaria. (e-g) Representative images of 1 day old CVα KD, PERK–/+ (e), CVα KD, PERK–/–(f), and CVα KD, PERK–/–, UAS-PERKK671R (g) germaria. (h) Phenotypic characterization and quantification of germline differentiation stage in germaria of (e-g). Number of germaria scored above each bar and were studied from 10 or more ovaries, obtained in at least three independent experiments and over two or more crosses. (i-l) Representative images of 2–3 day old CVα KD (i), CVα, PERK KD (j), CVα KD, PERK–/+ (k) and CVα KD, PERK–/–(l) germaria. All RNAi were driven by nos-GAL4. Images are representative of over 100 ovarioles and three independent experiments. Scale bars represent 10 μm. White-dashed line indicates the germline cells. For exact genotypes see S2 Table.
Fig 5
Fig 5. Complex V knockdown induces endoplasmic reticulum lipid bilayer stress.
(a-d) Representative images of 1-day old CVα KD, PERK–/+ (a, c) and CVα KD, PERKΔLD/–(b, d) germaria. GSCs are outlined in white-dashed lines. (e) Quantification of germline differentiation stage in germaria of indicated genotypes. Number of germaria scored above each bar. (f-j) Representative images of 2–3 day old Control (mCherry) KD (f), PERK–/–(g), CVα KD (h), CVα KD, PERK–/+ (i) and CVα KD, PERK–/–(j) GSCs (white-dashed line). BODIPY 493/503 marks lipid droplets. (k) Quantification of number of lipid droplets per GSC normalized to mean of Control for the indicated genotypes (n = 75 for Ctrl (mCherry) KD; n = 28 for Ctrl, PERK–/–; n = 71 for CVα KD; n = 68 for CVα KD, PERK–/+; and n = 59 for CVα KD, PERK–/–). (l) Quantification of total lipid droplet volume per GSC normalized to the mean of the Control for the indicated genotypes (n = 73 for Ctrl (mCherry) KD; n = 28 for Ctrl, PERK–/–; n = 72 for CVα KD; n = 68 for CVα KD, PERK–/+; and n = 55 for CVα KD, PERK–/–). All RNAis were driven by nos-GAL4. Scale bars represent 10 μm (a-d) and 5 μm (f-j). For all plots, germaria were studied from 10 or more ovaries, obtained in at least three independent experiments and over two or more crosses. For (k, l), data are mean ± s.d. and one-way ANOVA followed by Games-Howell multiple comparison’s test was used for statistical analysis. For exact genotypes see S2 Table.
Fig 6
Fig 6. Loss of Complex V induces precocious meiosis and cyst death.
(a, b) Representative images of 1 day old CVα KD (a) and CVα KD, P35 overexpression (b) germaria. White-dashed lines demarks the germline. (c) Phenotypic characterization and quantification of germline differentiation stage in germaria of (a, b). Number of germaria scored above each bar and were studied from 10 or more ovaries, obtained in at least three independent experiments and over two or more crosses. (d) Frequency of cell death positive germaria of 2–3-day old ovaries Control (mCherry) KD and CVα KD immunostained with anti-cleaved Dcp1, which marks cells undergoing apoptosis. Number of ovarioles studied and P-value (Fisher’s exact test) are given above bars. (e, f) Representative images of 1 day old Control (e) and CVα KD, P35 overexpression (f) germaria stained with the synaptonemal complex component C(3)G to mark cells in meiosis. See S12E and S12F Fig for confocal slices highlighting number of nuclei. White-dashed lines demark the Region 3 egg chamber. (g) Frequency of meiotic 8-cell cyst egg chambers (EC) for the indicated genotypes (n = 79 for Control (no GAL4); n = 122 for CVα KD, UAS-P35; n = 120 for CVα KD, PERK–/–; and n = 229 for CVα KD, UAS-P35, PERK–/–). Each data point represents a replicate with 20–90 egg chambers analyzed and plotted as mean ± s.d. An ANOVA followed by Tukey post-hoc test was performed. All RNAi and P35 were driven by nos-GAL4. For all images scale bars represent 10 μm. For exact genotypes see S2 Table.

Similar articles

Cited by

References

    1. Quirós PM, Mottis A, Auwerx J. Mitonuclear communication in homeostasis and stress. Nat Rev Mol Cell Biol. 2016;17: 213–226. doi: 10.1038/nrm.2016.23 - DOI - PubMed
    1. Lisowski P, Kannan P, Mlody B, Prigione A. Mitochondria and the dynamic control of stem cell homeostasis. EMBO Rep. 2018;19: e45432. doi: 10.15252/embr.201745432 - DOI - PMC - PubMed
    1. Bahat A, Gross A. Mitochondrial plasticity in cell fate regulation. J Biol Chem. 2019;294: 13852–13863. doi: 10.1074/jbc.REV118.000828 - DOI - PMC - PubMed
    1. Rafalski VA, Mancini E, Brunet A. Energy metabolism and energy-sensing pathways in mammalian embryonic and adult stem cell fate. J Cell Sci. 2012;125: 5597–5608. doi: 10.1242/jcs.114827 - DOI - PMC - PubMed
    1. Khacho M, Clark A, Svoboda DS, Azzi J, MacLaurin JG, Meghaizel C, et al.. Mitochondrial Dynamics Impacts Stem Cell Identity and Fate Decisions by Regulating a Nuclear Transcriptional Program. Cell Stem Cell. 2016;19: 232–247. doi: 10.1016/j.stem.2016.04.015 - DOI - PubMed

Publication types