Reinforcement amid genetic diversity in the Candida albicans biofilm regulatory network
- PMID: 36696432
- PMCID: PMC9901766
- DOI: 10.1371/journal.ppat.1011109
Reinforcement amid genetic diversity in the Candida albicans biofilm regulatory network
Abstract
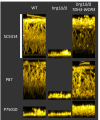
Biofilms of the fungal pathogen Candida albicans include abundant long filaments called hyphae. These cells express hypha-associated genes, which specify diverse virulence functions including surface adhesins that ensure biofilm integrity. Biofilm formation, virulence, and hypha-associated gene expression all depend upon the transcription factor Efg1. This transcription factor has been characterized extensively in the C. albicans type strain SC5314 and derivatives, but only recently has its function been explored in other clinical isolates. Here we define a principal set of Efg1-responsive genes whose expression is significantly altered by an efg1Δ/Δ mutation across 17 clinical isolates. This principal gene set includes 68 direct Efg1 targets, whose 5' regions are bound by Efg1 in five clinical isolates, and 42 indirect Efg1 targets, whose 5' regions are not detectably bound by Efg1. Three direct Efg1 target genes encode transcription factors-BRG1, UME6, and WOR3 -whose increased expression in an efg1Δ/Δ mutant restores expression of multiple indirect and direct principal targets, as well as biofilm formation ability. Although BRG1 and UME6 are well known positive regulators of hypha-associated genes and biofilm formation, WOR3 is best known as an antagonist of Efg1 in the sexual mating pathway. We confirm the positive role of WOR3 in biofilm formation with the finding that a wor3Δ/Δ mutation impairs biofilm formation in vitro and in an in vivo biofilm model. Positive control of Efg1 direct target genes by other Efg1 direct target genes-BRG1, UME6, and WOR3 -may buffer principal Efg1-responsive gene expression against the impact of genetic variation in the C. albicans species.
Copyright: © 2023 Cravener et al. This is an open access article distributed under the terms of the Creative Commons Attribution License, which permits unrestricted use, distribution, and reproduction in any medium, provided the original author and source are credited.
Conflict of interest statement
The authors have declared that no competing interests exist.
Figures


Similar articles
-
A Brg1-Rme1 circuit in Candida albicans hyphal gene regulation.mBio. 2024 Sep 11;15(9):e0187224. doi: 10.1128/mbio.01872-24. Epub 2024 Jul 30. mBio. 2024. PMID: 39078139 Free PMC article.
-
Collaboration between Antagonistic Cell Type Regulators Governs Natural Variation in the Candida albicans Biofilm and Hyphal Gene Expression Network.mBio. 2022 Oct 26;13(5):e0193722. doi: 10.1128/mbio.01937-22. Epub 2022 Aug 22. mBio. 2022. PMID: 35993746 Free PMC article.
-
Strain-limited biofilm regulation through the Brg1-Rme1 circuit in Candida albicans.mSphere. 2025 Jan 28;10(1):e0098024. doi: 10.1128/msphere.00980-24. Epub 2024 Dec 31. mSphere. 2025. PMID: 39745385 Free PMC article.
-
EFG1, Everyone's Favorite Gene in Candida albicans: A Comprehensive Literature Review.Front Cell Infect Microbiol. 2022 Mar 22;12:855229. doi: 10.3389/fcimb.2022.855229. eCollection 2022. Front Cell Infect Microbiol. 2022. PMID: 35392604 Free PMC article. Review.
-
Histone deacetylase-mediated morphological transition in Candida albicans.J Microbiol. 2015 Dec;53(12):805-11. doi: 10.1007/s12275-015-5488-3. Epub 2015 Dec 2. J Microbiol. 2015. PMID: 26626350 Review.
Cited by
-
Alternative sulphur metabolism in the fungal pathogen Candida parapsilosis.Nat Commun. 2024 Oct 24;15(1):9190. doi: 10.1038/s41467-024-53442-8. Nat Commun. 2024. PMID: 39448588 Free PMC article.
-
Identification of an active RNAi pathway in Candida albicans.Proc Natl Acad Sci U S A. 2024 Apr 23;121(17):e2315926121. doi: 10.1073/pnas.2315926121. Epub 2024 Apr 16. Proc Natl Acad Sci U S A. 2024. PMID: 38625945 Free PMC article.
-
Evolution and strain diversity advance exploration of Candida albicans biology.mSphere. 2024 Aug 28;9(8):e0064123. doi: 10.1128/msphere.00641-23. Epub 2024 Jul 16. mSphere. 2024. PMID: 39012122 Free PMC article. Review.
-
The Candida albicans reference strain SC5314 contains a rare, dominant allele of the transcription factor Rob1 that modulates biofilm formation and oral commensalism.bioRxiv [Preprint]. 2023 Jun 17:2023.06.17.545405. doi: 10.1101/2023.06.17.545405. bioRxiv. 2023. Update in: mBio. 2023 Oct 31;14(5):e0152123. doi: 10.1128/mbio.01521-23. PMID: 37398495 Free PMC article. Updated. Preprint.
-
A Brg1-Rme1 circuit in Candida albicans hyphal gene regulation.mBio. 2024 Sep 11;15(9):e0187224. doi: 10.1128/mbio.01872-24. Epub 2024 Jul 30. mBio. 2024. PMID: 39078139 Free PMC article.
References
-
- Penesyan A, Paulsen IT, Kjelleberg S, Gillings MR. Three faces of biofilms: a microbial lifestyle, a nascent multicellular organism, and an incubator for diversity. NPJ Biofilms Microbiomes. 2021;7(1):80. Epub 2021/11/12. doi: 10.1038/s41522-021-00251-2 ; PubMed Central PMCID: PMC8581019. - DOI - PMC - PubMed
Publication types
MeSH terms
Substances
Grants and funding
LinkOut - more resources
Full Text Sources
Miscellaneous

