

Handheld Purification-Free Nucleic Acid Testing Device for Point-of-Need Detection of Malaria from Whole Blood
- PMID: 36696460
- PMCID: PMC11214673
- DOI: 10.1021/acssensors.2c02169
Handheld Purification-Free Nucleic Acid Testing Device for Point-of-Need Detection of Malaria from Whole Blood
Abstract
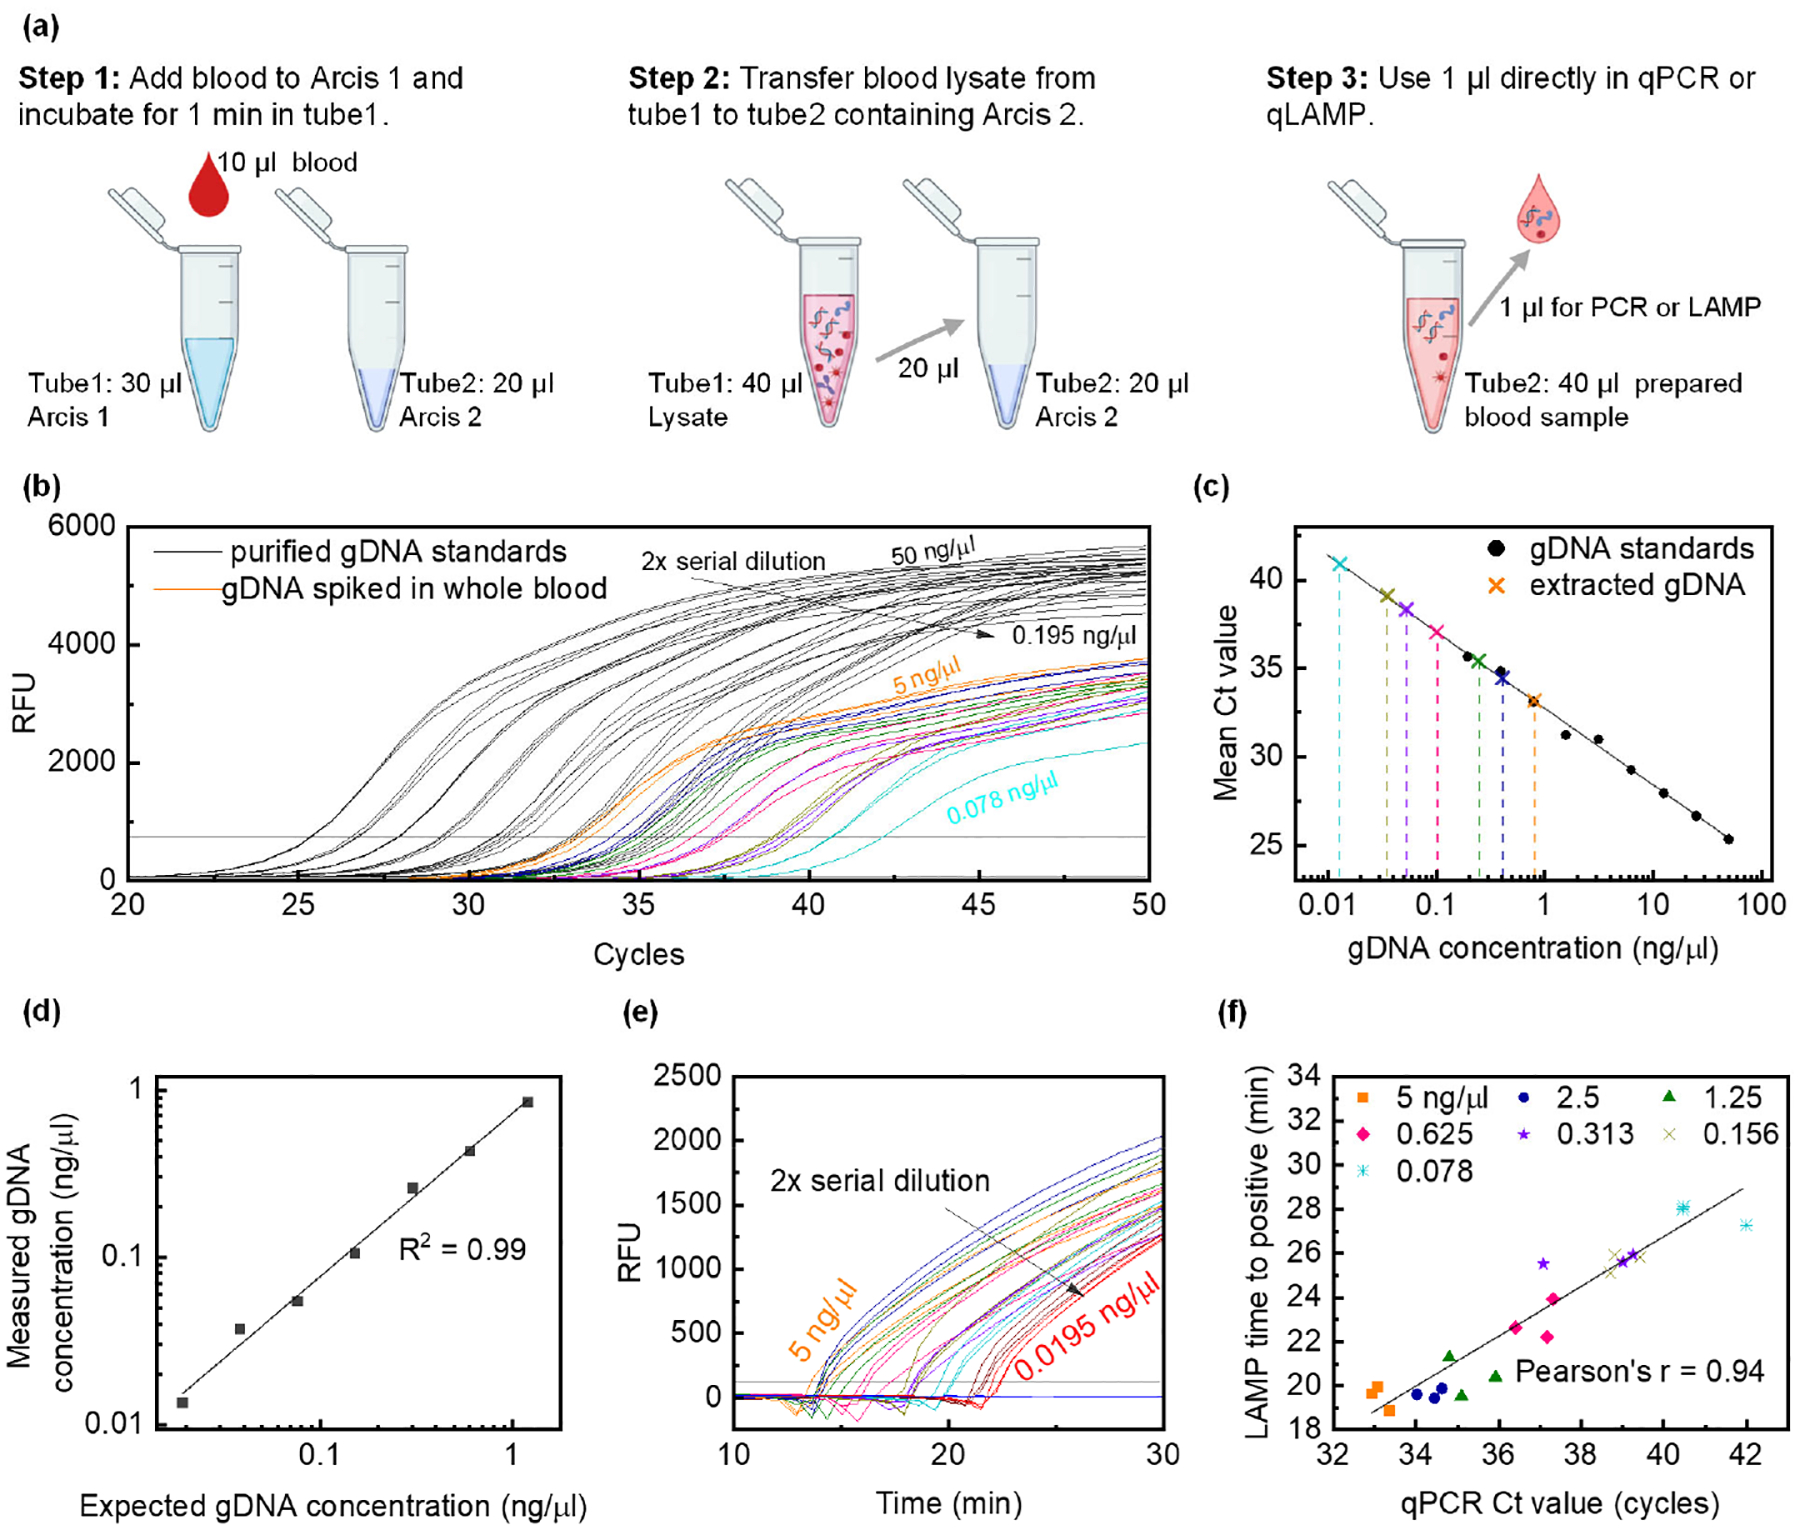
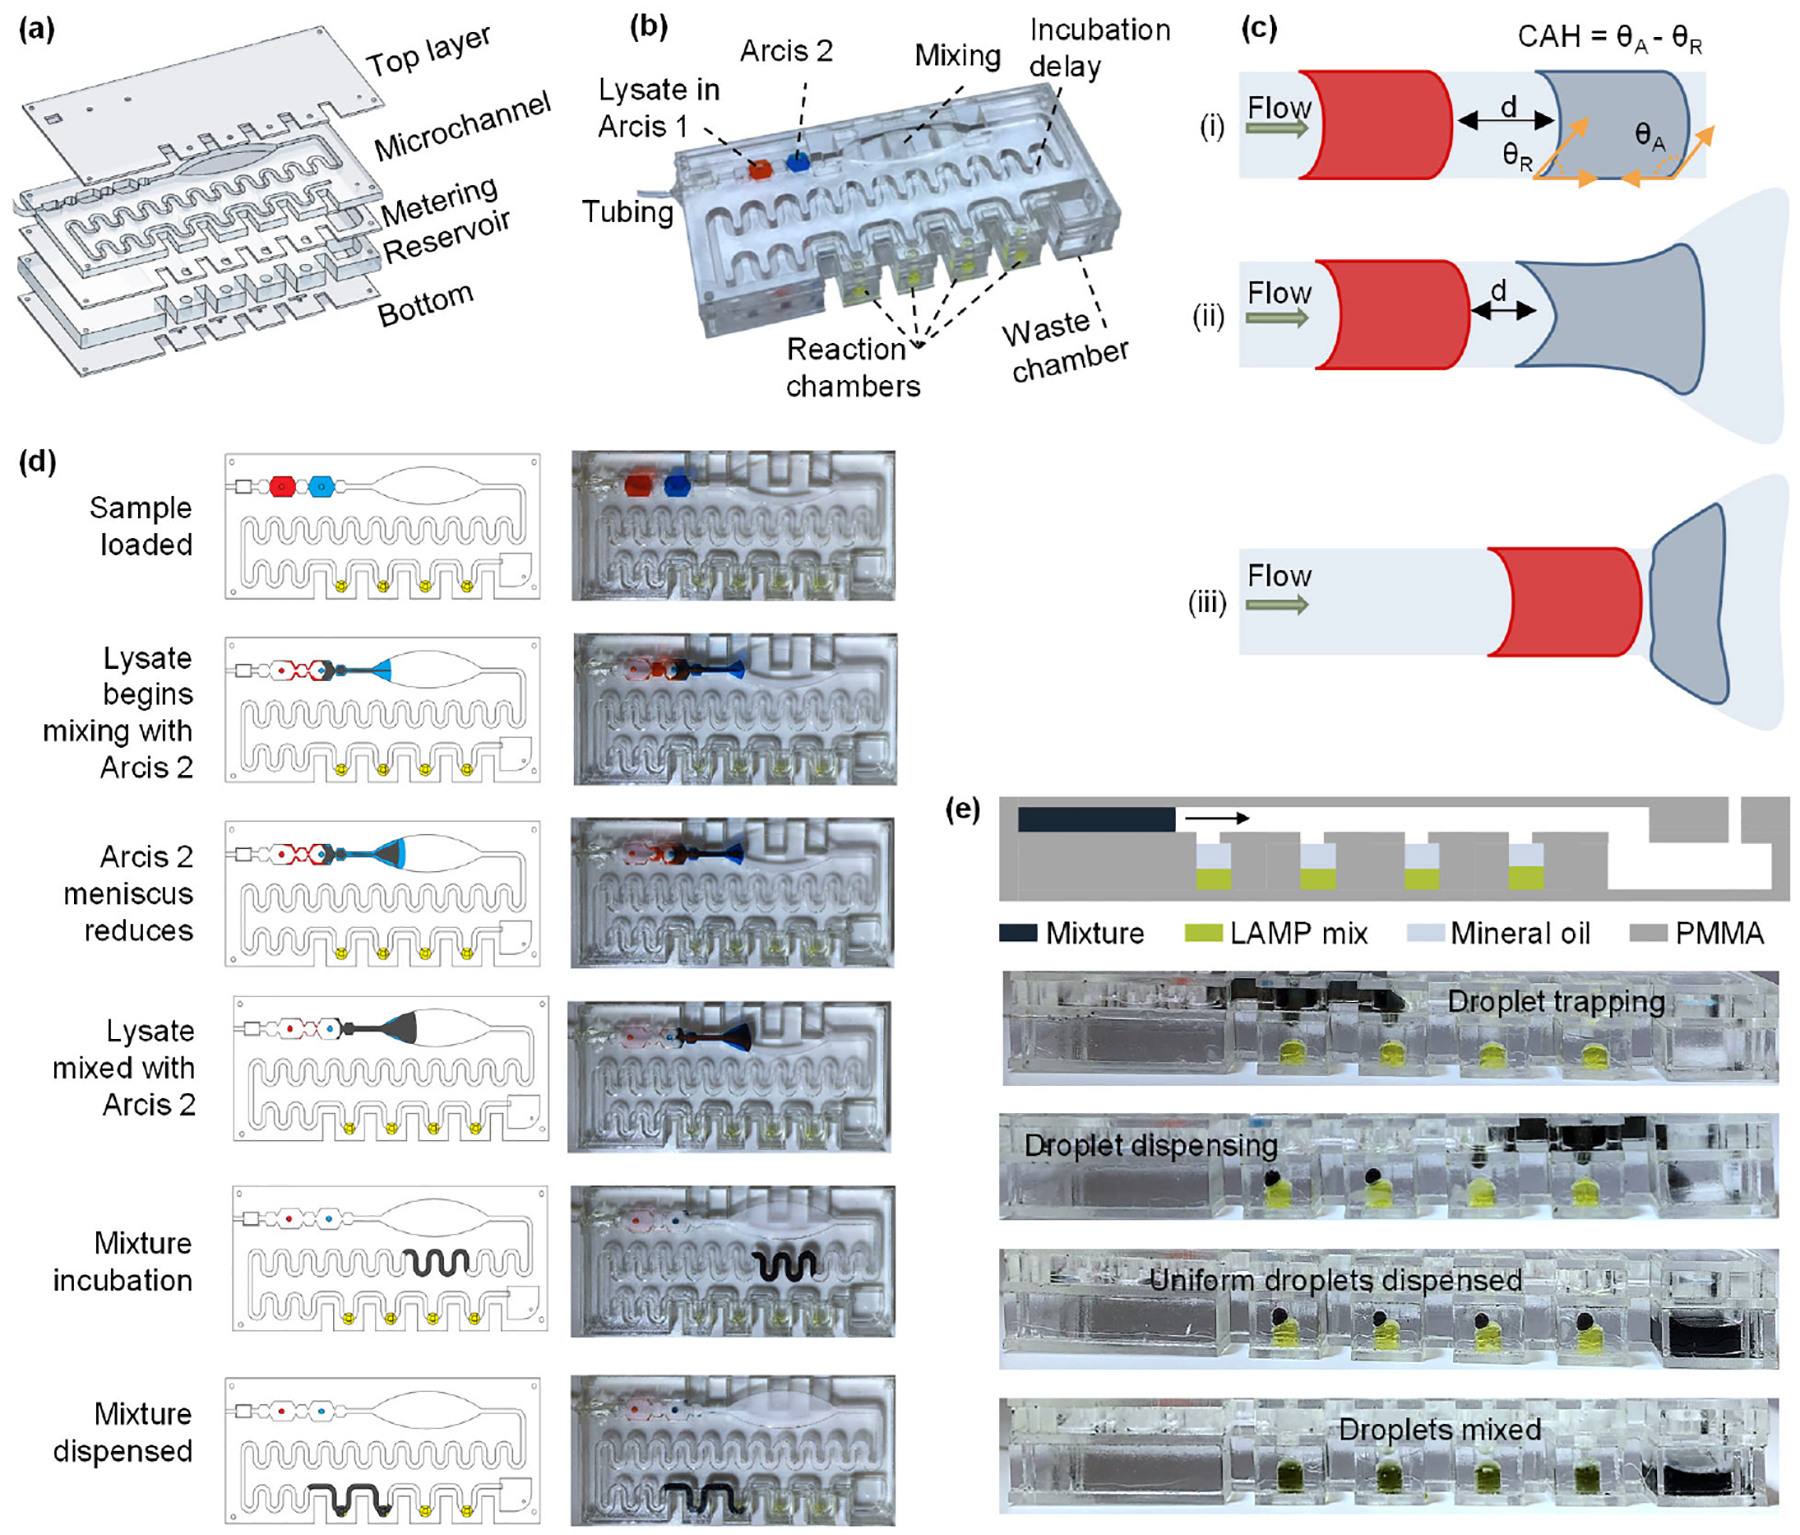
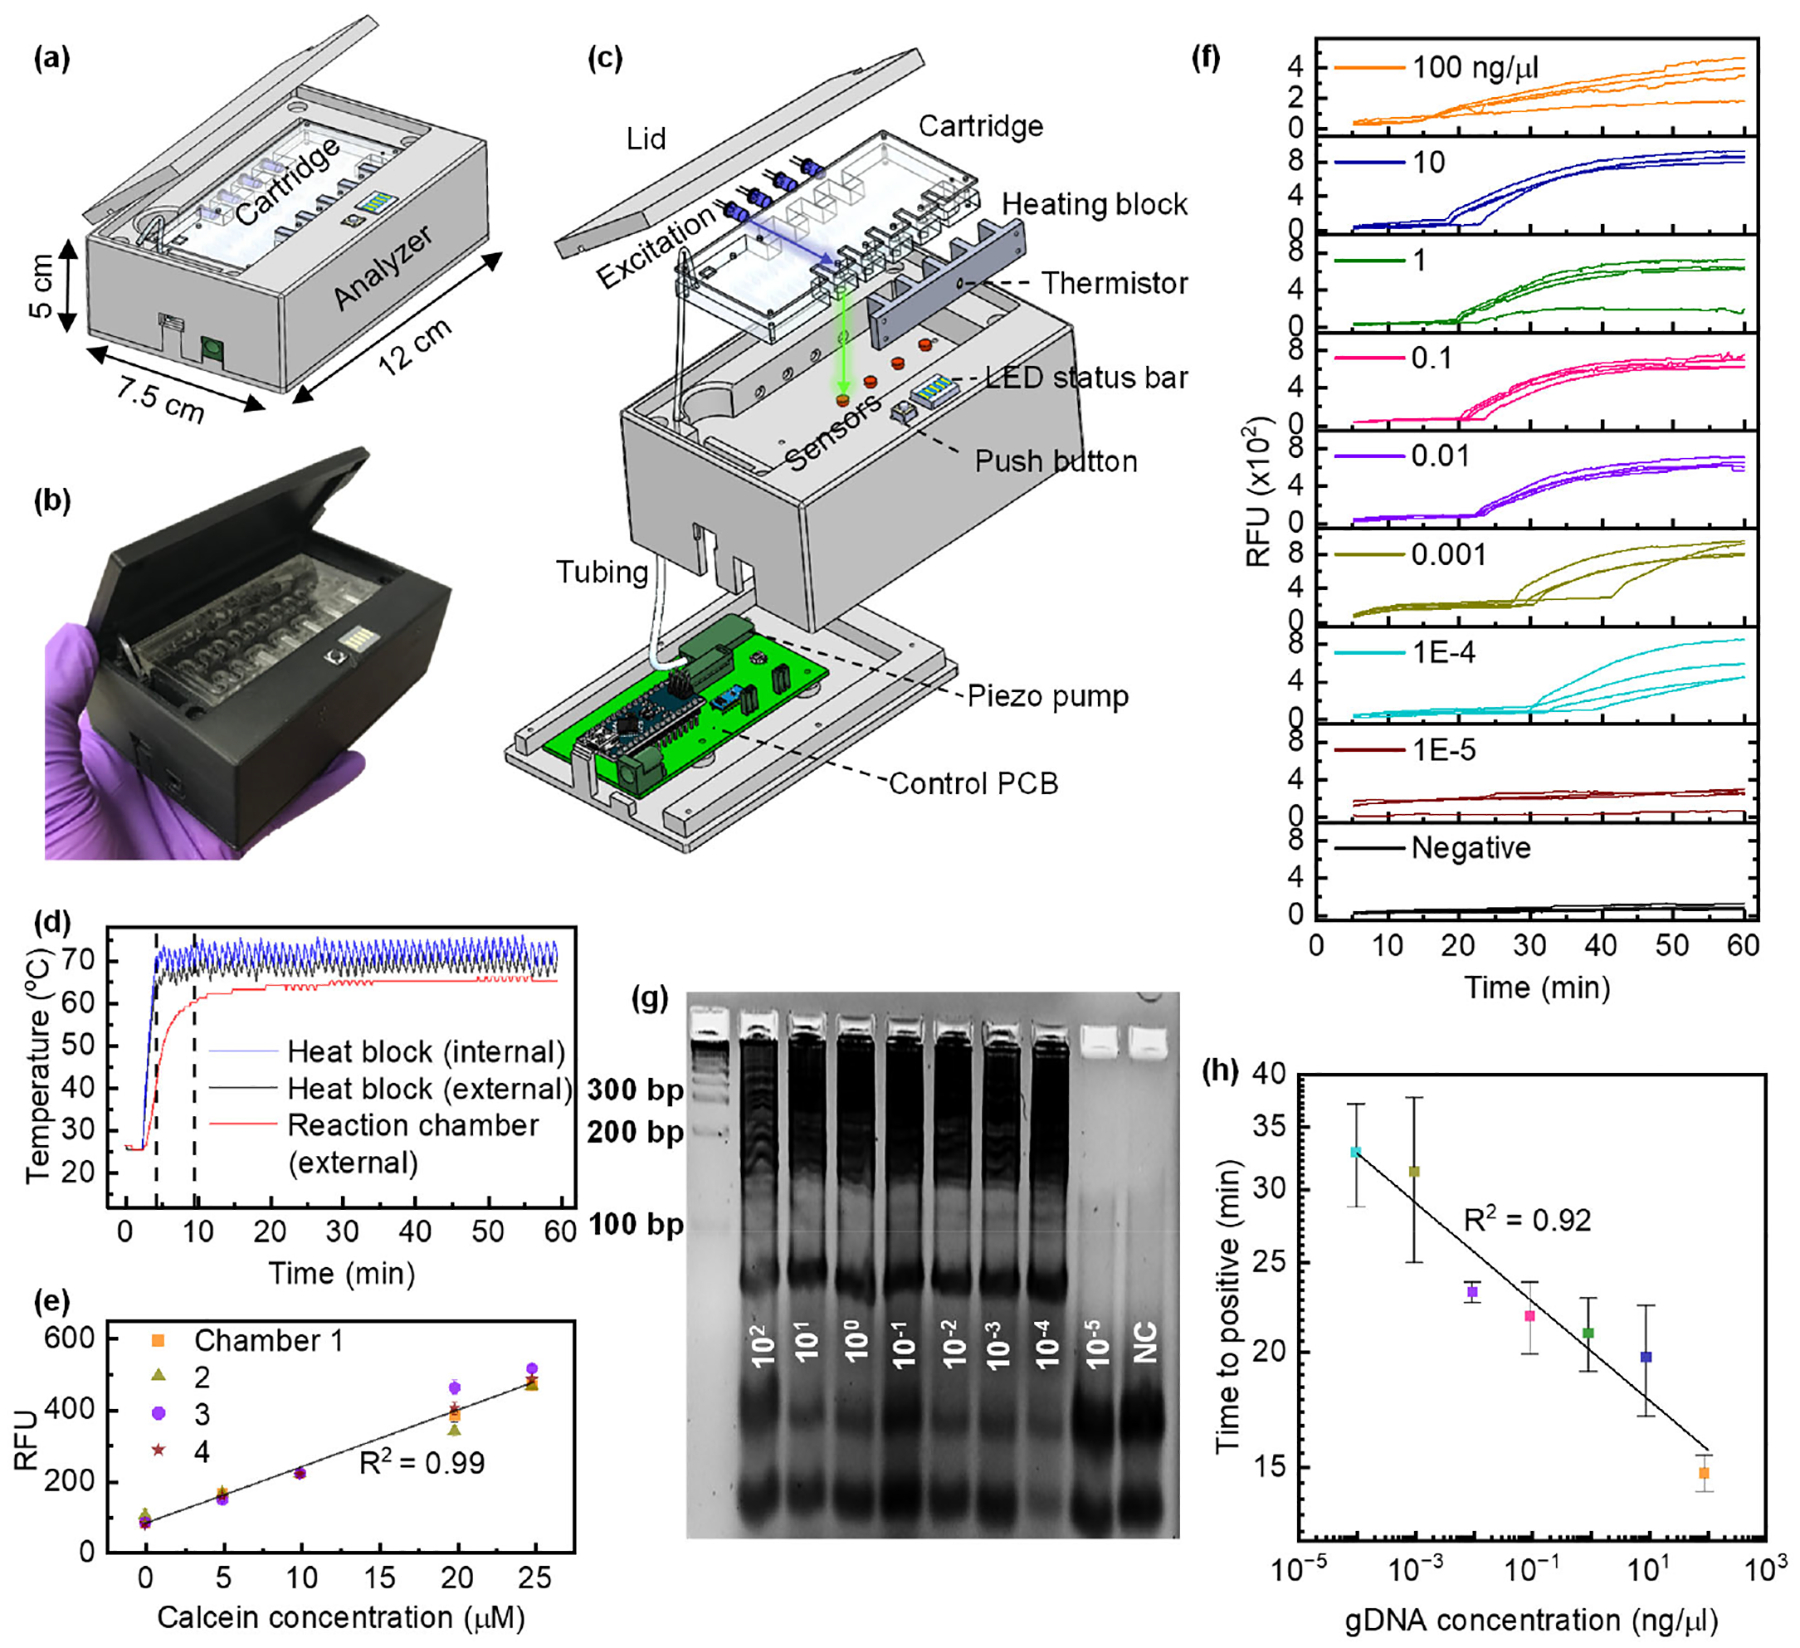
World Health Organization's aim to eliminate malaria from developing/resource-limited economies requires easy access to low-cost, highly sensitive, and specific screening. We present a handheld nucleic acid testing device with on-chip automated sample preparation to detect malaria (Plasmodium falciparum) infection from a whole blood sample as a feasibility study. We used a simple two-reagent-based purification-free protocol to prepare the whole blood sample on a piezo pump pressure-driven microfluidic cartridge. The cartridge includes a unique mixing chamber for sample preparation and metering structures to dispense a predetermined volume of the sample lysate mixture into four chambers containing a reaction mix. The parasite genomic DNA concentration can be estimated by monitoring the fluorescence generated from the loop-mediated isothermal amplification reaction in real time. We achieved a sensitivity of ∼0.42 parasite/μL of whole blood, sufficient for detecting asymptomatic malaria parasite carriers.
Keywords: loop-mediated isothermal amplification (LAMP); malaria; microfluidics; nucleic acid testing (NAT); point-of-need; purification-free.
Conflict of interest statement
Declarations of interests
The authors declare that they have no known competing financial interests or personal relationships that could have appeared to influence the work reported in this paper.
Figures

Similar articles
-
Sample-to-Answer Microfluidic Nucleic Acid Testing (NAT) on Lab-on-a-Disc for Malaria Detection at Point of Need.Methods Mol Biol. 2022;2393:297-313. doi: 10.1007/978-1-0716-1803-5_16. Methods Mol Biol. 2022. PMID: 34837186 Free PMC article.
-
Sample-to-answer palm-sized nucleic acid testing device towards low-cost malaria mass screening.Biosens Bioelectron. 2018 Sep 15;115:83-90. doi: 10.1016/j.bios.2018.05.019. Epub 2018 May 19. Biosens Bioelectron. 2018. PMID: 29803865 Free PMC article.
-
Loop-Mediated Isothermal Amplification and LFD Combination for Detection of Plasmodium falciparum and Plasmodium vivax.Methods Mol Biol. 2017;1572:431-443. doi: 10.1007/978-1-4939-6911-1_28. Methods Mol Biol. 2017. PMID: 28299704
-
Expanding the malaria molecular diagnostic options: opportunities and challenges for loop-mediated isothermal amplification tests for malaria control and elimination.Expert Rev Mol Diagn. 2018 Feb;18(2):195-203. doi: 10.1080/14737159.2018.1431529. Epub 2018 Jan 28. Expert Rev Mol Diagn. 2018. PMID: 29353522 Review.
-
Microfluidic approaches to malaria detection.Acta Trop. 2004 Feb;89(3):357-69. doi: 10.1016/j.actatropica.2003.11.009. Acta Trop. 2004. PMID: 14744562 Free PMC article. Review.
Cited by
-
ViraLite: An Ultracompact HIV Viral Load Self-Testing System with Internal Quality Control.medRxiv [Preprint]. 2025 Apr 3:2025.04.01.25325036. doi: 10.1101/2025.04.01.25325036. medRxiv. 2025. PMID: 40236396 Free PMC article. Preprint.
-
Deep Learning Enabled Universal Multiplexed Fluorescence Detection for Point-of-Care Applications.ACS Sens. 2024 Aug 23;9(8):4017-4027. doi: 10.1021/acssensors.4c00860. Epub 2024 Jul 15. ACS Sens. 2024. PMID: 39010300 Free PMC article.
-
Thermally Responsive Alkane Partitions and a Magnetofluidic Assay for Point-of-Sample Detection of Viruses in Wastewater.Biosensors (Basel). 2025 Apr 29;15(5):276. doi: 10.3390/bios15050276. Biosensors (Basel). 2025. PMID: 40422015 Free PMC article.
-
Cancer Methylation Biomarker Detection in an Automated, Portable, Multichannel Magnetofluidic Platform.ACS Nano. 2024 May 14;18(19):12105-12116. doi: 10.1021/acsnano.3c10070. Epub 2024 Apr 26. ACS Nano. 2024. PMID: 38669469 Free PMC article.
-
Sample-to-Answer Detection of SARS-CoV-2 Viremia Using Thermally Responsive Alkane Partitions.Anal Chem. 2024 Jul 23;96(29):12049-12056. doi: 10.1021/acs.analchem.4c02105. Epub 2024 Jul 8. Anal Chem. 2024. PMID: 38975928 Free PMC article.
References
-
- World Health Organization. World malaria report 2020: 20 years of global progress and challenges; World Health Organization, 2020.
-
- Wu L; van den Hoogen LL; Slater H; Walker PGT; Ghani AC; Drakeley CJ; Okell LC Comparison of diagnostics for the detection of asymptomatic Plasmodium falciparum infections to inform control and elimination strategies. Nature 2015, 528 (7580), S86–S93. - PubMed
Publication types
MeSH terms
Substances
Grants and funding
LinkOut - more resources
Full Text Sources
Medical
