. 2023 Jan 25;15(680):eadd9012.
doi: 10.1126/scitranslmed.add9012. Epub 2023 Jan 25.

Malaria-driven expansion of adaptive-like functional CD56-negative NK cells correlates with clinical immunity to malaria

Affiliations

Malaria-driven expansion of adaptive-like functional CD56-negative NK cells correlates with clinical immunity to malaria

Maureen Ty et al. Sci Transl Med. .

Abstract

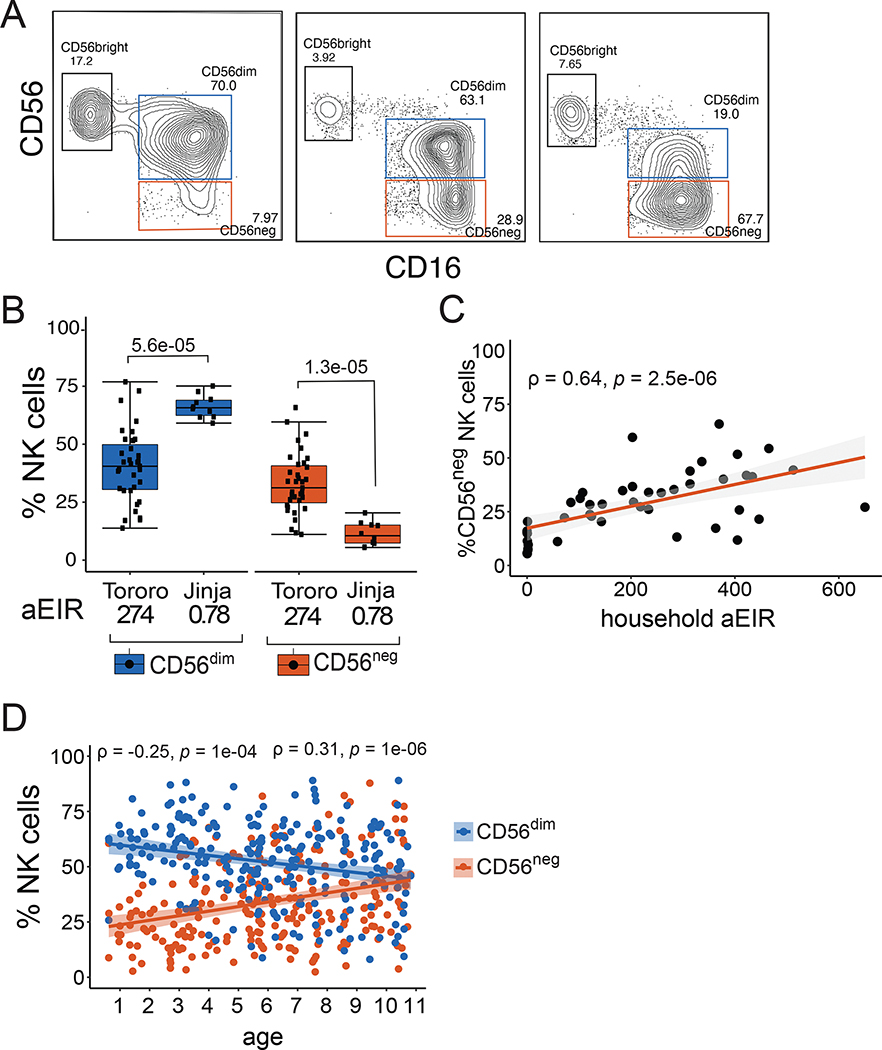
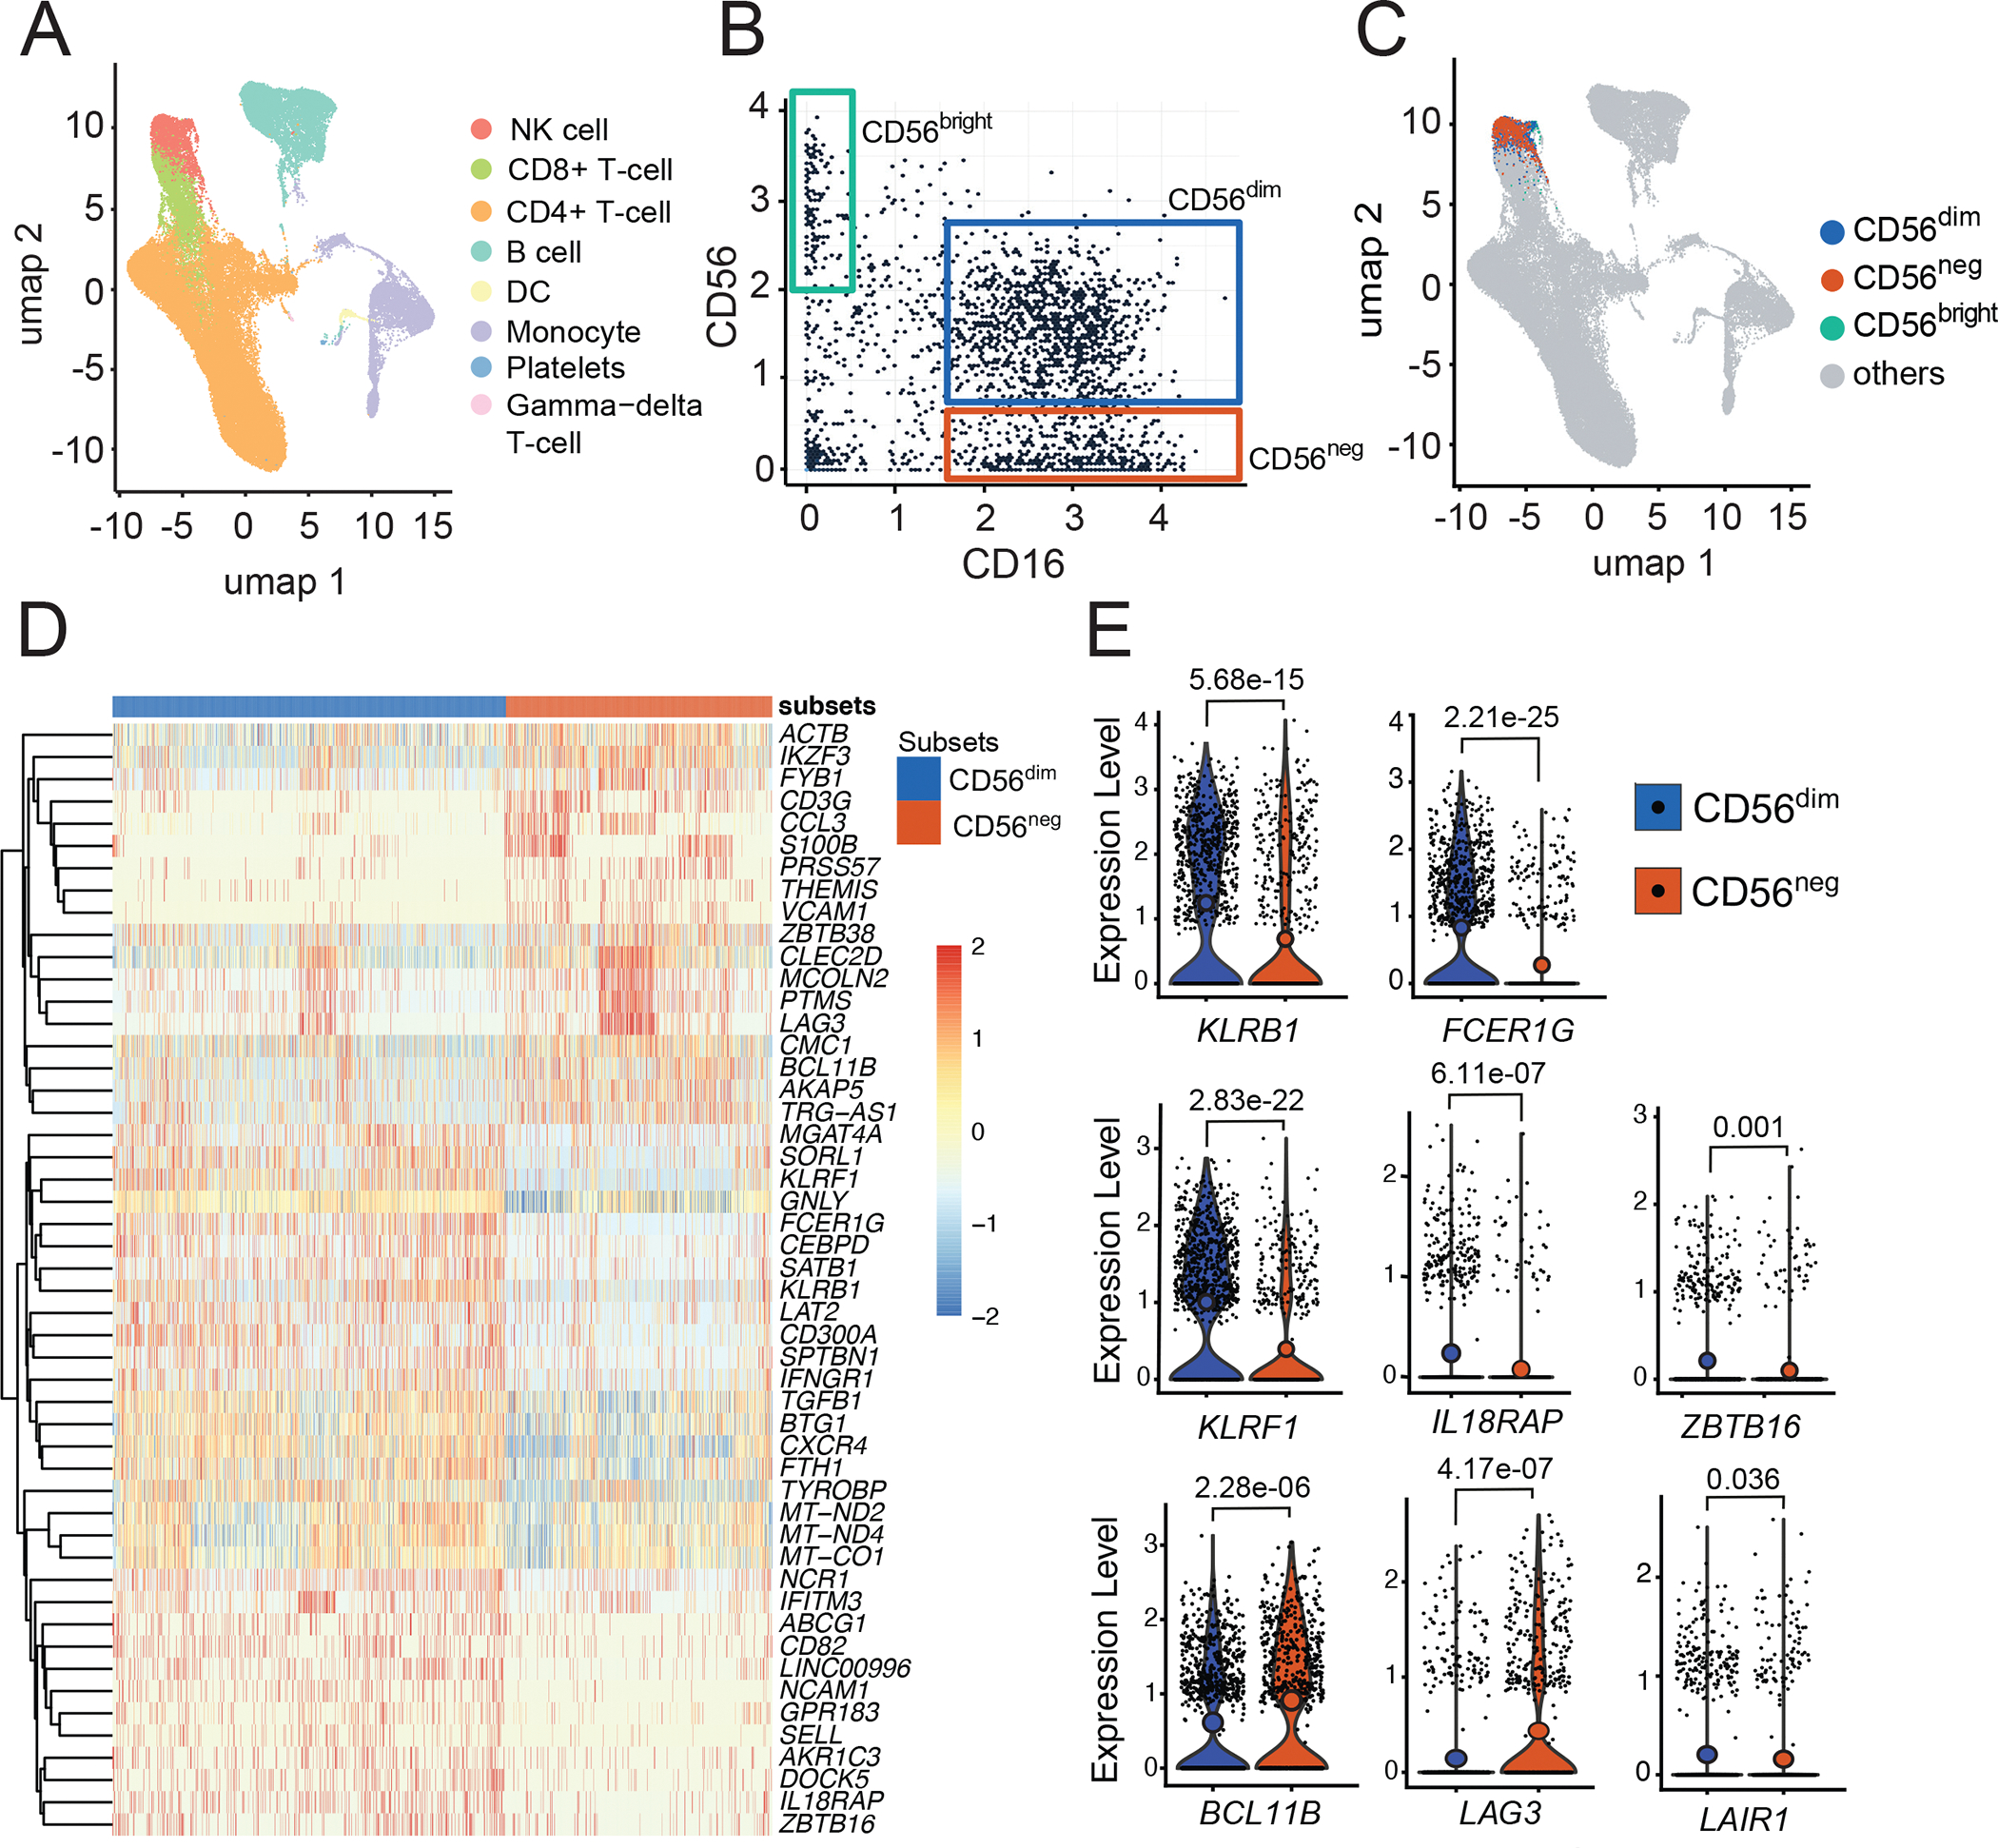
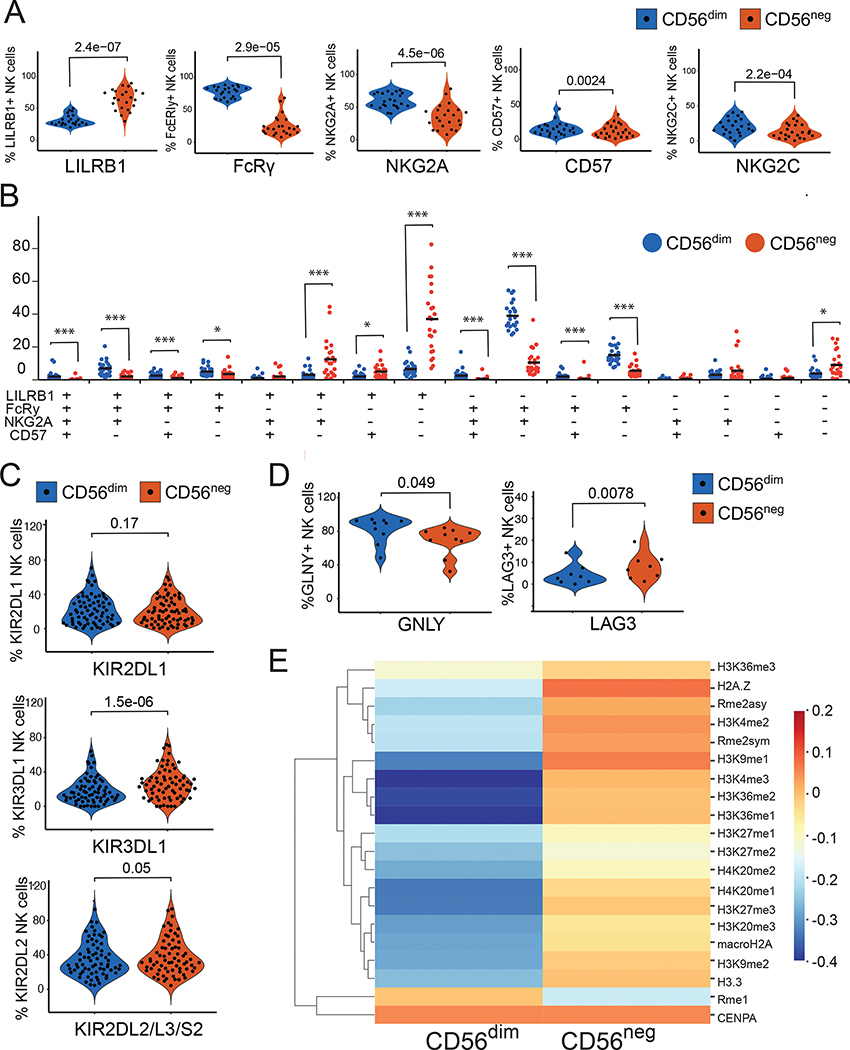
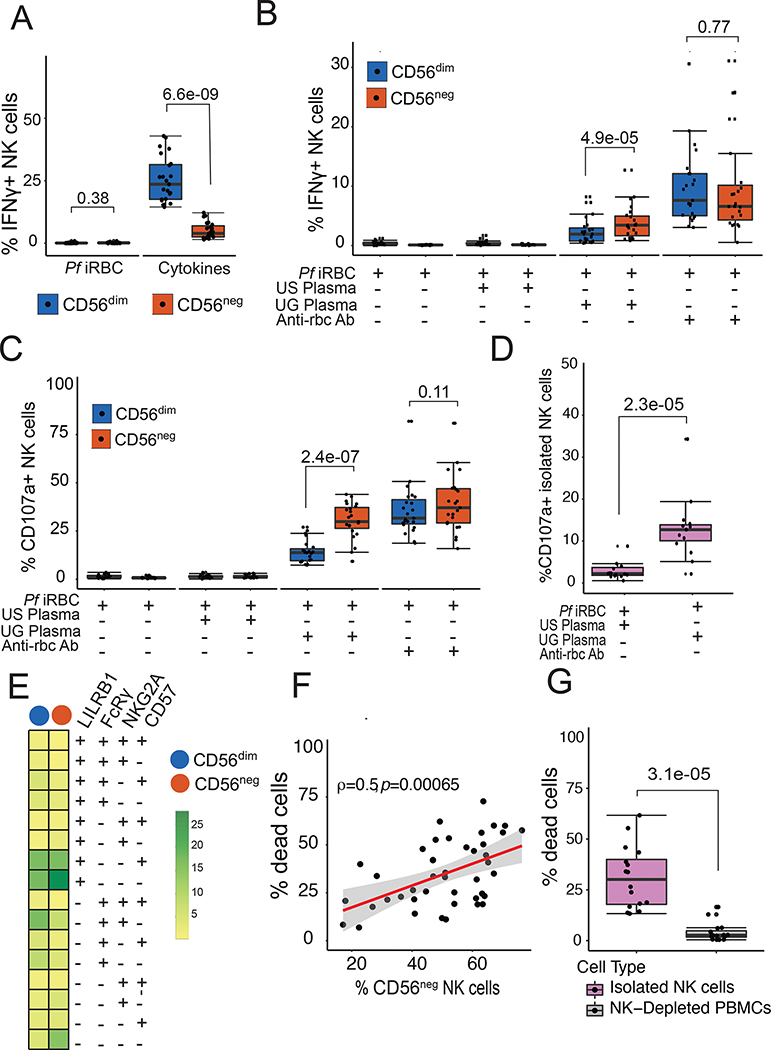
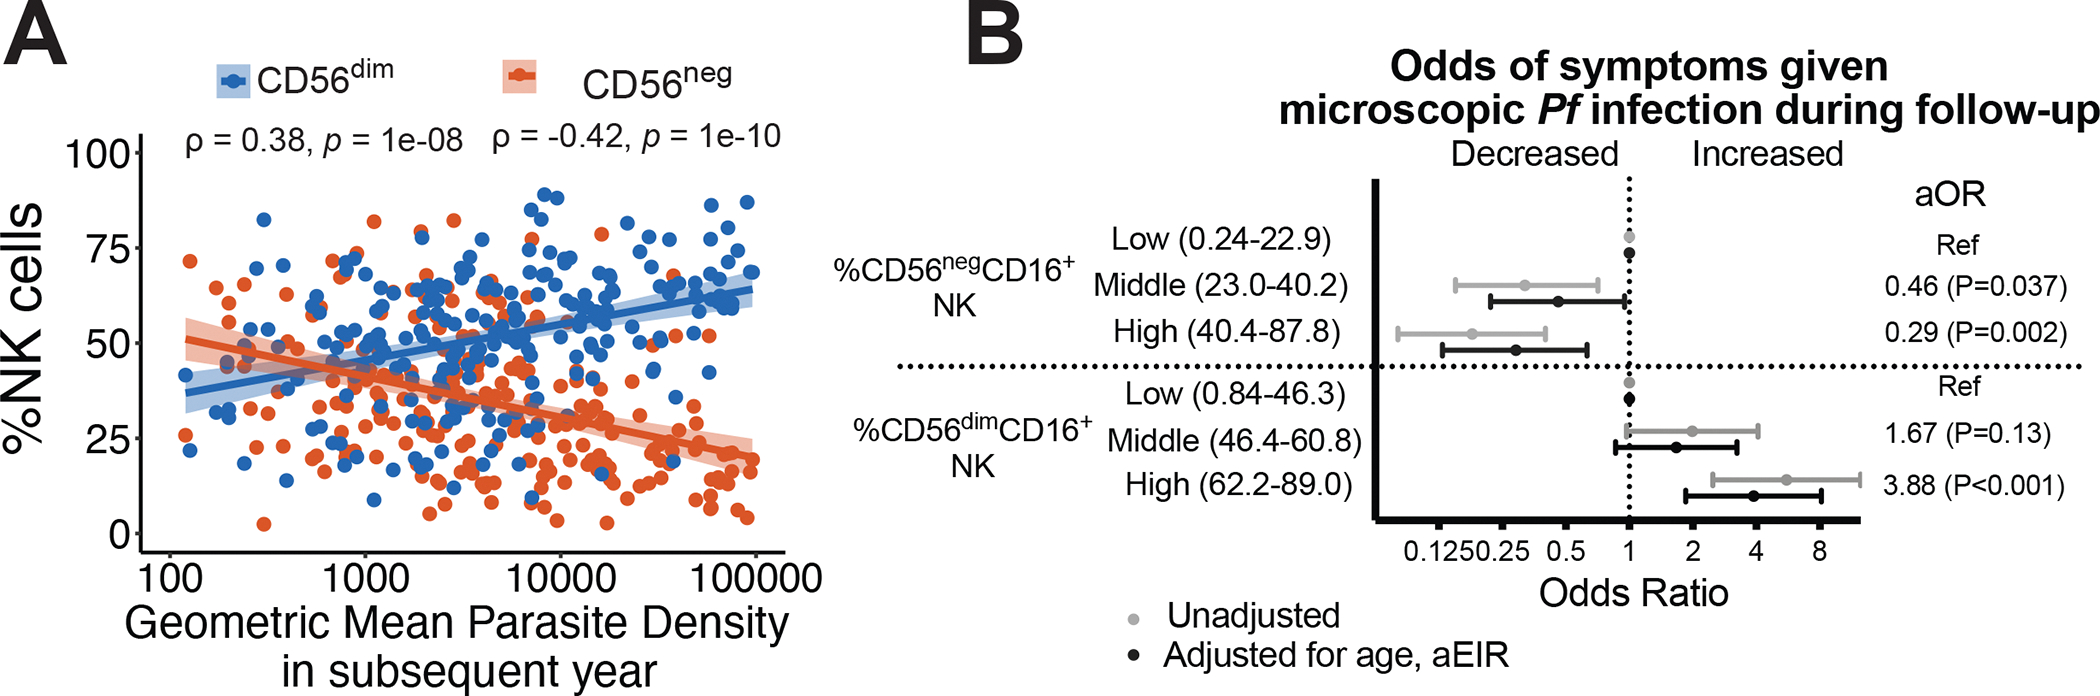
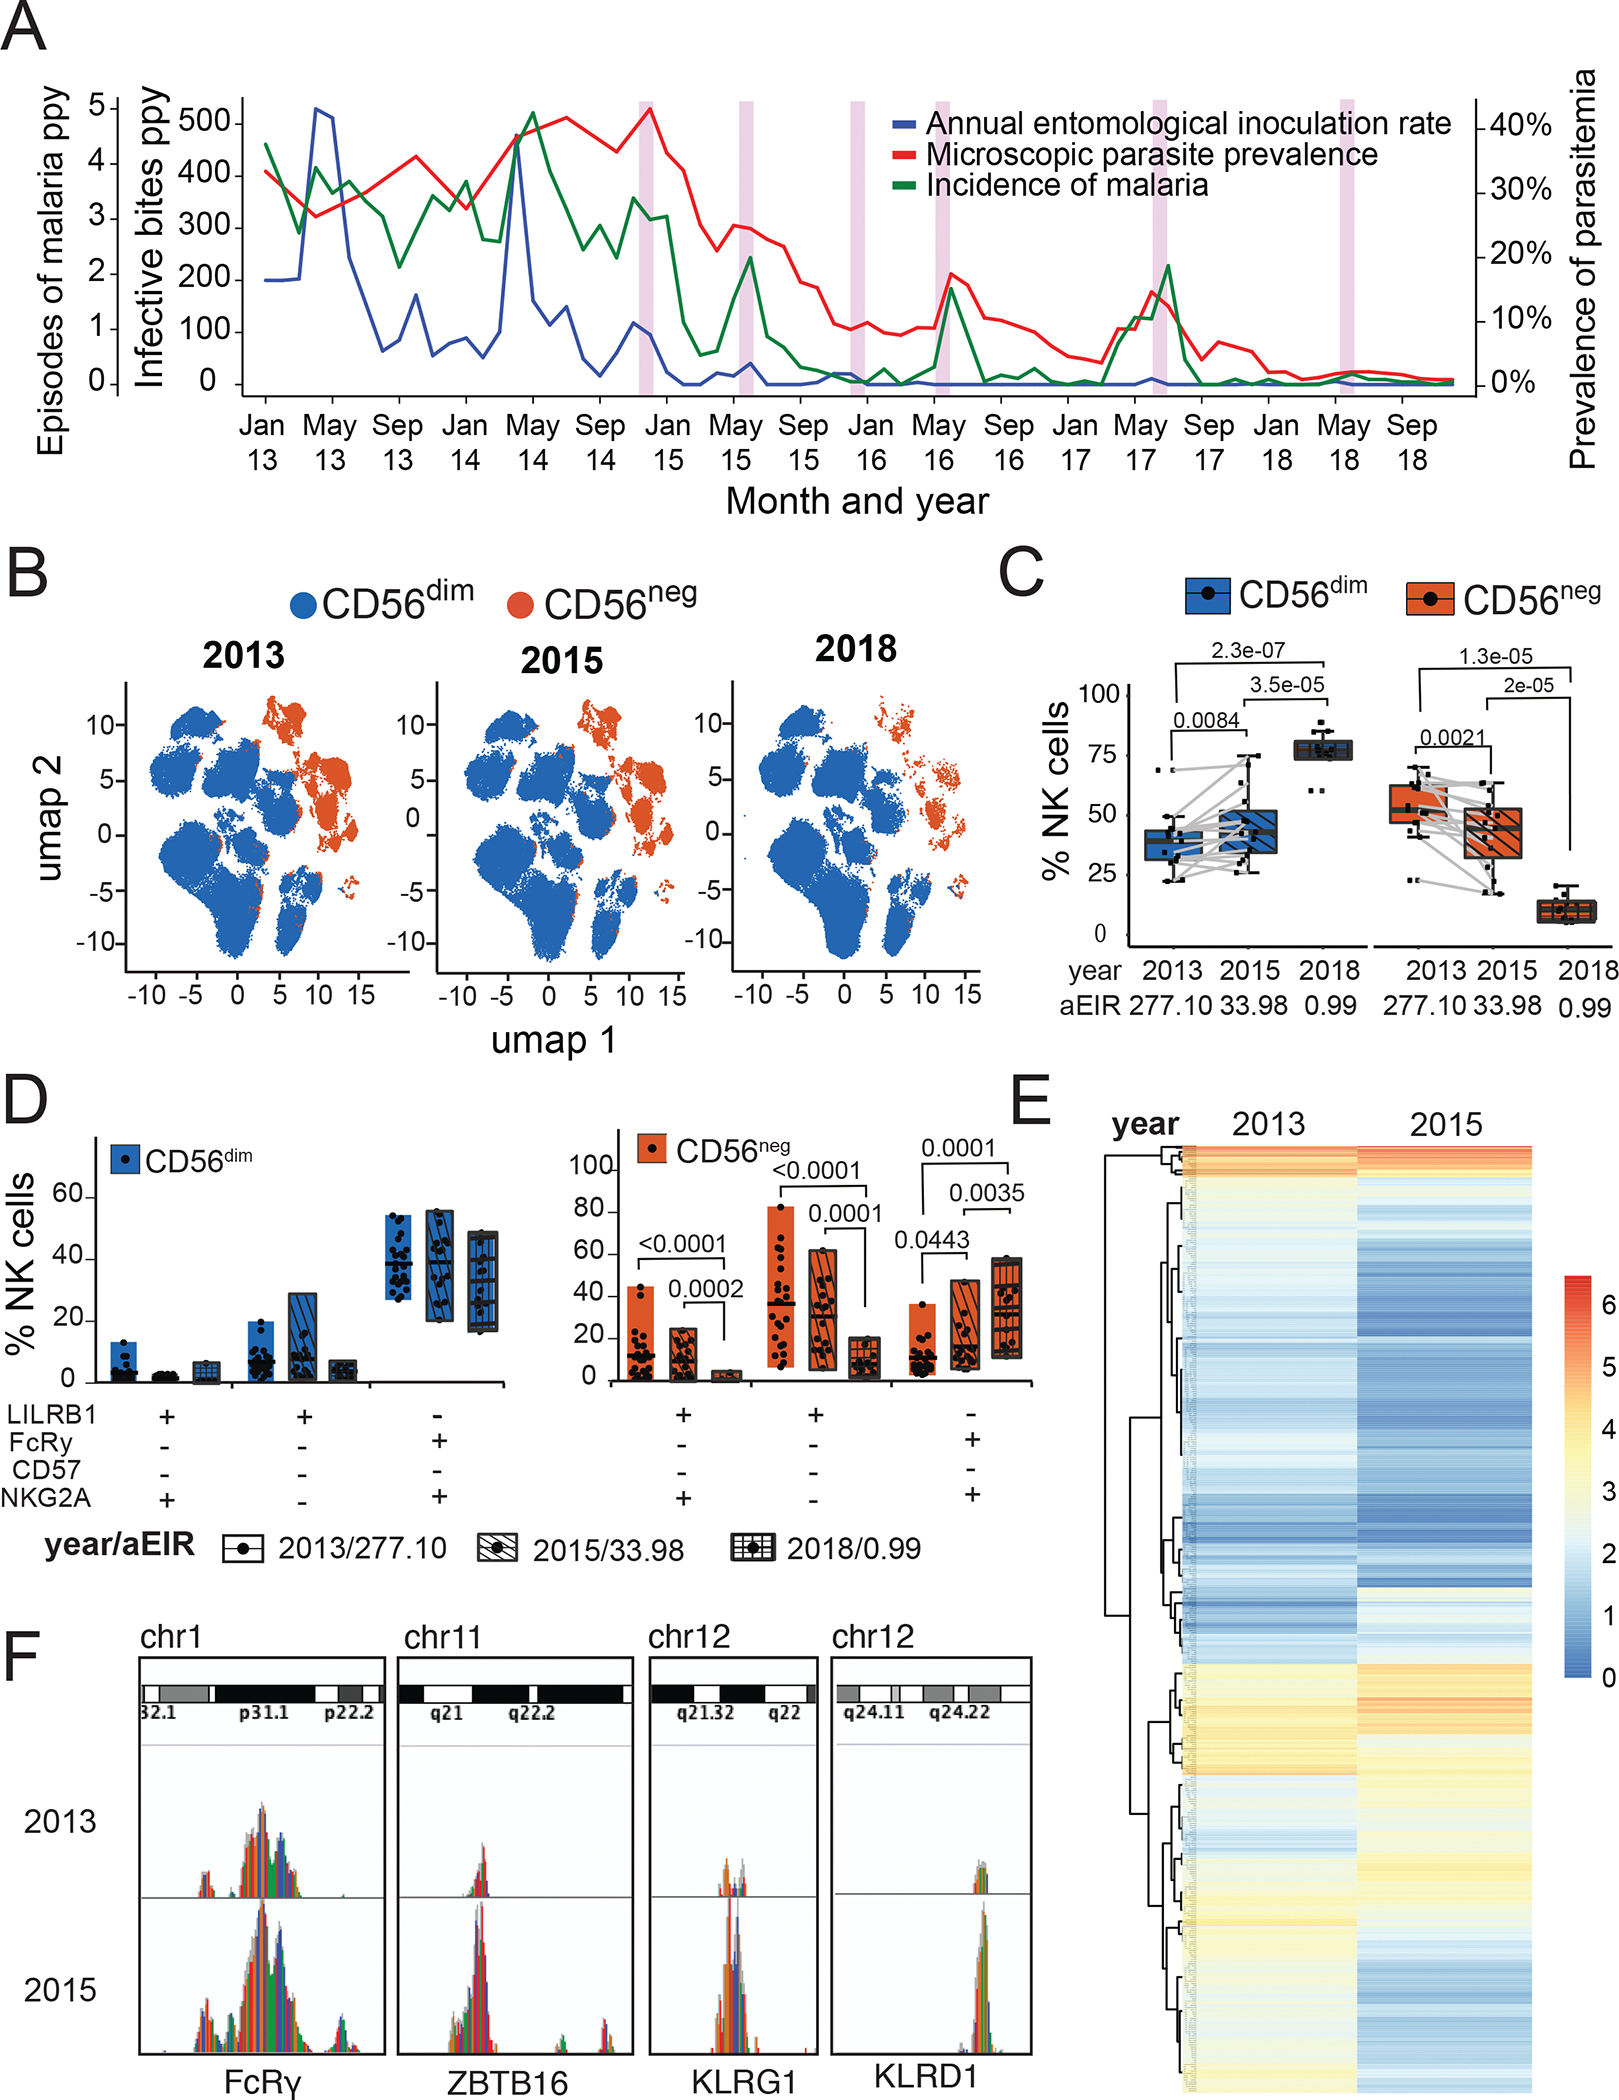
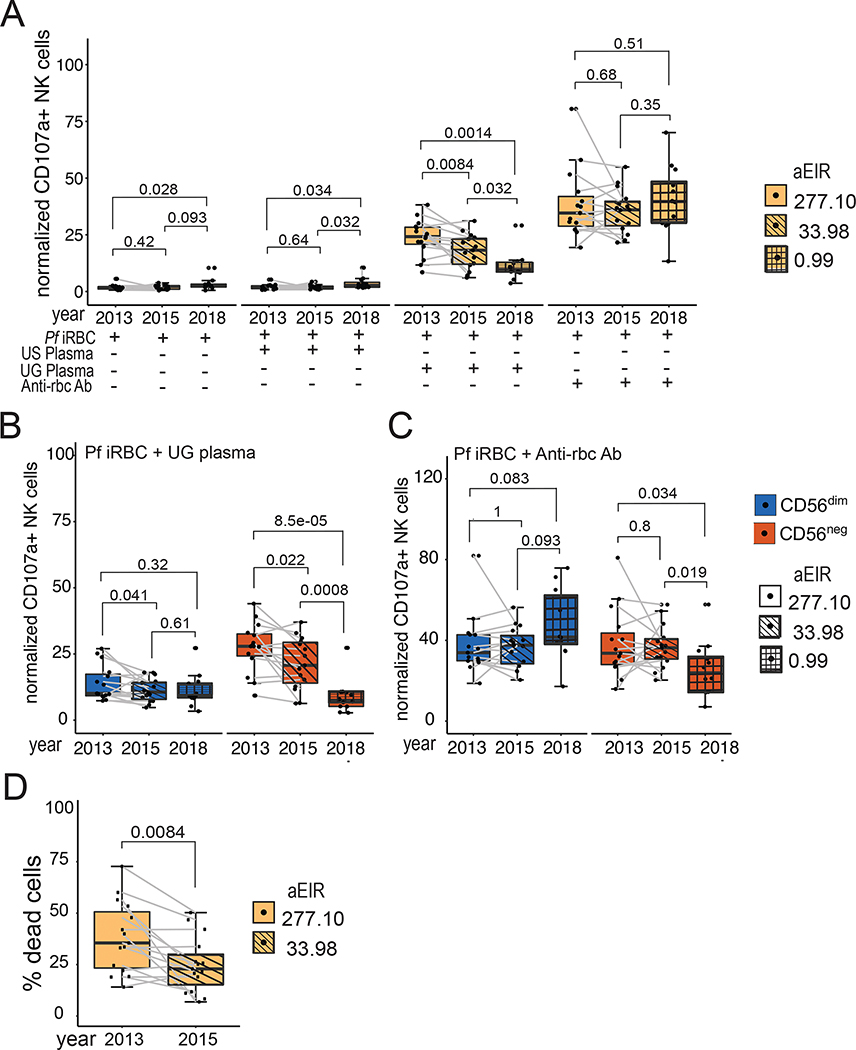
Natural killer (NK) cells likely play an important role in immunity to malaria, but the effect of repeated malaria on NK cell responses remains unclear. Here, we comprehensively profiled the NK cell response in a cohort of 264 Ugandan children. Repeated malaria exposure was associated with expansion of an atypical, CD56neg population of NK cells that differed transcriptionally, epigenetically, and phenotypically from CD56dim NK cells, including decreased expression of PLZF and the Fc receptor γ-chain, increased histone methylation, and increased protein expression of LAG-3, KIR, and LILRB1. CD56neg NK cells were highly functional and displayed greater antibody-dependent cellular cytotoxicity than CD56dim NK cells. Higher frequencies of CD56neg NK cells were associated with protection against symptomatic malaria and high parasite densities. After marked reductions in malaria transmission, frequencies of these cells rapidly declined, suggesting that continuous exposure to Plasmodium falciparum is required to maintain this modified, adaptive-like NK cell subset.


Conflict of interest statement

Competing interests: Authors declare that they have no competing interests.

Figures

Figure 1:
Figure 1:. Ugandan children living in high transmission settings have high frequencies of atypical CD56neg NK cells.
(A) Representative flow cytometry plots of CD3 CD14 CD19 CD7+ NK cells from three children, as defined by CD56 and CD16 (Fig S1 for full gating). (B) Percentages of CD56dim and CD56neg NK cells from children ages 3–7 years in Tororo (n=35) and Jinja (n=10). Household annual Entomological Inoculation Rate (aEIR) is an estimate of the number of infective bites received in the year prior to sampling across each cohort, as measured via CDC light traps (see methods). (C) Correlation between CD56neg NK cells and measured household aEIR among children assayed in (B). (D) Correlation between NK cell frequencies and age among 242 Tororo children ages 0.6 to 11 years. P-values shown above box plots are calculated using Wilcoxon signed rank test, while the rho (ρ) and p-values associated with the scatterplots are calculated using Spearman’s correlation. Shaded areas represent 95% confidence interval of best fit regression line. All samples were collected in 2013, see Table S1 and S2 for patient characteristics.
Figure 2:
Figure 2:. Single-cell RNA Sequencing of NK cells reveal transcriptional similarities and differences between CD56dim and CD56neg NK cells.
(A) Gene transcripts of n=60381 PBMCs were clustered using Leiden algorithm and visualized in two dimensions with UMAP. (B) Gating of NK cell subsets as defined by surface marker expression of CD16 (x-axis) and CD56 (y-axis). (C) NK cells subsets classified by (B) superimposed with UMAP gene transcript data. CD56dim transcripts are in blue, CD56neg in red, CD56bright in green and non-NK cell transcripts are in grey. (D) Heatmap showing top 50 genes differentially expressed by CD56dim and CD56neg NK cells. (E) Representative violin plots comparing gene transcripts between CD56dim and CD56neg NK cells. P values obtained from likelihood ratio tests as implemented in the Seurat R package. Samples are from 10 individuals, see table S3 for patient characteristics.
Figure 3:
Figure 3:. Cellular phenotyping reveals CD56neg NK cells to have a mature phenotype.
NK cells were gated for LILRB1, FcRγ, NKG2A, CD57 and NKG2C. (A) Frequencies of cells are shown in violin plots. (B) Proportions of cells expressing all four possible marker combinations are shown in dot plots. (C & D) Percentages of NK cells expressing KIRs, granulysin and LAG3. (E) Heatmap comparing distinct histone modifications between CD56dim and CD56neg NK cells as measured by EpiTOF from 36 participant samples. P-values shown above violin and dot plots are calculated using Wilcoxon matched-pairs signed rank test. See Table S4 for number of samples and patient characteristics, Fig S1 and S3 for gating strategies, and Data File S2 for raw data.
Figure 4:
Figure 4:. CD56neg NK cells have an enhanced ability for antibody-dependent cellular cytotoxicity.
(A) PBMCs were stimulated with iRBCs or cytokines: IL-12 (2ng/ml), IL-15 (10ng/ml) and IL-18 (0.25ug/ml) for 4 hours, after which intracellular IFNγ was measured. (B & C) PBMCs were stimulated with either irbcs alone or opsonized with serum in a ratio of 2 PBMCs to 1 iRBC. (B) IFNγ was measured intracellularly. (C) NK cell degranulation was measured by CD107a expression. (D) Isolated NK cells were stimulated with iRBCs opsonized by either US or Ugandan serum and degranulation measured. (E) Heatplot showing percentages of NK cells expressing cell surface markers degranulating in response to iRBCs opsonized by Ugandan serum. (F) Association between frequencies of CD56neg NK cells and percentage of dead opsonized p815 cells. (G) Isolated NK cells and NK-Depleted PBMCs were stimulated with opsonized p815, after which the percentage of dead cells was measured by 7-AAD staining. P-values for box plots are calculated using Wilcoxon matched-pairs signed rank test, and rho (ρ) and p-value associated with the scatterplot is calculated using Spearman’s correlation. See Table S4 for patient characteristics, and Data File S2 for raw data.
Figure 5:
Figure 5:. CD56neg NK cells are associated with clinical malaria protection.
Associations between CD56dim and CD56neg percentages and (A) geometric mean parasite densities in the subsequent year. Rho (ρ) and p-values associated with the scatterplot are calculated using Spearman’s correlation. Shaded areas represent 95% confidence interval of best fit regression line. (B) Associations between CD56dim and CD56neg percentages and probability of symptoms given Pf parasitemia in the subsequent year (see Fig S5 for smoothed relationships). Multilevel mixed effects linear models used to calculate odds of symptoms given microscopic Pf infection (B). Multivariate models adjusted for age and aEIR, and account for clustering by individual and household. Categories represent tertiles of NK response (n=80,81,81 per tertile). aOR: adjusted odds ratio. See Table S2 for patient characteristics.
Figure 6:
Figure 6:. Decline of CD56neg NK cells following reductions in malaria transmission.
(A) Measures of malaria burden in Tororo from 2013 to 2018: Annual entomological inoculation rate (aEIR, blue, middle y-axis), malaria incidence (green, left y-axis), and parasitemia (red, right y-axis). Pink bars show rounds of indoor residual spraying with insecticides. (B) Unsupervised clustering of CD56dim (blue) and CD56neg (red) NK cells within individuals sampled in 2013 and 2015 (paired) and 2018 (unpaired, age-matched), visualized by UMAP projections. (C) Percentages of CD56dim and CD56neg NK cells over time as aEIR decreases. (D) Proportion of CD56dim (blue) and CD56neg (red) NK cells expressing all possible marker combinations of CD85j, FcRγ, NKG2A and CD57 plotted over time as aEIR decreases. Clear box indicates 2013, diagonal lined box indicates 2015, and hatched box indicates 2018. (E) ATAC-Seq heatmap showing differential accessibility of genes from FACS-sorted CD3CD14CD19CD7+ NK cells obtained from a Tororo child sampled in 2013 and 2015 (F) ATAC-Seq genome tracks showing chromatin accessibility (peaks) at the FcRy, ZBTB16, KLRG1 and KLRD1 loci for 2013 and 2015 paired samples. P-values for box plots are calculated using Wilcoxon matched-pairs signed rank test. See Table S5 for patient characteristics, and Data File S2 for raw data.
Figure 7:
Figure 7:. Reduction of ADCC by CD56neg NK cells following decline of malaria transmission.
(A) PBMCs were stimulated either with iRBCs alone or opsonized with serum. Degranulation was measured through the different years with decreasing aEIR. (B & C) PBMCs stimulated with iRBCs opsonized with Ugandan serum analyzed by NK cell subset. Degranulation by (B) CD56dim and (C) CD56neg NK cells was measured over time. (D) Killing of opsonized p815 cells by PBMCs collected from 2013 and 2015. Clear box indicates 2013 with an aEIR of 258.3, diagonal lined box indicates 2015 with an EIR of 25.8 and hatched box indicates 2018 with an aEIR of 0.43. P-values for box plots are calculated using Wilcoxon matched-pairs signed rank test. See Table S5 for number of samples and patient characteristics, and Data File S2 for raw data.

References

    1. “World malaria report 2021,” (World Health Organization, Geneva, Switzerland, 2021).
    1. Rodriguez-Barraquer I, Arinaitwe E, Jagannathan P, Kamya MR, Rosenthal PJ, Rek J, Dorsey G, Nankabirwa J, Staedke SG, Kilama M, Drakeley C, Ssewanyana I, Smith DL, Greenhouse B, Quantification of anti-parasite and anti-disease immunity to malaria as a function of age and exposure. Elife 7, (2018). - PMC - PubMed
    1. Langhorne J, Ndungu FM, Sponaas AM, Marsh K, Immunity to malaria: more questions than answers. Nat Immunol 9, 725–732 (2008). - PubMed
    1. Tan J, Piccoli L, Lanzavecchia A, The Antibody Response to Plasmodium falciparum: Cues for Vaccine Design and the Discovery of Receptor-Based Antibodies. Annu Rev Immunol, (2018). - PubMed
    1. Osier FH, Feng G, Boyle MJ, Langer C, Zhou J, Richards JS, McCallum FJ, Reiling L, Jaworowski A, Anders RF, Marsh K, Beeson JG, Opsonic phagocytosis of Plasmodium falciparum merozoites: mechanism in human immunity and a correlate of protection against malaria. BMC Med 12, 108 (2014). - PMC - PubMed

Publication types