. 2023 Jan 25;15(680):eabp9952.
doi: 10.1126/scitranslmed.abp9952. Epub 2023 Jan 25.

SGLT2 inhibitor ameliorates endothelial dysfunction associated with the common ALDH2 alcohol flushing variant

Affiliations

SGLT2 inhibitor ameliorates endothelial dysfunction associated with the common ALDH2 alcohol flushing variant

Hongchao Guo et al. Sci Transl Med. .

Abstract

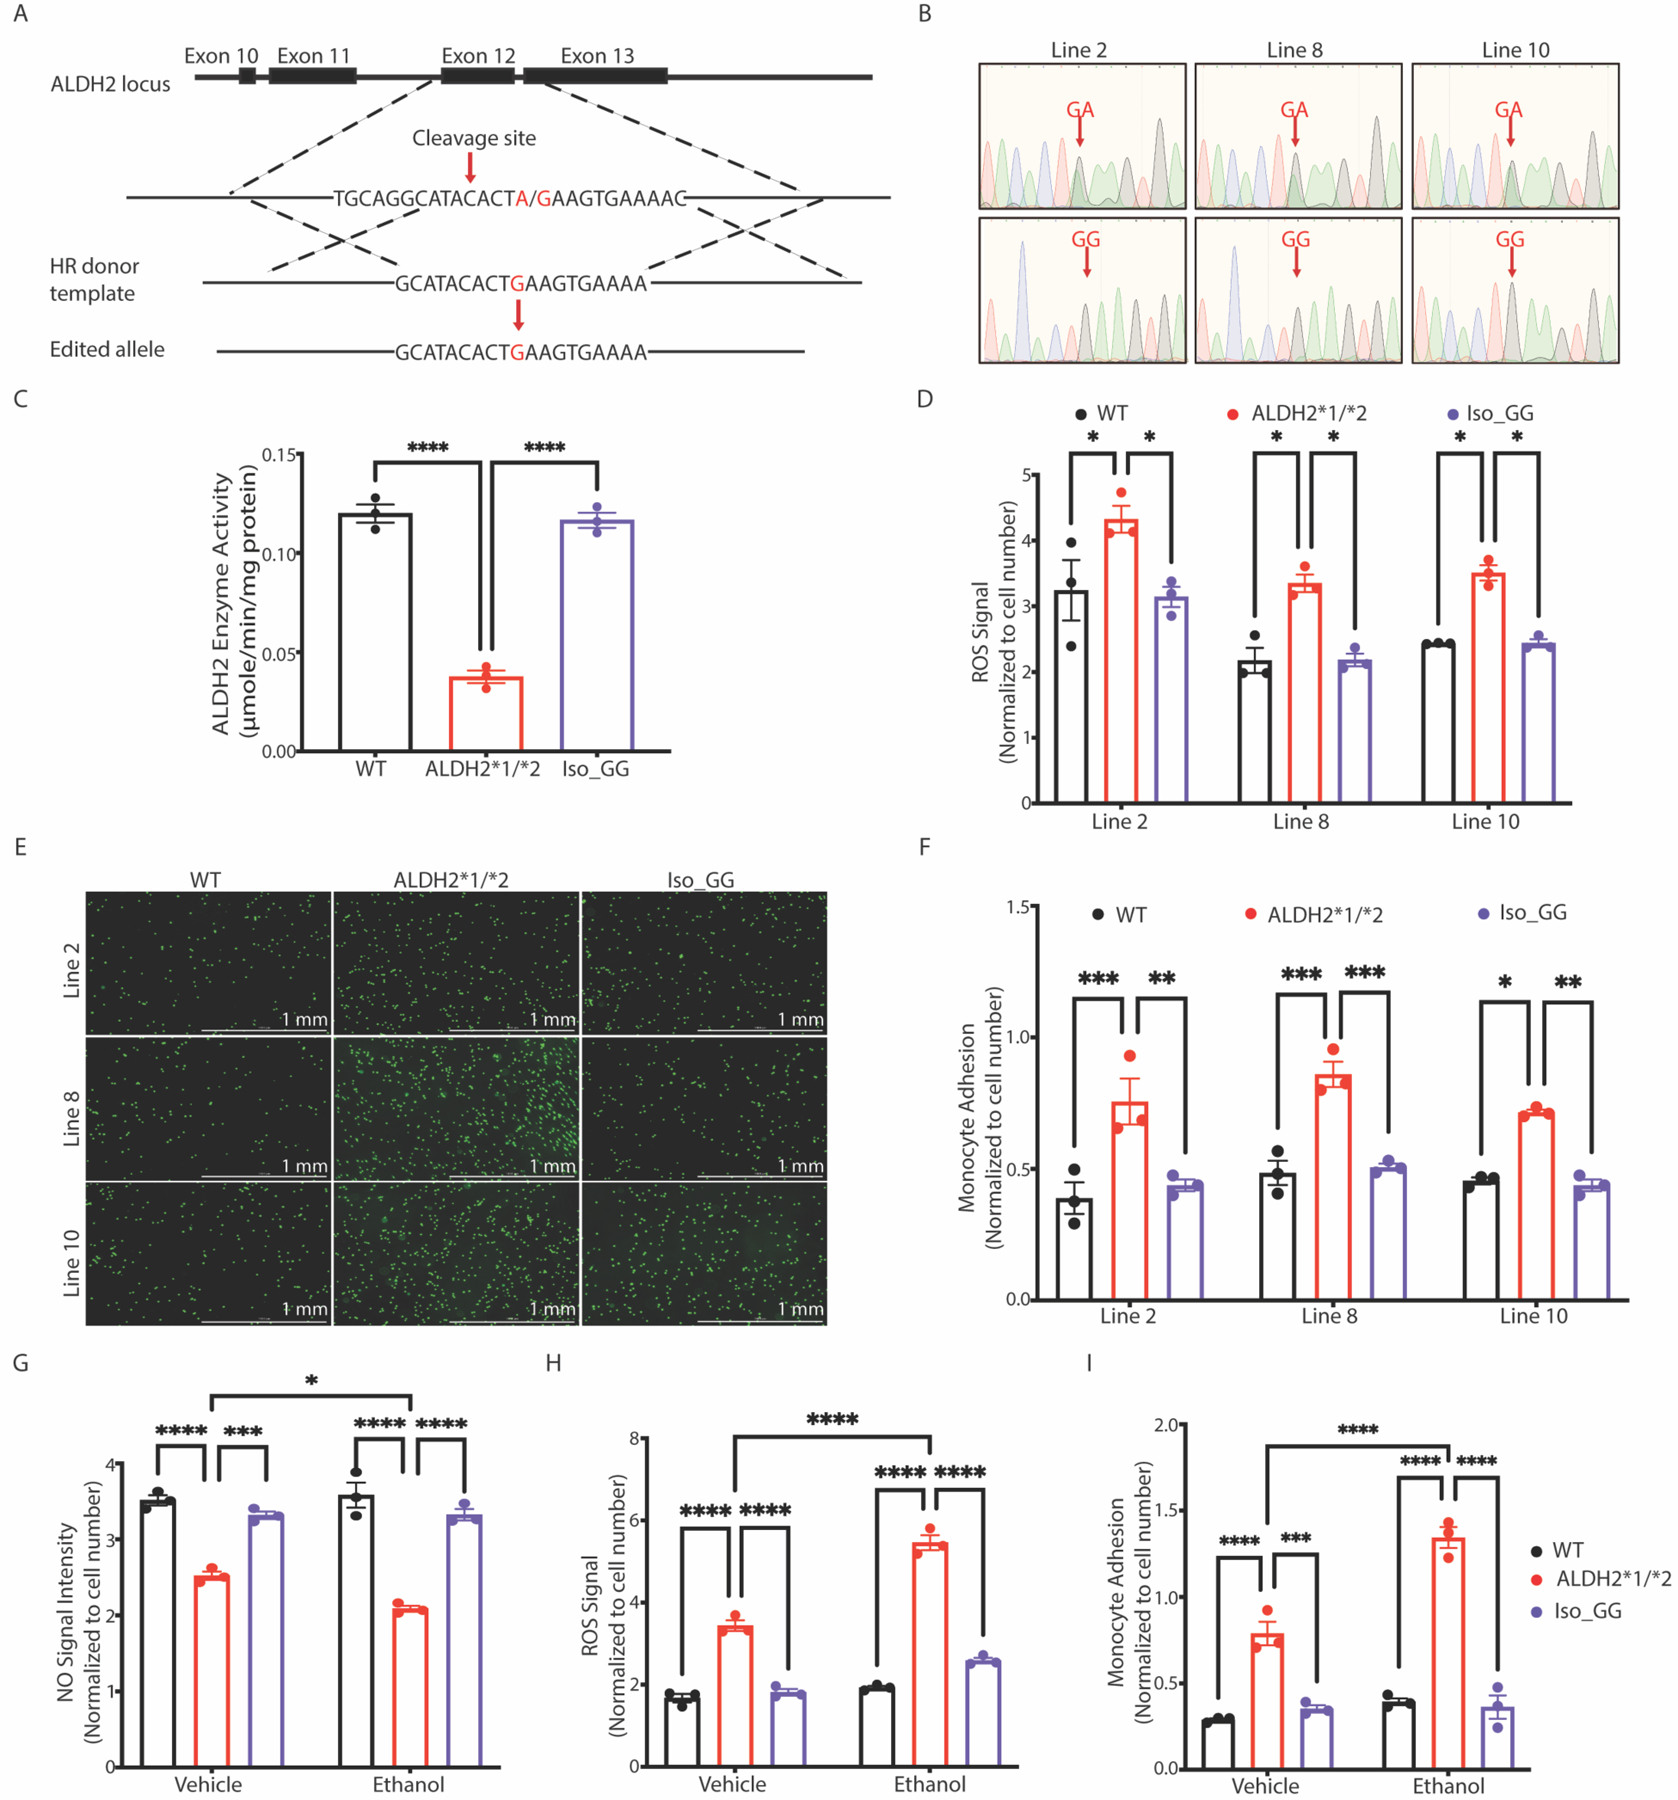
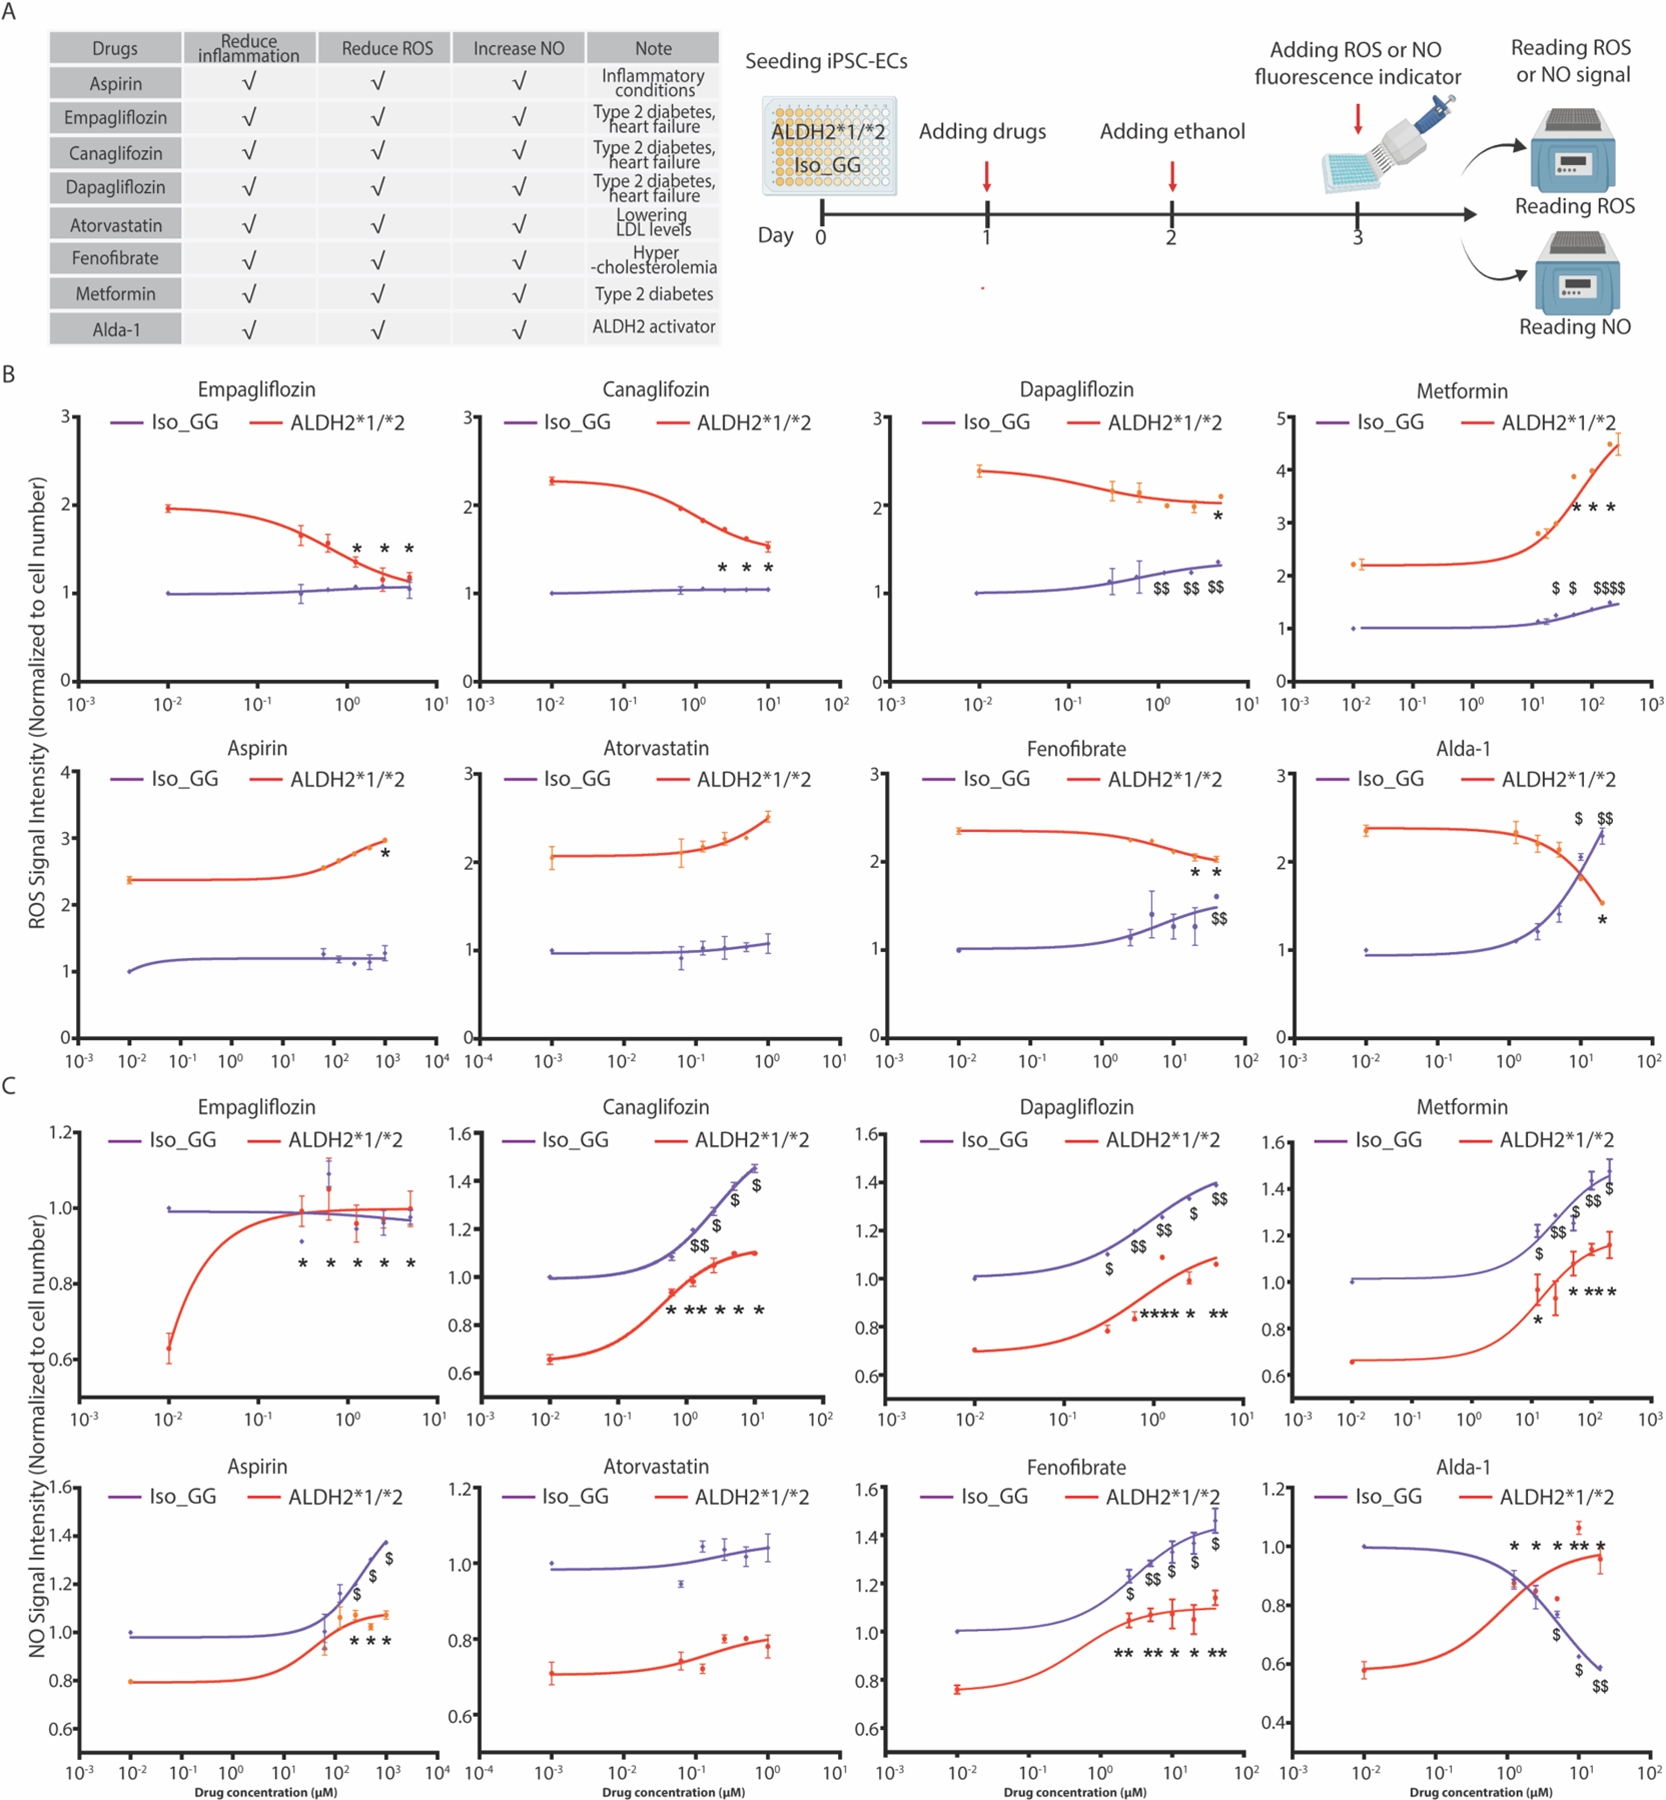
The common aldehyde dehydrogenase 2 (ALDH2) alcohol flushing variant known as ALDH2*2 affects ∼8% of the world's population. Even in heterozygous carriers, this missense variant leads to a severe loss of ALDH2 enzymatic activity and has been linked to an increased risk of coronary artery disease (CAD). Endothelial cell (EC) dysfunction plays a determining role in all stages of CAD pathogenesis, including early-onset CAD. However, the contribution of ALDH2*2 to EC dysfunction and its relation to CAD are not fully understood. In a large genome-wide association study (GWAS) from Biobank Japan, ALDH2*2 was found to be one of the strongest single-nucleotide polymorphisms associated with CAD. Clinical assessment of endothelial function showed that human participants carrying ALDH2*2 exhibited impaired vasodilation after light alcohol drinking. Using human induced pluripotent stem cell-derived ECs (iPSC-ECs) and CRISPR-Cas9-corrected ALDH2*2 iPSC-ECs, we modeled ALDH2*2-induced EC dysfunction in vitro, demonstrating an increase in oxidative stress and inflammatory markers and a decrease in nitric oxide (NO) production and tube formation capacity, which was further exacerbated by ethanol exposure. We subsequently found that sodium-glucose cotransporter 2 inhibitors (SGLT2i) such as empagliflozin mitigated ALDH2*2-associated EC dysfunction. Studies in ALDH2*2 knock-in mice further demonstrated that empagliflozin attenuated ALDH2*2-mediated vascular dysfunction in vivo. Mechanistically, empagliflozin inhibited Na+/H+-exchanger 1 (NHE-1) and activated AKT kinase and endothelial NO synthase (eNOS) pathways to ameliorate ALDH2*2-induced EC dysfunction. Together, our results suggest that ALDH2*2 induces EC dysfunction and that SGLT2i may potentially be used as a preventative measure against CAD for ALDH2*2 carriers.


Conflict of interest statement

Competing interests: D.M.-R and C.H.C. hold patents related to Alda-1 activation of ALDH2. One of the patents is licensed to Foresee Pharmaceuticals, a company at which D. M.-R. is a consultant. J.C.W. is a co-founder of Greenstone Biosciences. M.C. is a consultant for Greenstone Biosciences.

Figures

Figure 1.
Figure 1.. ALDH2*2 is strongly associated with coronary artery disease (CAD) and induces endothelial dysfunction.
(A) Manhattan plot of GWAS on CAD using the Biobank Japan cohort. CAD cases, n = 29,319; healthy control, n = 183,134. The different colors of each block are used to distinguish data from each chromosome. The X-axis indicates each chromosome number (all autosomal), and the Y-axis shows the −log10 (p-value) of risk loci. The dotted line defines the significance threshold of P = 5 × 10⁻⁸. The strongest genetic loci associated with CAD are labeled in the plot. (B–C) Line plots show the individual changes of heart rate (B) and reactive hyperemia index (C) before and after drinking alcohol in human participants with WT (Black color) or ALDH2*1/*2 (red color) alleles. All data are represented as mean ± SEM, n = 9 (WT), n = 9 (ALDH2*1/*2); “after” data compared to the “before” data, *P < 0.05, ****P < 0.0001. Statistical analyses for B-C were performed using a paired Student’s t-test.
Figure 2.
Figure 2.. ALDH2*2 iPSC-ECs show increased oxidative stress and monocyte adhesion and decreased NO production at baseline.
(A) Representative brightfield and immunofluorescence images of WT and ALDH2*1/*2 iPSC-ECs for endothelial marker CD31 (green). Scale bar: 100 μm. (B) Representative fluorescence-activated cell sorting (FACS) analysis of WT and ALDH2*1/*2 iPSC-ECs at passage 1 with CD31 antibody. (C) Representative immunoblot for ALDH2 in WT and ALDH2*1/*2 iPSC-ECs. GAPDH was used as loading control. (D) Bar graph shows quantification of ALDH2 protein by immunoblot in WT and ALDH2*1/*2 iPSC-ECs. Data are represented as relative fold-change to loading control, GAPDH. (E) Enzymatic activity of ALDH2 in lysates from WT and ALDH2*1/*2 iPSC-ECs. HUVEC were used as a positive control. WT vs ALDH2*1/*2: ****P < 0.0001; HUVEC vs ALDH2*1/*2: $ $ $ $P < 0.0001. (F) 4-hydroxynonenal (4-HNE) adducts in WT and ALDH2*1/*2 iPSC-ECs were assessed by Western blot with GAPDH as loading control. (G) Quantification of 4-HNE Western blot analysis from two replicate experiments. (H) Total baseline reactive oxygen species (ROS) in WT and ALDH2*1/*2 iPSC-ECs as measured by the fluorogenic dye, CM-H2DCFDA. (I) Quantification of NO production in WT and ALDH2*1/*2 iPSC-ECs using the fluorogenic dye, DAF-FM. (J) Representative images of adherent THP-1 monocytes labeled with Calcein AM (green) in WT and ALDH2*1/*2 iPSC-ECs. (K) Quantification of monocyte adhesion in WT and ALDH2*1/*2 iPSC-ECs. Black bar: WT iPSC-ECs; Red bar: ALDH2*1/*2 iPSC-ECs. All data represent five individual iPSC lines from two technical replicates per group. Data are expressed as mean ± SEM. *P < 0.05, calculated by Student’s t-test (Fig. 2. E, H, I, J and L) or two-way ANOVA with Bonferroni correction (Fig. 2E).
Figure 3.
Figure 3.. Ethanol exacerbates ALDH2*2-induced endothelial dysfunction.
(A) Measurement of cellular ROS released from WT and ALDH2*1/*2 iPSC-ECs using the fluorogenic dye, CM-H2DCFDA, in the presence or absence of 5 mM ethanol. (B) Nitric oxide (NO) production in WT and ALDH2*1/*2 iPSC-ECs using the fluorogenic dye, DAF-FM, in the presence or absence of 5mM ethanol. (C) Representative images of adherent THP-1 monocytes labeled with Calcein AM (green) to WT and ALDH2*1/*2 iPSC-ECs in the presence or absence of 5 mM ethanol. Scale bar: 1mm. (D) Quantification of monocyte adhesion in WT and ALDH2*1/*2 iPSC-ECs in the presence or absence of 5 mM ethanol. (E) Representative brightfield images of capillary-like networks formed by WT and ALDH2*1/*2 iPSC-ECs in the presence or absence of 5 mM ethanol. Scale bar: 1mm. (F) Quantitative data from the tube-formation assay in WT and ALDH2*1/*2 iPSc-ECs in the presence or absence of 5 mM ethanol. Black bar: WT iPSC-ECs; Red bar: ALDH2*1/*2 iPSc-ECs. All data represent five individual iPSC lines from two technical replicates per group. Data are expressed as mean ± SEM. *P < 0.05, **P < 0.01, ***P < 0.001, ****P < 0.0001, calculated by a two-way ANOVA with Bonferroni correction.
Figure 4.
Figure 4.. Genome-corrected isogenic ALDH2 iPSc-ECs rescue EC dysfunction phenotype.
(A) CRISPR/Cas9-mediated genome modification to correct heterozygous ALDH2*1/*2 variant (GA) into isogenic WT (Iso_GG) iPSCs using homologous repair (HR). CRISPR/Cas9 was designed to specifically cleave near the nucleotide position 111803962 at exon 12 of the ALDH2 locus. The ALDH2*1/*2 allele (GA) is shown in red. (B) Sequencing chromatogram showing three Iso_GG iPSC lines generated from their respective ALDH2*1/*2 (GA) iPSC lines. The risk allele A is substituted by G after genome-editing as shown in the lower panel (indicated by red arrows). (C) Enzymatic activity of ALDH2 in lysates from WT, ALDH2*1/*2, and Iso_GG iPSC-ECs. (D) Cellular ROS in WT, ALDH2*1/*2, and Iso_GG iPSC-ECs. Cellular ROS were quantified using CM-H2DCFDA dye. (E) Representative images of adherent THP-1 monocytes (green) to WT, ALDH2*1/*2, and Iso_GG iPSC-ECs. Scale bar: 1mm. (F) Quantification of monocyte adhesion in WT, ALDH2*1/*2 and Iso_GG iPSC-ECs. (G) Nitric oxide (NO) production was determined in WT, ALDH2*1/*2, and Iso_GG iPSC-ECs using DAF-FM in the presence or absence of 5 mM ethanol. (H) Measurement of ROS in WT, ALDH2*1/*2, and Iso_GG iPSC-ECs using CM-H2DCFDA in the presence or absence of 5 mM ethanol. (I) Quantification of monocyte adhesion in WT, ALDH2*1/*2, and Iso_GG iPSC-ECs in the presence or absence of 5 mM ethanol. Black bar: WT iPSC-ECs; Blue bar: ALDH2*1/*2 iPSC-ECs; Violet bar: Iso_GG iPSC-ECs. Data in panel C to I represent two technical replicates from three individual iPSC lines. All data are expressed as means ± SEM. *P < 0.05, **P < 0.01, ***P < 0.001, ****P < 0.0001, calculated by a one-way (Fig. C, D and F) or two-way ANOVA (Fig. G-I) with Bonferroni correction.
Figure 5.
Figure 5.. Transcriptional profiling of ALDH2 iPSC-ECs implicates AKT/eNOS pathway in EC dysfunction.
(A) Volcano plot of differentially expressed genes (DEGs) between ALDH2*1/*2 and Iso_GG iPSC-ECs. Upregulated genes are highlighted in red and downregulated genes are shown in blue. FDR < 0.05 was set as a threshold of significance. (B) Heatmap of DEGs in oxidative stress, angiogenesis, and inflammatory pathways. Expression of representative genes is indicated on the bottom the heatmap. SFRP1: secreted frizzled-related protein 1; GSTP1: glutathione S-transferase pi 1; IL18: interleukin 18; ICAM1: intercellular adhesion molecule-1. (C) Quantitative PCR data from ALDH2*1/*2 and Iso_GG iPSC-ECs in the presence or absence of 5 mM ethanol. (D) Top 10 upregulated (red) and downregulated pathways (blue) in ALDH2*1/*2 iPSC-ECs compared to Iso_GG iPSC-ECs as determined by −log10 false discovery rate (FDR) using the KEGG pathway database. (E) Immunoblots for total AKT, p-AKT (Ser 473), total eNOS, and p-eNOS (Ser 1177) proteins in ALDH2*1/*2 and Iso_GG iPSC-ECs in the presence or absence of 5 mM ethanol. GAPDH was used as loading control. (F) Bar graph shows quantification of p-AKT/AKT ratio, p-eNOS/eNOS ratio in WT and ALDH2*1/*2 iPSC-ECs in the presence or absence of 5 mM ethanol. (G) Measurement of ROS and NO in ethanol-treated WT and ALDH2*1/*2 iPSC-ECs in the presence or absence of 4 μg/ml AKT activator, SC79. Vehicle: equal volume of EC medium. Black bar: WT iPSC-ECs; Red bar: ALDH2*1/*2 iPSC-ECs; Violet bar: Iso_GG iPSC-ECs. Data in panel C, F and G represent two independent technical replicates from three individual iPSC lines. All data are expressed as means ± SEM. *P < 0.05, **P < 0.01, ***P < 0.001, ****P < 0.0001, calculated by a two-way ANOVA with Bonferroni correction.
Figure 6.
Figure 6.. Drug screening for treatment of ALDH2*2-induced oxidative stress and NO impairment using iPSC-ECs.
(A) Table listing the eight compounds assessed and their current uses, including known effects on inflammation, ROS and NO (left panel). These include seven medications approved by the Food and Drug Administration (FDA) and the ALDH2 activator Alda-1. Schematic workflow of the experimental design (right panel). These drugs were assessed for their impact on ROS and NO production in Iso_GG and ALDH2*1/*2 iPSC-ECs. iPSC-ECs were treated at day one. 5mM ethanol was added the following day, and then NO and ROS signals were measured at day 3. (B–C) Dose-response curves based on ROS generation, indicated by CM-H2DCFDA (B), and NO production indicated by DAF-FM (C) in WT and ALDH2*1/*2 iPSC-ECs with drug treatment. Six different dosages were used for each drug, including a vehicle control (DMSO). Due to a wide range of drug dosage used in WT and ALDH2*2 iPSC-ECs, the power of 10 format was used on the X-axis to plot drug response. 0.01 μM (10−2 μM) instead of 0 μM was used to indicate response to vehicle control (DMSO) and the concentrations of NO or ROS in Iso_GG or ALDH2*1/*2 iPSC-ECs were normalized to vehicle (DMSO) treatment. Data in panel B and C represent three individual iPSC lines from two technical replicates for each group. Data were expressed as mean ± SEM. Non-linear regression model was applied to plot drug dose-response. Iso_GG iPSC-ECs with drug treatment compared to Iso_GG with vehicle (DMSO) treatment: $P < 0.05, $ $P < 0.01, $ $ $P < 0.001, $ $ $ $P < 0.0001. ALDH2*1/*2 iPSC-ECs with drug treatment compared to ALDH2*1/*2 with vehicle (DMSO) treatment: *P < 0.05, **P < 0.01, ***P < 0.001, ****P < 0.0001, calculated by Student’s t-test.
Figure 7.
Figure 7.. Empagliflozin alleviates vascular dysfunction in ALDH2*1/*2 heterozygous mice.
(A) Schematic of the experimental design to examine the effects of empagliflozin on vascular function in ethanol-treated ALDH2*1/*2 mice. Mice were divided into 4 groups: saline-injected WT mice, saline-injected ALDH2*1/*2 (Vehicle group), ethanol- and solvent (PEG/DMSO) control-treated ALDH2*1/*2 (EtOH group), and ethanol- and Empa-treated ALDH2*1/*2 mice (Empa group). (B) Representative brightfield images of Masson’s trichome staining of mouse aortas from the 4 experimental groups above. (C–D) Quantification of aortic area and wall thickness. *P < 0.05, **P < 0.01, ****P < 0.0001, calculated by a one-way ANOVA with Bonferroni correction. (E–F) Concentration-response curve for acetylcholine-induced aortic relaxation (E) and ET-1-induced aortic contraction (F) in WT, Vehicle, EtOH, and Empa groups. Data represent six mice for each group. Data are expressed as mean ± SEM. In Fig. 7E and F, Vehicle vs WT group: #P < 0.05, ##P < 0.01; EtOH vs Vehicle group: $P < 0.05, $ $P < 0.01; EtOH vs Empa group: *P < 0.05, **P < 0.01, calculated by Student’s t-test.
Figure 8.
Figure 8.. Empagliflozin improves ALDH2*2-related endothelial dysfunction through NHE-1/AKT/eNOS pathway.
(A–B) Bar graphs show quantification of NHE-1 activity (A) and intracellular Na+ (B) in Iso_GG and ALDH2*1/*2 iPSC-ECs in the presence or absence of Empa (5 μM), Car (10 μM), or Car (10 μM) plus Empa (5 μM) (Car + Empa). DMSO served as vehicle. (C) In silico induced-fit docking showing Empa (magenta) bound to NHE-1 with a similar binding site to Car (orange). (D–E) Cellular NO (D) and ROS (E) in Iso_GG and ALDH2*1/*2 iPSC-ECs in the presence or absence of 5 μM Empa, 10 μM Car, or Car + Empa. (F) Representative immunoblots show total AKT, p-AKT, total eNOS, and p-eNOS proteins in Iso_GG and ALDH2*1/*2 iPSC-ECs in the presence or absence of 5 μM Empa, 10 μM Car, or Car + Empa. DMSO was used as vehicle. GAPDH was used as loading control. (G–H) Bar graphs show quantification of p-AKT to total AKT ratios (G) and p-eNOS to total eNOS ratios (H) in Iso_GG and ALDH2*1/*2 iPSC-ECs in the presence or absence of Empa (5μM), Car (5mM), or Car + Empa. Data represent three individual iPSC lines from two technical replicates. Data are expressed as mean ± SEM. *P < 0.05, **P < 0.01, ***P < 0.001, ****P < 0.0001, calculated by one-way ANOVA with Bonferroni correction.

References

    1. Khan MA, Hashim MJ, Mustafa H, Baniyas MY, Al Suwaidi S, AlKatheeri R, Alblooshi FMK, Almatrooshi M, Alzaabi MEH, Al Darmaki RS, Lootah S, Global Epidemiology of Ischemic Heart Disease: Results from the Global Burden of Disease Study. Cureus 12, e9349 (2020). - PMC - PubMed
    1. Leopold JA, Loscalzo J, Emerging Role of Precision Medicine in Cardiovascular Disease. Circ Res 122, 1302–1315 (2018). - PMC - PubMed
    1. Talmud PJ, Gene-environment interaction and its impact on coronary heart disease risk. Nutr Metab Cardiovasc Dis 17, 148–152 (2007). - PubMed
    1. Kessler T, Schunkert H, Coronary Artery Disease Genetics Enlightened by Genome-Wide Association Studies. JACC Basic Transl Sci 6, 610–623 (2021). - PMC - PubMed
    1. Larson HN, Weiner H, Hurley TD, Disruption of the coenzyme binding site and dimer interface revealed in the crystal structure of mitochondrial aldehyde dehydrogenase “Asian” variant. J Biol Chem 280, 30550–30556 (2005). - PMC - PubMed

Publication types

Substances