. 2023 Jan 25;9(4):eadd7474.
doi: 10.1126/sciadv.add7474. Epub 2023 Jan 25.

Discovery of a polymer resistant to bacterial biofilm, swarming, and encrustation

Affiliations

Discovery of a polymer resistant to bacterial biofilm, swarming, and encrustation

Jean-Frédéric Dubern et al. Sci Adv. .

Abstract

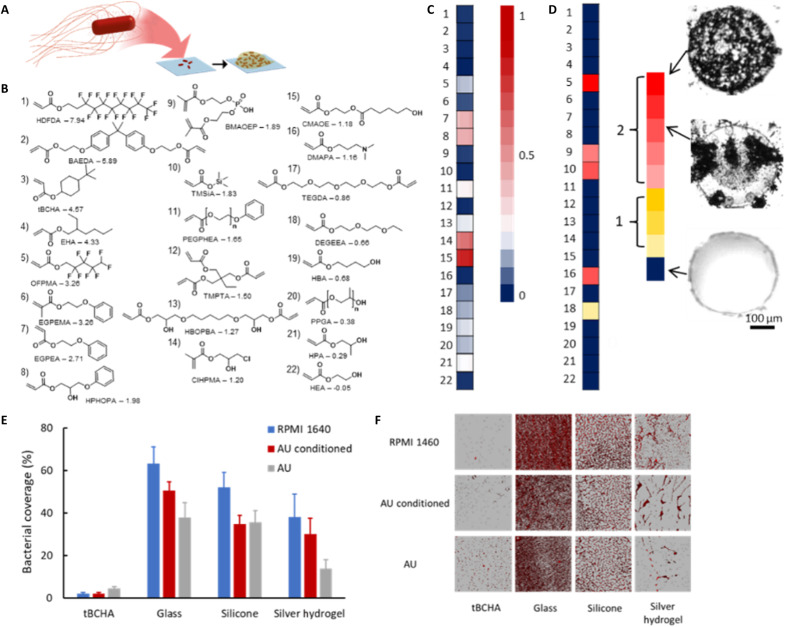
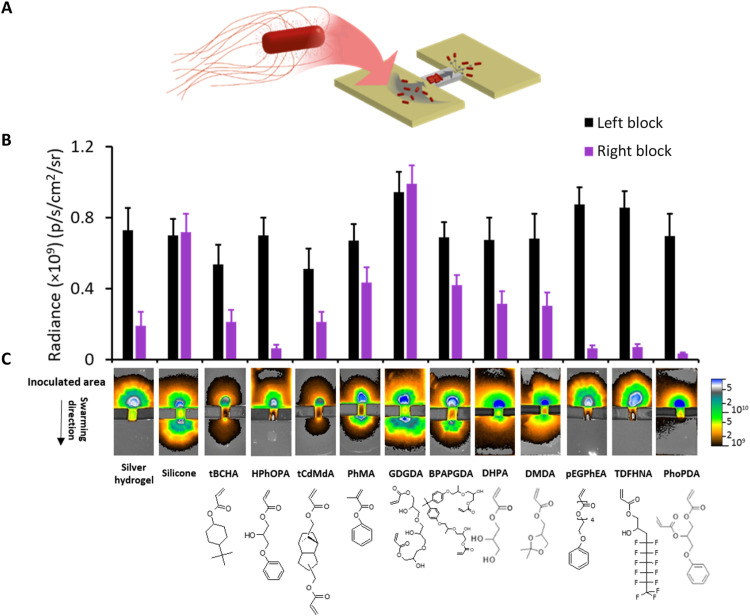
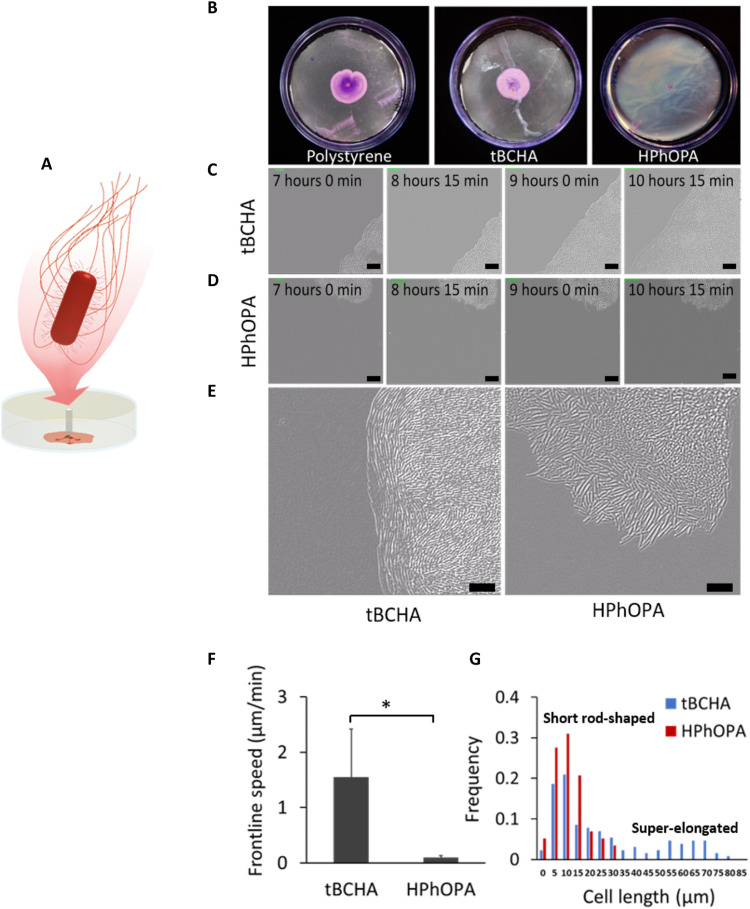
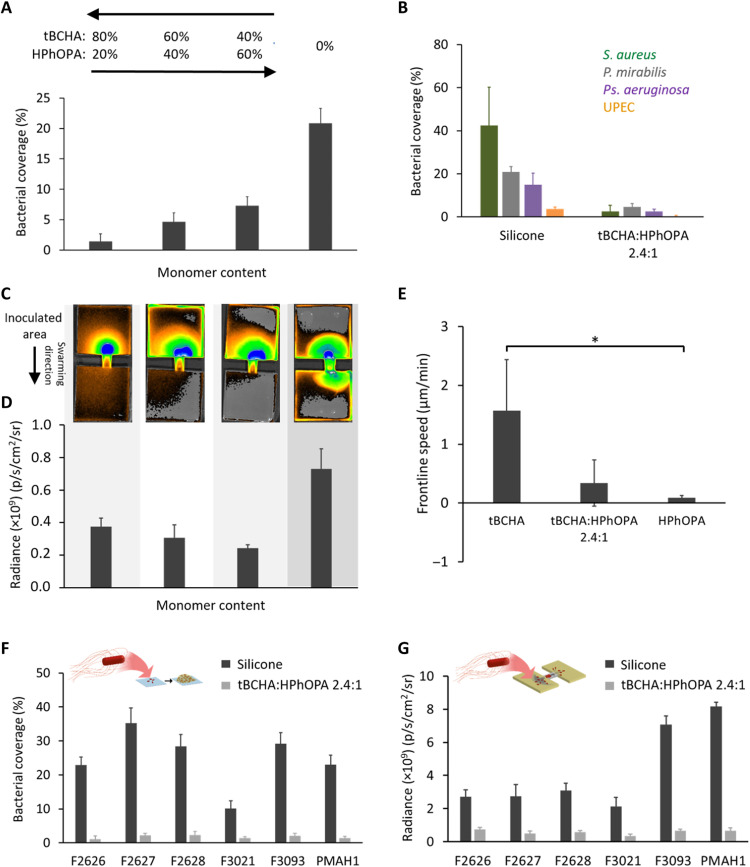
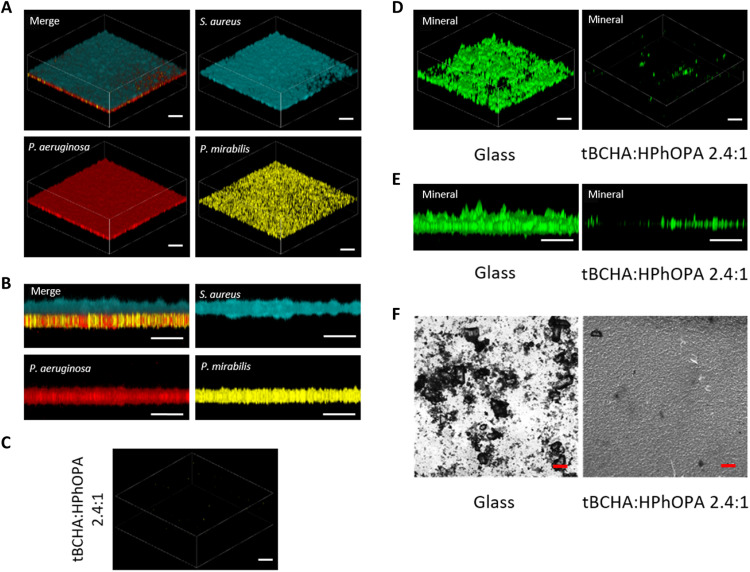
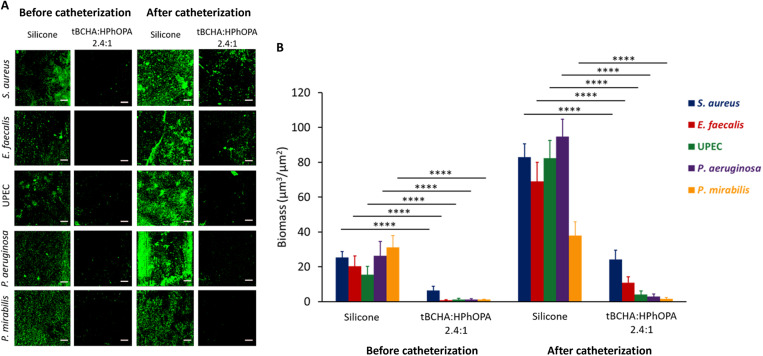
Innovative approaches to prevent catheter-associated urinary tract infections (CAUTIs) are urgently required. Here, we describe the discovery of an acrylate copolymer capable of resisting single- and multispecies bacterial biofilm formation, swarming, encrustation, and host protein deposition, which are major challenges associated with preventing CAUTIs. After screening ~400 acrylate polymers, poly(tert-butyl cyclohexyl acrylate) was selected for its biofilm- and encrustation-resistant properties. When combined with the swarming inhibitory poly(2-hydroxy-3-phenoxypropyl acrylate), the copolymer retained the bioinstructive properties of the respective homopolymers when challenged with Proteus mirabilis, Pseudomonas aeruginosa, Staphylococcus aureus, and Escherichia coli. Urinary tract catheterization causes the release of host proteins that are exploited by pathogens to colonize catheters. After preconditioning the copolymer with urine collected from patients before and after catheterization, reduced host fibrinogen deposition was observed, and resistance to diverse uropathogens was maintained. These data highlight the potential of the copolymer as a urinary catheter coating for preventing CAUTIs.


Figures

Fig. 1.
Fig. 1.. Microarray screen for acrylate copolymers resistant to Proteus biofilm formation and biomineralization.
(A) Schematic depiction of the Proteus biofilm assay. (B) Chemical structures of the monomers used with their associated clogP values and monomer acronyms (full chemical names are given in Supplementary Materials and Methods). (C) Intensity scale plot for fluorescence intensity (FPM) obtained after incubation of dsRed-tagged P. mirabilis for 72 hours with the copolymer microarray. Values are indicated by the intensity scale on the right. For each sample, the center of the associated square is colored according to the mean value (n = 3), while the left and right portions are respectively colored ± SD. (D) Biomineralization susceptibility screen. The extent of biomineralization after a 24-hour incubation in AU of each homopolymer [labels according to (B)] according to the relative scale (from 0 to 1). Bright-field images of examples of polymer spots with high and low biomineralization are shown. Each image is 400 μm × 400 μm. (E) Proteus biofilm surface coverage after a 72-hour incubation on glass, silicone-, silver hydrogel–, or tBCHA-coated silicone catheter segments in RPMI 1640 (blue), in RPMI 1640 on AU-conditioned (by incubation for 72 hours in AU) polymer coupons (red), or in AU (gray). Error bars are equal to ± 1 SD for three independent replicates. (F) Corresponding confocal microscopy images for (E) of dsRed-tagged Proteus growing on each surface. Each image is 160 μm × 160 μm.
Fig. 2.
Fig. 2.. Swarming of Proteus over polymer-coated catheter segments.
(A) Schematic depiction of the bridge swarming assay. (B) dsRed-tagged Proteus was inoculated on one side of the bridge linking two unconnected LB agar blocks and the fluorescence intensity (as radiance) on the lower agar block quantified via fluorescence imaging after incubation for 16 hours. Error bars are equal to ± 1 SD for at least three independent replicates. (C) Top: Fluorescence images of the catheter bridge assays. Bottom: Monomer structures corresponding to each fluorescence image. Monomers were tricyclodecane-dimethanol diacrylate (tCdMdA), phenyl methacrylate (PhMA), glycerol 1,3-diglycerolate diacrylate (GDGDA), bisphenol A propoxylate glycerolate diacrylate (BPAPGDA), dihydroxypropyl acrylate (DHPA), 2,2-dimethyl dioxolan-4-yl methyl acrylate (DMDA), tridecafluoro-2-hydroxynonyl acrylate (TDFHNA), and phenoxypropyl diacrylate (PhoPDA).
Fig. 3.
Fig. 3.. Swarming characteristics of P. mirabilis during migration on tBCHA and HPhOPA.
(A) Schematic depiction of the swarming migration assay. P. mirabilis was inoculated onto an uncoated or poly(tBCHA)- or poly(HPhOPA)-coated polystyrene surfaces and incubated at 37°C for 7 hours. (B) Images of crystal violet–stained bacteria swarming between agar and, from left to right, uncoated polystyrene, tBCHA-coated, or HPhOPA-coated polystyrene. (C and D) DIC microscopy time series showing images taken every 45 min from 7 hours after inoculation and for three additional time points on (C) poly(tBCHA) and (D) poly(HPhOPA). Scale bars, 20 μm. (E) Enlarged DIC image of the swarming migration front of P. mirabilis on poly(tBCHA) (left) or poly(HPhOPA) (right) showing the elongation and alignment of bacterial cells at the moving front on poly(tBCHA) and their absence on HPhOPA. (F) Frontline speed and the cell length (G) within the cell population found on the poly(tBCHA)-coated (blue) or poly(HPhOPA)-coated (red) surfaces. Error bars in (F) are equal to ± 1 SD for at least three independent replicates. *P ≤ 0.05. Significance was determined by unpaired Student t test. Scale bars, 20 μm.
Fig. 4.
Fig. 4.. Biofilm and swarming resistance of tBCHA:HPhOPA copolymers.
(A) Proteus biofilm surface coverage on the tBCHA:HPhOPA copolymer series compared with silicone (0%). (B) S. aureus SH1000 (dark green), P. mirabilis (gray), Ps. aeruginosa PAO1 (purple), and E. coli (orange) surface coverage on silicone compared with tBCHA:HPhOPA 2.4:1. (C) Fluorescence images of the Proteus catheter bridge swarming assays for the copolymer series and uncoated silicone. (D) Quantification of the corresponding fluorescence images for the lower agar block following swarming migration. (E) Frontline swarming speed of Proteus observed on coatings of tBCHA, HPhOPA, and tBCHA:HPhOPA 2.4:1. Error bars are ± 1 SD unit for at least three independent replicates. *P < 0.05. Significance was determined by one-way ANOVA analysis using Tukey’s multiple comparisons test. (F) Schematic depiction of biofilm assay and bacterial surface coverage determined for uncoated silicone or the copolymer with six dsRed-labeled P. mirabilis clinical isolates. (G) Schematic depiction of swarming assay and fluorescence determined at the surface of the lower block following swarming migration of the P. mirabilis clinical isolates across either silicone or the tBCHA:HPhOPA 2.4:1 copolymer. For experiments in (F) and (G), SD values are based on the mean value of three biological replicates.
Fig. 5.
Fig. 5.. Resistance of the tBCHA:HPhOPA 2.4:1 copolymer to mixed-species biofilm formation and biomineralization in AU.
A polymicrobial biofilm was allowed to develop on glass or on the copolymer where colonization over the first 24 hours was with gfp-tagged Proteus, followed by mCherry-tagged Ps. aeruginosa PAO1 (red) and cfp-tagged S. aureus SH1000 (blue) in a 1:1 ratio. After a further 48-hour incubation, the samples were observed via confocal microscopy. (A) Three-dimensional (3D) representation of the mixed-species biofilm on glass. (B) Transverse view of the mixed-species biofilm. (C) 3D representation showing (C) the lack of a mature biofilm on the copolymer. (D) 3D representation and (E) transverse view of biomineralization on glass and copolymer. (F) Bright-field images of biomineralization on glass and copolymer. Scale bars, 50 μm.
Fig. 6.
Fig. 6.. Biofilm formation on silicone and poly(tBCHA:HPhOPA) catheter segments by S. aureus, E. faecalis, E. coli (UPEC), Ps. aeruginosa, or P. mirabilis after preconditioning with pre- or postcatheterization patient urine (patient 3).
(A) Representative confocal fluorescence images of gfp-tagged bacteria on silicone- or copolymer-coated catheter segments conditioned with pre- and postcatheterization urine. Scale bars, 50 μm. (B) Quantification of biofilm biomass for each pathogen. Error bars are equal to ± 1 SD for at least five independent replicates.****P < 0.0001. Significance was determined by two-way ANOVA analysis using Sidak’s multiple comparisons test.

References

    1. R. O. Darouiche, Device-associated infections: A macroproblem that starts with microadherence. Clin. Infect. Dis. 33, 1567–1572 (2001). - PubMed
    1. C. S. Hollenbeak, A. L. Schilling, The attributable cost of catheter-associated urinary tract infections in the United States: A systematic review. Am. J. Infect. Control 46, 751–757 (2018). - PubMed
    1. E. C. Bursle, J. Dyer, D. F. M. Looke, D. A. J. McDougall, D. L. Paterson, E. G. Playford, Risk factors for urinary catheter associated bloodstream infection. J. Infect. 70, 585–591 (2015). - PubMed
    1. B. Foxman, The epidemiology of urinary tract infection. Nat. Rev. Urol. 7, 653–660 (2010). - PubMed
    1. C. E. Armbruster, S. N. Smith, A. O. Johnson, V. De Ornellas, K. A. Eaton, A. Yep, L. Mody, W. Wu, H. L. T. Mobley, The pathogenic potential of Proteus mirabilis is enhanced by other uropathogens during polymicrobial urinary tract infection. Infect. Immun. 85, e00808-16 (2017). - PMC - PubMed