Randomized Controlled Trial
. 2023 Jan 25;9(4):eadd2120.
doi: 10.1126/sciadv.add2120. Epub 2023 Jan 25.

Bacteroides uniformis and its preferred substrate, α-cyclodextrin, enhance endurance exercise performance in mice and human males

Affiliations
Randomized Controlled Trial

Bacteroides uniformis and its preferred substrate, α-cyclodextrin, enhance endurance exercise performance in mice and human males

Hiroto Morita et al. Sci Adv. .

Abstract

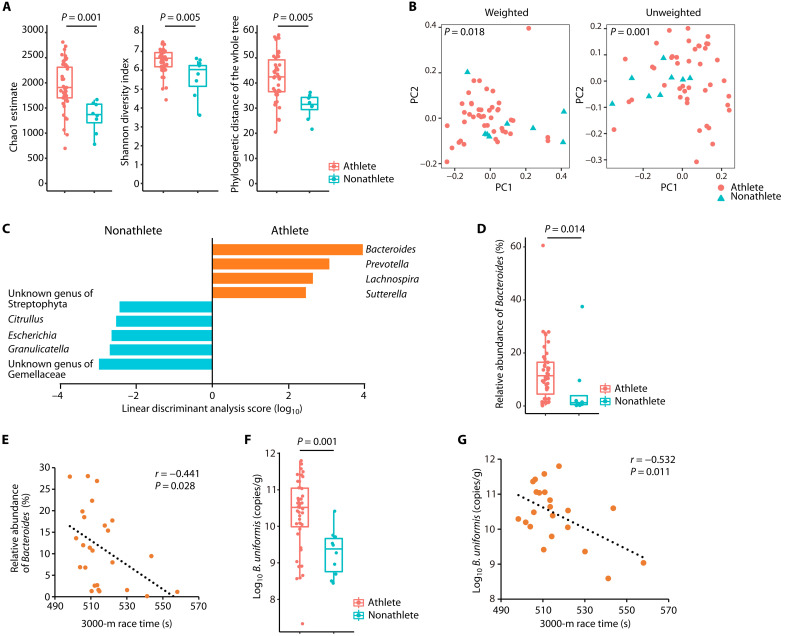
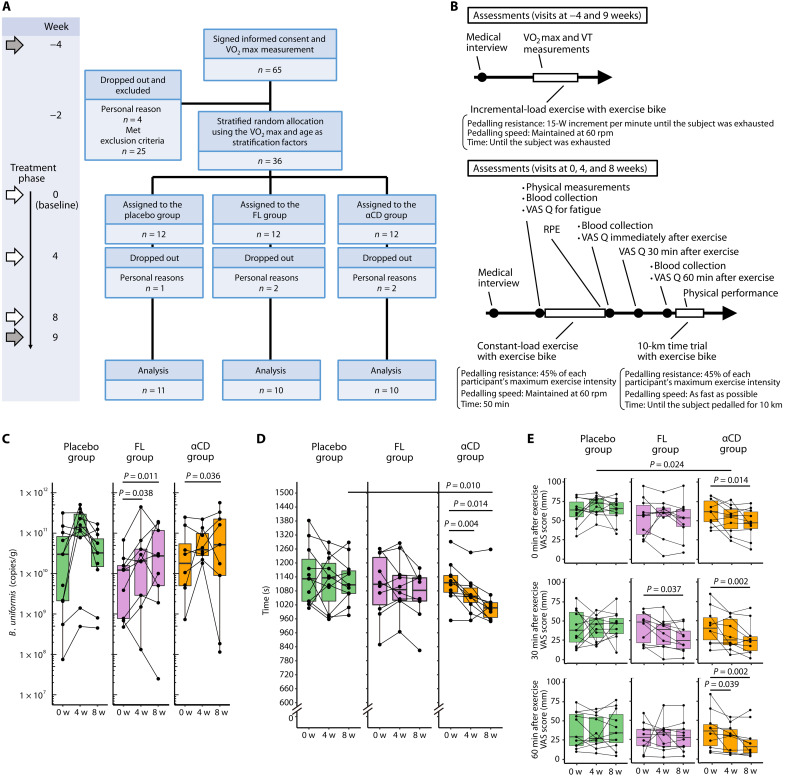
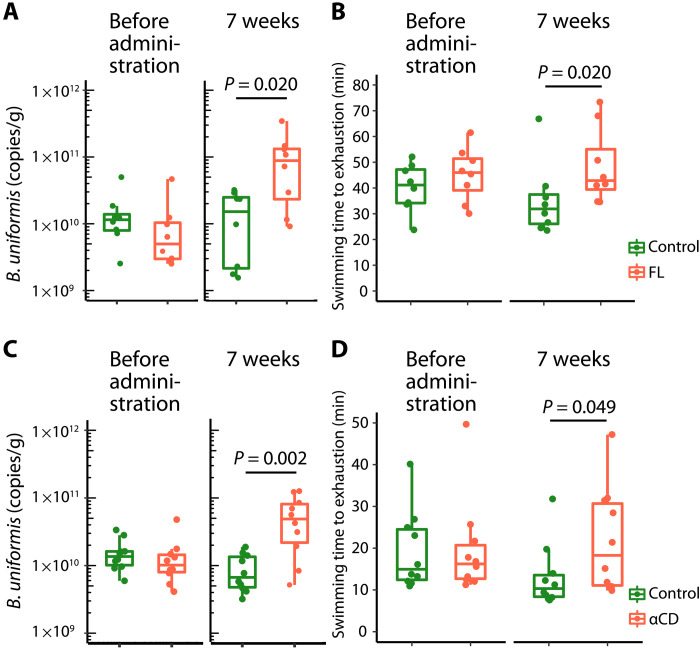
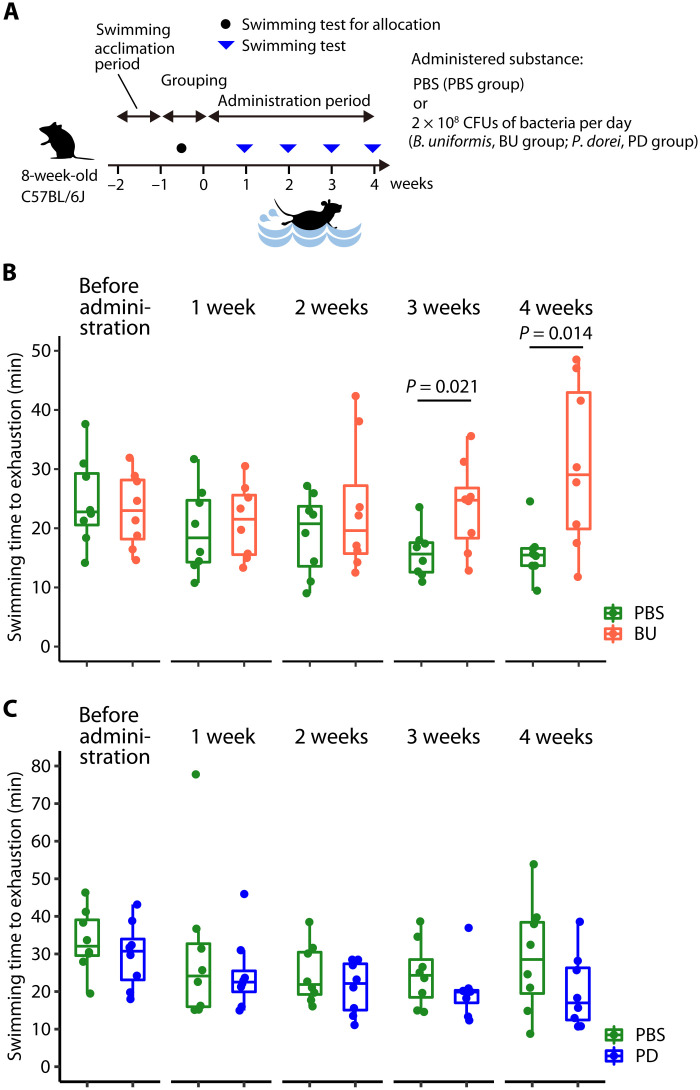
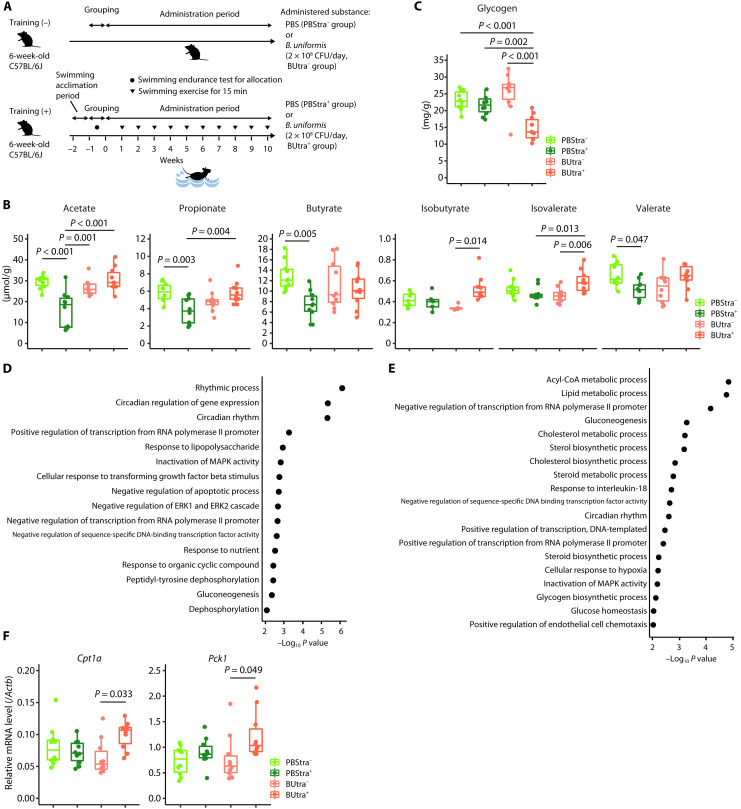
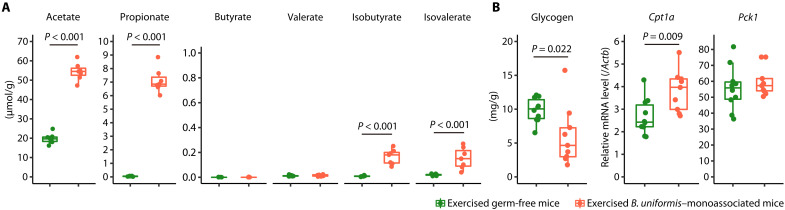
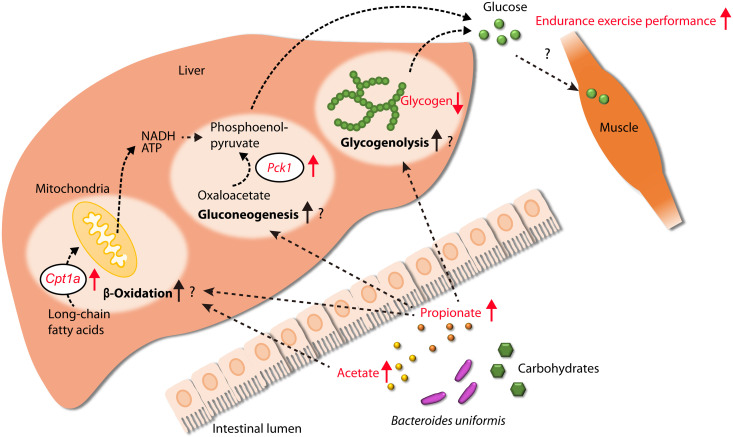
Although gut microbiota has been linked to exercise, whether alterations in the abundance of specific bacteria improve exercise performance remains ambiguous. In a cross-sectional study involving 25 male long-distance runners, we found a correlation between Bacteroides uniformis abundance in feces and the 3000-m race time. In addition, we administered flaxseed lignan or α-cyclodextrin as a test tablet to healthy, active males who regularly exercised in a randomized, double-blind, placebo-controlled study to increase B. uniformis in the gut (UMIN000033748). The results indicated that α-cyclodextrin supplementation improved human endurance exercise performance. Moreover, B. uniformis administration in mice increased swimming time to exhaustion, cecal short-chain fatty acid concentrations, and the gene expression of enzymes associated with gluconeogenesis in the liver while decreasing hepatic glycogen content. These findings indicate that B. uniformis enhances endurance exercise performance, which may be mediated by facilitating hepatic endogenous glucose production.


Figures

Fig. 1.
Fig. 1.. Bacteroides abundance was higher in long-distance runners and correlated with the 3000-m race time.
(A) Gut microbiota α-diversity of long-distance male runners (athletes) and nonathlete male controls (nonathletes). The statistical significance of the differences between groups was analyzed using a two-sample t test with Monte Carlo permutations. (B) Fecal microbiota profiles of athletes (red circles) and nonathletes (blue triangles). Principal coordinate analysis plots using weighted or unweighted UniFrac distances are shown. The statistical significance of the differences between groups was analyzed using permutational multivariate analysis of variance (PERMANOVA). (C) LEfSe analysis was performed to isolate genera with | Linear discriminant analysis score | > 2. (D) Relative abundance of the genus Bacteroides in the athlete and nonathlete groups, determined by 16S rRNA-encoding gene amplicon sequencing and compared using the Mann-Whitney U test. (E) Scatterplot of the 3000-m race time and the relative abundance of Bacteroides in the athlete group. Individual participants are represented as circles. (F) B. uniformis abundance in feces collected from the athlete and nonathlete groups, determined by 16S rRNA-encoding gene copy numbers using B. uniformis–specific qPCR. The Mann-Whitney U test was used to compare the groups. (G) Scatterplot of the 3000-m race time and B. uniformis abundance in the athlete group. Individual participants are represented as circles. The distribution of values within each group (A, D, and F) is illustrated by a box-and-whisker plot. (A to D) Athlete group, n = 43; nonathlete group, n = 8. (F) Athlete group, n = 48; nonathlete group, n = 10. (E and G) Athlete group, n = 25. Twenty-three of 48 athletes refused to participate in the trial to measure the race time. All statistical tests were two-tailed. For correlations, the dotted line shows the regression line.
Fig. 2.
Fig. 2.. α-Cyclodextrin affected B. uniformis abundance, endurance exercise performance, and postexercise fatigue, as demonstrated in a randomized, double-blind, placebo-controlled, parallel-group study.
(A) The randomized, double-blind, placebo-controlled, parallel-group study protocol. The V˙O2max was evaluated at the weeks indicated by gray arrows (−4 and 9 weeks). Participants who met the inclusion criteria and did not meet the exclusion criteria were randomly allocated to the placebo, FL, or αCD groups. At the weeks indicated with white arrows (0, 4, and 8 weeks), we conducted a VAS questionnaire (VAS Q) related to fatigue before and after a 50-min constant-load exercise session, assessed the RPE, measured the time needed to pedal 10 km on an exercise bike, and collected blood and fecal samples. (B) Assessments performed at each visit in chronological order. (C) qPCR analysis of B. uniformis abundance in feces from each group at baseline (0 weeks) and after 4 and 8 weeks of supplementation. (D) Time required to pedal 10 km on an exercise bike. (E) Results of the VAS Q on fatigue conducted 0, 30, and 60 min after a 50-min constant-load biking exercise session. Fatigue levels measured by the VAS range from 0, indicating “not feel fatigued at all,” to 100, indicating “feel extreme fatigue.” The distribution of values within each group (C to E) is illustrated by a box-and-whisker plot. Consecutive measurements of the same individuals (dots) are connected with lines. The Mann-Whitney U test (placebo group versus FL or αCD group) or Wilcoxon signed-rank test (0 weeks versus 4 or 8 weeks) were used to determine the statistical significance of the different analyses. All statistical tests were two-tailed.
Fig. 3.
Fig. 3.. FL and αCD increased the B. uniformis abundance in the murine intestine and prolonged the swimming time to exhaustion.
The mice in the FL or αCD groups were fed a standard diet containing 5% (w/w) FL or αCD, respectively, and subjected to a weekly swimming endurance test (n = 8 for the FL group and associated control group; n = 10 for the αCD group and associated control group). (A and C) Box-and-whisker plots of B. uniformis abundance in feces from each group before administration and at the end point (7 weeks) based on the 16S rRNA-encoding gene copy numbers, calculated using B. uniformis–specific qPCR. (B and D) Box-and-whisker plots of the swimming time to exhaustion for each group before administration and at the end point (7 weeks). The statistical significance of the differences between groups was analyzed using two-tailed Mann-Whitney U tests.
Fig. 4.
Fig. 4.. B. uniformis administration improved endurance exercise performance in mice.
(A) Endurance exercise test schedule. The mice were administered PBS (PBS group), B. uniformis (2 × 108 CFU/day) (BU group), or P. dorei (2 × 108 CFU/day) (PD group) for 4 weeks and tested weekly for swimming endurance. (B and C) Swimming time to exhaustion of PBS-administered (n = 8), B. uniformis–administered (n = 8) (B), and P. dorei–administered (n = 8) (C) mice. The box-and-whisker plot illustrates the distribution of values within each group. The statistical significance of the differences between groups was analyzed using two-tailed Mann-Whitney U tests.
Fig. 5.
Fig. 5.. B. uniformis administration altered intestinal SCFA concentrations and hepatic glycogen levels in SPF mice.
(A) Experimental schedule. The mice were orally administered PBS or B. uniformis (2 × 108 CFU/day) for 10 weeks, and the mice in training (+) groups were subjected to weekly swimming exercises. (B) SCFA concentrations in the cecal content of PBS-administered mice subjected (PBStra+, n = 10) and not subjected to exercise (PBStra, n = 10) and B. uniformis–administered mice subjected (BUtra+, n = 10) and not subjected to exercise (BUtra, n = 10). (C) Hepatic glycogen content in PBStra (n = 10), PBStra+ (n = 10), BUtra (n = 10), and BUtra+ (n = 10) mice. (D and E) Gene ontology (GO) analysis results of differentially expressed genes in the liver. The enriched GO terms identified using DAVID are listed in (D) [PBStra (n = 6) versus PBStra+ (n = 6)] and (E) [BUtra (n = 6) versus BUtra+ (n = 6)]. Statistical significance was analyzed using Fisher’s exact test. P < 0.01 was considered significant. (F) Reverse transcription qPCR analysis of the hepatic Cpt1a and Pck1 expression in PBStra (n = 10), PBStra+ (n = 10), BUtra (n = 10), and BUtra+ (n = 10) mice. The box-and-whisker plot illustrates the distribution of values within each group (B, C, and F). In (B), the Tukey-Kramer test was used for the statistical analysis of SCFAs, with the exception of isobutyrate, which was analyzed using the Steel-Dwass test. In (C), the Tukey-Kramer test was used for the analysis. In (F), the Tukey-Kramer test and Steel-Dwass tests were used for the analyses of Cpt1a and Pck1, respectively. These tests were selected on the basis of the outcomes of the normality test. All statistical tests were two-tailed.
Fig. 6.
Fig. 6.. Fecal SCFA and hepatic glycogen levels differed between exercised B. uniformis–monoassociated mice and germ-free mice.
(A) SCFA concentrations in the feces of exercised germ-free mice (n = 8) and B. uniformis–monoassociated mice (n = 7). (B) Hepatic glycogen content and expression of Cpt1a and Pck1 in exercised germ-free mice (n = 8) and B. uniformis–monoassociated mice (n = 7). The box-and-whisker plot illustrates the distribution of values within each group. An unpaired t test was used to statistically analyze the acetate, propionate, isovalerate, glycogen, and Cpt1a levels. The Mann-Whitney U test was used to analyze the valerate, isobutyrate, and Pck1 levels. These tests were selected on the basis of the outcomes of the normality test. All statistical tests were two-tailed.
Fig. 7.
Fig. 7.. Potential mechanism through which B. uniformis enhances host endurance exercise performance.
B. uniformis produces acetate and propionate in the intestine through carbohydrate metabolism. These SCFAs may then migrate to the liver and stimulate Cpt1a and Pck1 gene expression, encoding enzymes involved in fatty acid oxidation and gluconeogenesis (29, 30), respectively. Specifically, propionate is used as a gluconeogenic substrate (33) and stimulates glycogenolysis (34), resulting in glucose production, which can be used as an energy source during exercise in exercise-related organs, such as muscle. Red arrows indicate the phenomena observed in this study.

References

    1. O. O’Sullivan, O. Cronin, S. F. Clarke, E. F. Murph, M. G. Molloy, F. Shanahan, P. D. Cotter, Exercise and the microbiota. Gut Microbes 6, 131–136 (2015). - PMC - PubMed
    1. N. Mach, D. Fuster-Botella, Endurance exercise and gut microbiota: A review. J. Sport Health Sci. 6, 179–197 (2017). - PMC - PubMed
    1. A. Clark, N. Mach, The crosstalk between the gut microbiota and mitochondria during exercise. Front. Physiol. 8, 319 (2017). - PMC - PubMed
    1. V. Cella, V. M. Bimonte, C. Sabato, A. Paoli, C. Baldari, M. Campanella, A. Lenzi, E. Ferretti, S. Migliaccio, Nutrition and physical activity-induced changes in gut microbiota: Possible implications for human health and athletic performance. Foods 10, 3075 (2021). - PMC - PubMed
    1. M. Marttinen, R. Ala-Jaakkola, A. Laitila, M. J. Lehtinen, Gut microbiota, probiotics and physical performance in athletes and physically active individuals. Nutrients 12, 2936 (2020). - PMC - PubMed

Publication types

Substances

Supplementary concepts

LinkOut - more resources