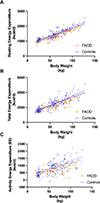
Resting and total energy expenditure of patients with long-chain fatty acid oxidation disorders (LC-FAODs)
- PMID: 36696737
- PMCID: PMC9992335
- DOI: 10.1016/j.ymgme.2023.107519
Resting and total energy expenditure of patients with long-chain fatty acid oxidation disorders (LC-FAODs)
Abstract
The basis of medical nutrition therapy for patients with LC-FAODs is to provide adequate energy to maintain anabolism and prevent catabolism. In practice, energy needs are estimated based on formulas derived from normal populations but it is unknown if energy expenditure among patients with LC-FAODs is similar to the normal population. We measured resting energy expenditure (REE), total energy expenditure (TEE) and body composition in 31 subjects with LC-FAODs ranging in age from 7 to 64 years. Measured REE was lower than estimated REE by various prediction equations and measured TEE was lower than estimated TEE. It is possible that the lower energy expenditure based on prediction formulas from the normal population is due to differences in body composition; we compared body composition to normal data from the 2017-18 National Health and Nutrition Examination Survey (NHANES). Fat free mass and fat mass was similar between subjects with an LC-FAOD and NHANES normal data suggesting no difference in body composition. We then compared measured REE and TEE to normal published data from the Dietary Reference Intakes (DRI). Measured REE and TEE were significantly lower among subjects with LC-FAODs compared to normal published energy expenditure data. Our results suggests patients with a LC-FAOD exhibit a lower REE and therefore actually have a slightly lower TEE than estimated. Current prediction equations may overestimate energy expenditure of patients with a LC-FAOD.
Keywords: Energy expenditure; Fatty acid oxidation disorders; Resting energy expenditure; Total energy expenditure.
Copyright © 2023 Elsevier Inc. All rights reserved.
Figures


Similar articles
-
Higher dietary protein intake preserves lean body mass, lowers liver lipid deposition, and maintains metabolic control in participants with long-chain fatty acid oxidation disorders.J Inherit Metab Dis. 2019 Sep;42(5):857-869. doi: 10.1002/jimd.12155. Epub 2019 Jul 24. J Inherit Metab Dis. 2019. PMID: 31295363 Free PMC article. Clinical Trial.
-
Triheptanoin versus trioctanoin for long-chain fatty acid oxidation disorders: a double blinded, randomized controlled trial.J Inherit Metab Dis. 2017 Nov;40(6):831-843. doi: 10.1007/s10545-017-0085-8. Epub 2017 Sep 4. J Inherit Metab Dis. 2017. PMID: 28871440 Free PMC article. Clinical Trial.
-
Long-term major clinical outcomes in patients with long chain fatty acid oxidation disorders before and after transition to triheptanoin treatment--A retrospective chart review.Mol Genet Metab. 2015 Sep-Oct;116(1-2):53-60. doi: 10.1016/j.ymgme.2015.06.006. Epub 2015 Jun 18. Mol Genet Metab. 2015. PMID: 26116311 Free PMC article. Review.
-
Total energy expenditure in patients with colorectal cancer: associations with body composition, physical activity, and energy recommendations.Am J Clin Nutr. 2019 Aug 1;110(2):367-376. doi: 10.1093/ajcn/nqz112. Am J Clin Nutr. 2019. PMID: 31225583 Free PMC article.
-
Long-chain fatty acid oxidation disorders and current management strategies.Am J Manag Care. 2020 Aug;26(7 Suppl):S147-S154. doi: 10.37765/ajmc.2020.88480. Am J Manag Care. 2020. PMID: 32840329 Free PMC article. Review.
Cited by
-
Nutritional Management of Patients with Fatty Acid Oxidation Disorders.Nutrients. 2024 Aug 14;16(16):2707. doi: 10.3390/nu16162707. Nutrients. 2024. PMID: 39203843 Free PMC article. Review.
-
Vitamin B2 enables regulation of fasting glucose availability.Elife. 2023 Jul 7;12:e84077. doi: 10.7554/eLife.84077. Elife. 2023. PMID: 37417957 Free PMC article.
References
-
- Spiekerkoetter U, Mitochondrial fatty acid oxidation disorders: clinical presentation of long-chain fatty acid oxidation defects before and after newborn screening J Inherit Metab Dis 33 (2010) 527–532. - PubMed
-
- Vockley J, Bennett MJ, Gillingham MB, Mitochondiral Fatty Acid Oxisation Disorders, in: Mitchell G, Gibson KM, Ballabio A, Antonkarakis SE, Kinzler KW, Vogelstein B, Beaudet AL, Valle D (Eds.), The Online Metabolic and Molecular Bases of Inherited Disease, The McGraw-Hill Companies, Inc., New York, NY, 2017.
-
- Saudubray JM, Martin D, de Lonlay P, Touati G, Poggi-Travert F, Bonnet D, Jouvet P, Boutron M, Slama A, Vianey-Saban C, Bonnefont JP, Rabier D, Kamoun P, Brivet M, Recognition and management of fatty acid oxidation defects: a series of 107 patients J Inherit Metab Dis 22 (1999) 488–502. - PubMed
-
- Van Calcar SC, Sowa M, Rohr F, Beazer J, Setlock T, Weihe TU, Pendyal S, Wallace LS, Hansen JG, Stembridge A, Splett P, Singh RH, Nutrition management guideline for very-long chain acyl-CoA dehydrogenase deficiency (VLCAD): An evidence- and consensus-based approach Mol Genet Metab 131 (2020) 23–37. - PubMed
Publication types
MeSH terms
Substances
Grants and funding
LinkOut - more resources
Full Text Sources
Medical

