. 2023 Mar 15;14(3):220-236.e3.
doi: 10.1016/j.cels.2022.12.008. Epub 2023 Jan 24.

Minimal synthetic enhancers reveal control of the probability of transcriptional engagement and its timing by a morphogen gradient

Affiliations

Minimal synthetic enhancers reveal control of the probability of transcriptional engagement and its timing by a morphogen gradient

Simon Alamos et al. Cell Syst. .

Abstract

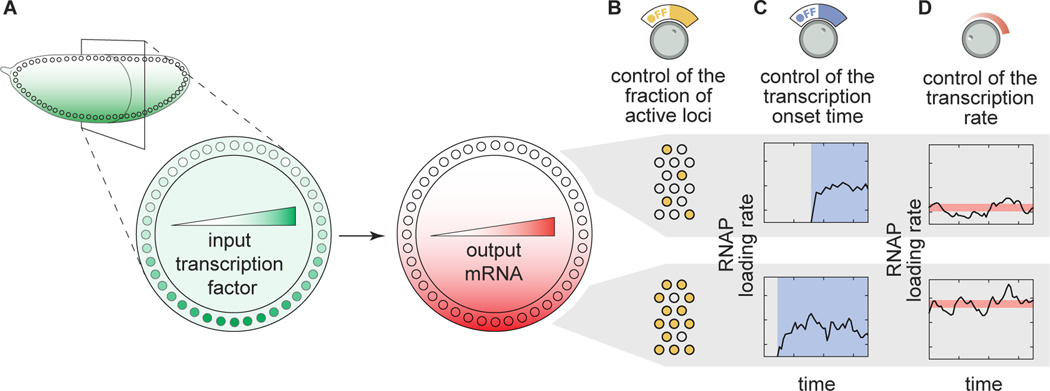
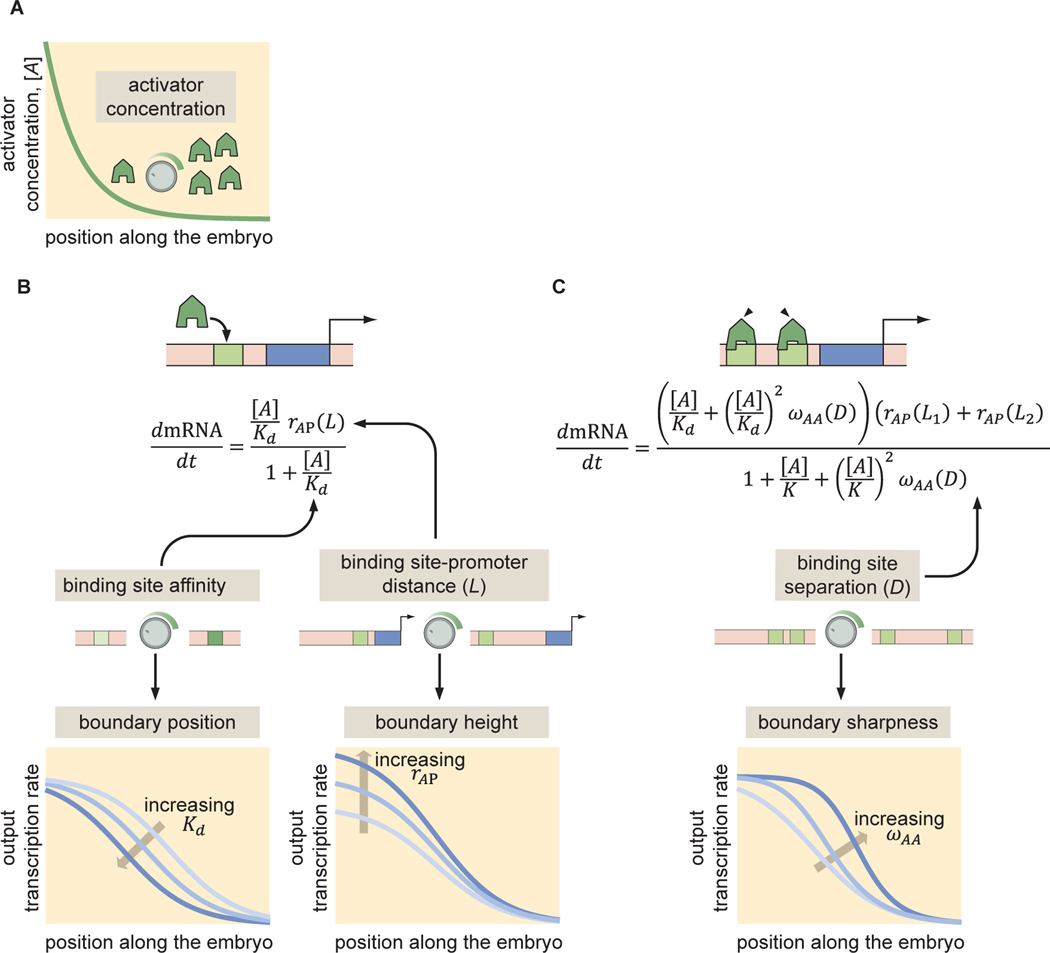
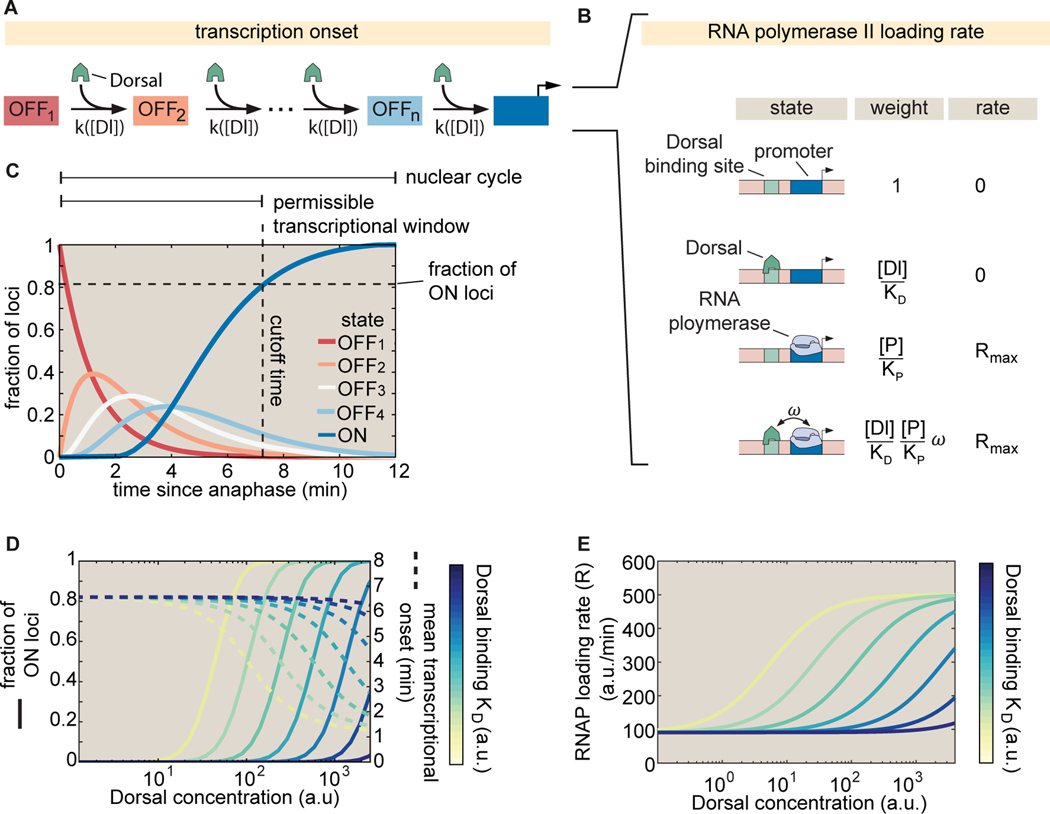
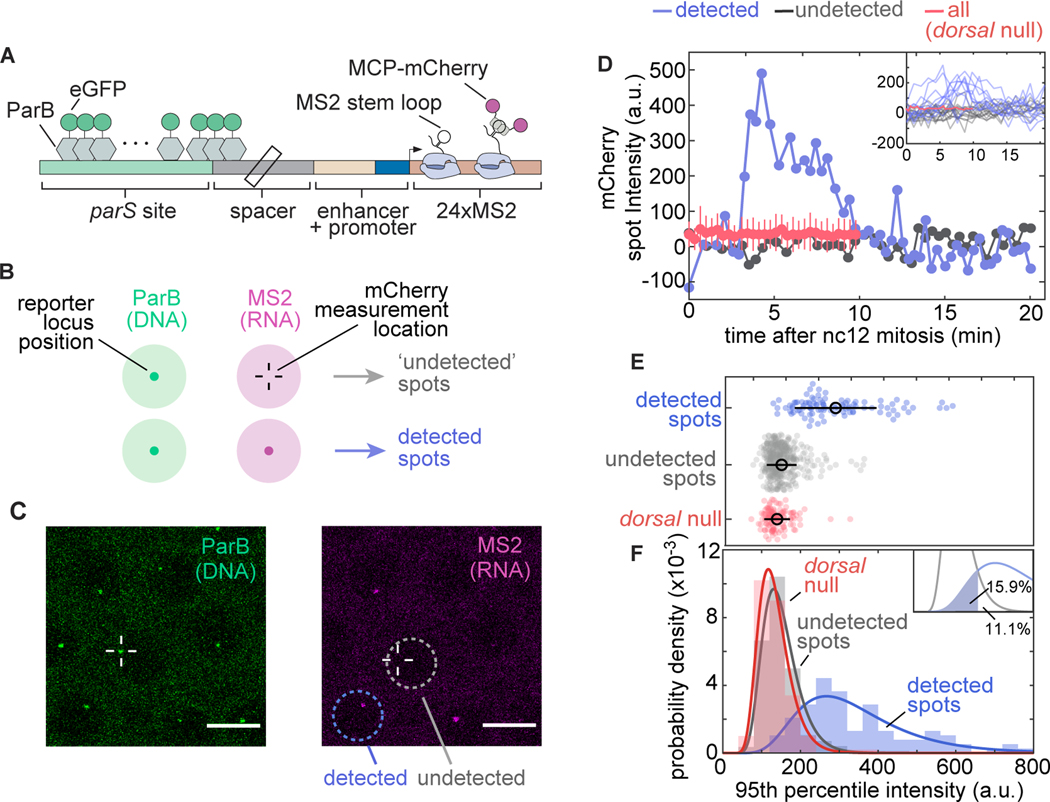
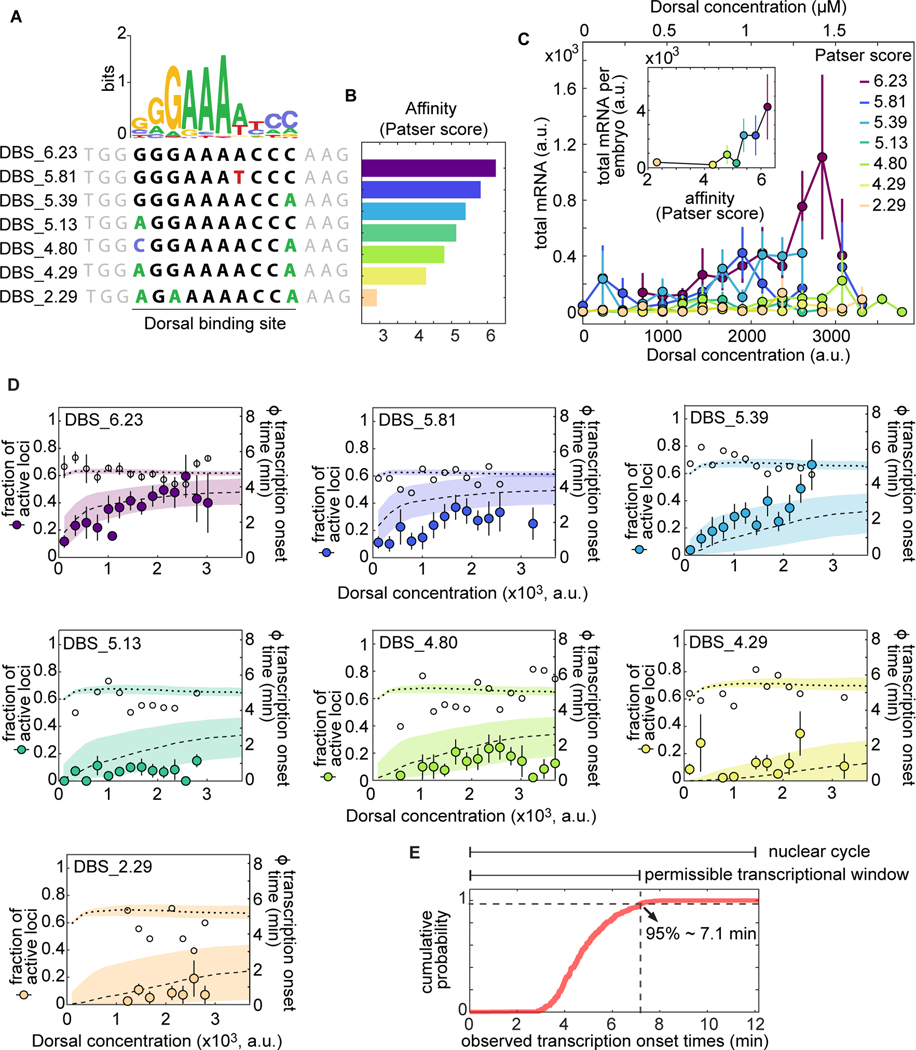
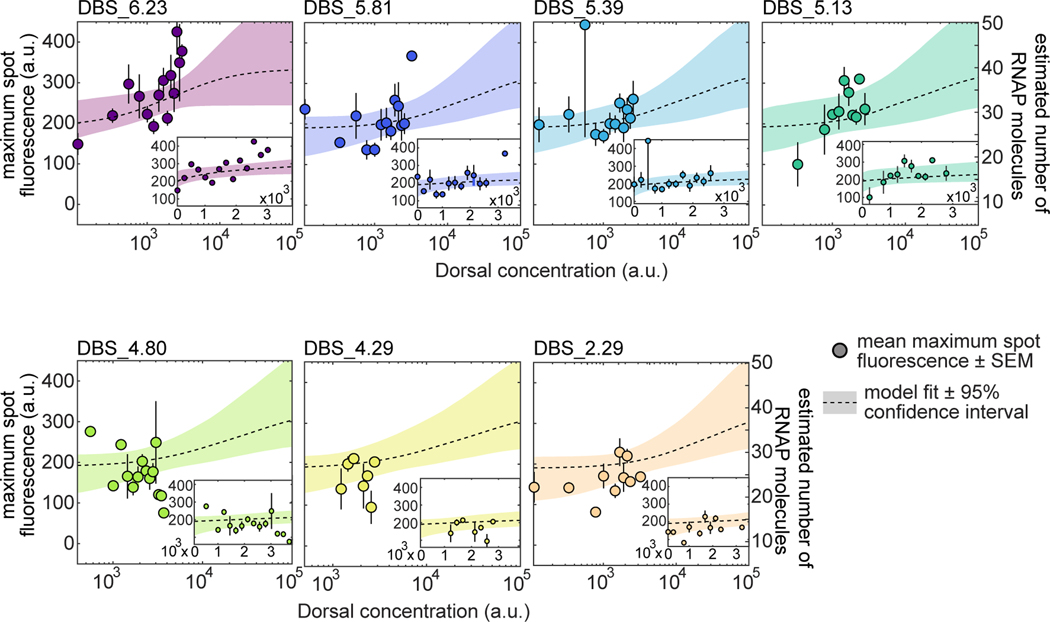
How enhancers interpret morphogen gradients to generate gene expression patterns is a central question in developmental biology. Recent studies have proposed that enhancers can dictate whether, when, and at what rate promoters engage in transcription, but the complexity of endogenous enhancers calls for theoretical models with too many free parameters to quantitatively dissect these regulatory strategies. To overcome this limitation, we established a minimal promoter-proximal synthetic enhancer in embryos of Drosophila melanogaster. Here, a gradient of the Dorsal activator is read by a single Dorsal DNA binding site. Using live imaging to quantify transcriptional activity, we found that a single binding site can regulate whether promoters engage in transcription in a concentration-dependent manner. By modulating the binding-site affinity, we determined that a gene's decision to transcribe and its transcriptional onset time can be explained by a simple model where the promoter traverses multiple kinetic barriers before transcription can ensue.

Keywords: Drosophila melanogaster; biophysics; developmental biology; quantitative biology; transcriptional dynamic; transcriptional modeling; transcriptional regulation.


Conflict of interest statement

Declaration of interests The authors declare no competing interests.

Figures

Figure 1.
Figure 1.. Transcriptional regulatory strategies of enhancers in response to transcription factor concentration gradients.
(A) A Drosophila embryo with a transcription factor gradient along its dorsoventral axis. This input transcription factor dictates the emergence of output gene-expression patterns by controlling a combination of three enhancer regulatory ‘knobs’: (B) the probability of loci becoming transcriptionally active, (C) the transcriptional onset time, and (D) the mean transcription rate of active loci.
Figure 2.
Figure 2.. (Box 1) Iterative synthetic dissection of transcriptional control in development.
(A) We consider an activator exponentially distributed along one of the axes of the embryo. (B) A synthetic enhancer containing only one binding site can be described by a thermodynamic model with two parameters, the activator-DNA dissociation constant Kd and the transcription rate enhancement upon activator binding rAP, which control the position and amplitude of the gene expression boundary driven by the enhancer, respectively. (C) Adding one binding site to the synthetic enhancer introduces only one more free parameter ωAA describing activator-activator interactions and dictating the sharpness of the developmental boundary. (Adapted from [3].)
Figure 3.
Figure 3.. Integrated kinetic and thermodynamic model of simple activation by Dorsal.
(A) The promoter undergoes kinetic transitions from transcriptionally inactive states (OFF1 to OFFn to an active state (ON) with Dorsal accelerating the transition rate, k, by a factor proportional to the Dorsal occupancy at the promoter. (B) Thermodynamic states and weights for the simple activator model. The probability of finding RNAP bound to the promoter can be calculated from the statistical weights associated with all possible occupancy states of the proximal enhancer-promoter system. (C) Visualization of a particular solution of the kinetic scheme from (A) showing the probability of finding a given locus in each of the states for an illustrative, representative set of parameters ([Dl]=1000 a.u., KD=1000 a.u., c=10/min,n=4 states, and 7 min nuclear cycle duration). The predicted fraction of active loci (dashed horizontal line) is calculated as the probability of being in the ON state by the end of the permissible time window (dashed vertical line) that is determined by mitotic repression. (D) Predictions for the fraction of active loci (solid lines plotted against the left y-axis) and mean transcriptional onset times (dashed lines plotted against the right y-axis) as a function of Dorsal concentration for different, logarithmically-spaced values of the Dorsal dissociation constant KD in arbitrary units of Dorsal concentration. Note that under some parameter regimes, mean turn on times are similar across Dorsal concentrations. (E) Rate of mRNA production across active loci as a function of Dorsal concentration for different values of KD based on the model in (B) Rmax=1000 a.u., Dorsal KD ranging from 10 a.u. to 105 a.u., ω=10,[P]/KP=0.1.
Figure 4.
Figure 4.. Simultaneously measuring transcription factor protein input and transcriptional output.
(A) Schematic of the Dorsal protein gradient in early Drosophila embryos. Dorsal protein accumulates in ventral nuclei and is progressively excluded from more dorsal nuclei. Example snapshots show Dorsal-mVenus in various positions along the dorsoventral axis. (B) Representative time traces of nuclear Dorsal-mVenus fluorescence in various positions along the dorsoventral axis in 2x Dorsal embryos. The right y-axis shows the approximate nuclear Dorsal concentration according to the estimation described in Figure S9. (C) Schematic of minimal synthetic promoter-proximal enhancer system containing a single binding site for Dorsal that drives transcription of a reporter tagged with MS2 loops, which are visualized through the binding of MCP-mCherry. The Dorsal binding site is placed 14bp upstream of the even-skipped minimal promoter. (D) Snapshots from embryos containing an optimal binding-site reporter in the presence (left) or absence (middle) of Dorsal, or containing a strongly mutated Dorsal binding site (right). (E) Examples of fluorescence time traces and quantitative metrics of transcriptional activity used throughout this work. (F) Fluorescence of all transcription spots in individual nuclei in the field of view of one embryo as a function of time (heatmap) and their corresponding Dorsal-Venus fluorescence midway through the nuclear cycle (green bars on the left). If a transcription spot was detected within a nucleus at any point during the interphase of nuclear cycle 12, then the locus was considered active; otherwise, the locus was classified as inactive.
Figure 5.
Figure 5.. Transcriptionally independent ParB labeling confirms that transcriptionally inactive loci are functionally distinct from active loci.
(A) Schematic of ParB-eGFP construct. ParB-eGFP molecules bind and polymerize out from parS sequences, which are placed 400 bp upstream of the enhancer. The enhancer and promoter together drive transcription of MS2 loops that subsequently bind MCP-mCherry. (B) Schematic of the experiment. Loci are located by detecting a signal in the ParB-eGFP channel; these locations were used to fit a 2D Gaussian to the same area in the MS2-mCherry channel to estimate fluorescence intensity regardless of whether an MS2-mCherry signal was detected (Materials and Methods Section 4.3). (C) Example images of ParB-eGFP (left) and MCP-mCherry (right) channels. Detected and undetected loci are found based solely on the MCP-mCherry signal. (D) Example time traces of MCP-mCherry fluorescence over time at the ParB-eGFP loci in nuclei with (blue) and without (grey) detected MS2-mCherry spots of the DBS_6.23 enhancer showing clear qualitative differences between the two populations. For comparison, the mean mCherry fluorescence at the ParB-eGFP loci in a representative Dorsal null embryo is also shown. Inset, all detected and undetected fluorescence traces obtained in the same embryo along with the mean fluorescence of all traces in a dorsal null embryo. Negative intensity values are due to spot intensities very close to the background fluorescence. (E) Swarm plots of 95th percentile MCP-mCherry fluorescence at loci with detected (blue; N=125 nuclei pooled from 20 embryos) and undetected MS2-mCherry transcription (gray; N=425 nuclei pooled from 20 embryos) driven by the DBS_6.23 enhancer in wild-type Dorsal embryos. Red (N = 96 nuclei pooled from 6 embryos), maximum fluorescence of all loci in Dorsal null embryos, defined as the 95 th percentile of intensity over time (black circles, mean; bars, standard deviation). Detected spots are significantly different from both null (ANOVA, p<0.01) and undetected spots (ANOVA, p<0.01) (F) Histograms of the data shown in (E). Solid lines correspond to log-normal fits performed for ease of visualization. Inset, undetected and detected distribution fits and the area used to estimate the false-negative detection rate of 15.9% and the false-positive detection if 11.1%.
Figure 6.
Figure 6.. A multi-step kinetic barrier model predicts the Dorsal-dependent fraction of active loci with constant mean transcriptional onset times.
(A) Top: Dorsal positional weight matrix logo from [100]. Bottom: Sequence of the Dorsal binding sites engineered into our minimal synthetic enhancers. Bold letters, 10 bp Dorsal motif; black letters, consensus bases; colored letters, mutated bases; gray letters, sequence context. (B) Relative affinities of Dorsal binding sites estimated from the Patser algorithm using the Dorsal position weight matrix. (C) Overall transcriptional activity driven by the enhancers containing the binding sites in (A) measured as the total produced mRNA (fluorescence integrated over nuclear cycle 12) as a function of Dorsal concentration. Inset, mean total mRNA produced per embryo integrated across all Dorsal concentrations. Error bars, SEM over N>3 embryos containing 3 or more nuclei belonging to that Dorsal fluorescence bin. The to x-axis shows the estimated nuclear Dorsal concentration according to the calibration described in Figure S9. (D) Data and model fits for the fraction of active loci (left y-axis) and mean transcription onset time (right y-axis) for each enhancer. Empty black circles, experimentally observed mean transcription onset time; filled circles, experimentally observed mean fraction of active loci. Fitted curves are represented as dashed lines (fraction of active loci) and dotted lines (mean onset times), corresponding to predictions using median parameter values from the joint posterior distribution. Shaded areas, 95% credible interval (see Table S1 for inferred parameter values). Error bars, SEM over N>3 embryos containing 3 or more nuclei belonging to that Dorsal fluorescence bin. The total number of embryos per enhancer from lowest to highest Patser score were 19,27,18,26,16,35 and 46. (E) Cumulative probability distribution of spot detection over all Dorsal fluorescence bins across all embryos and enhancers (N=344 spots). Vertical dashed line, time at which 95% of spots have turned on (7.1min) corresponding to the end of the permissible transcription time window.
Figure 7.
Figure 7.. Testing RNAP loading rate predictions of the thermodynamic model.
Mean maximum spot fluorescence as a function of Dorsal concentration for minimal synthetic enhancers with different affinities for Dorsal. The right y-axis denotes the calibrated number of actively transcribing RNAP molecules. As shown in Equation S15, this calibration depends linearly on the elongation rate which can vary by a factor of two depending on the study [8, 81, 82]. For more details about this calibration, see Section S1.3. Dashed curves correspond to a simultaneous Markov Chain Monte Carlo curve fit to all data using Equation 3. Fits share all parameters except KD. Shaded areas, 95% prediction intervals. Insets, same data and fits plotted on a linear scale with axis ranges zoomed in on the data. See Table s2 for inferred parameter values. Error bars, SEM across N>3 embryos containing 3 or more nuclei in a given fluorescence bin. The total number of embryos per enhancer from lowest to highest Patser score were 19, 27, 18, 26, 16, 35 and 46.

Similar articles

Cited by

References

    1. Wolpert L. Positional information and the spatial pattern of cellular differentiation. J Theor Biol, 25(1):1–47, 1969. - PubMed
    1. Briscoe James and Small Stephen. Morphogen rules: design principles of gradient-mediated embryo patterning. Development, 142(23):3996–4009, December 2015. - PMC - PubMed
    1. Garcia HG, Berrocal A, Kim YJ, Martini G, and Zhao J. Lighting up the central dogma for predictive developmental biology. Curr Top Dev Biol, 137:1–35, 2020. - PubMed
    1. Vincent BJ, Estrada J, and DePace AH. The appeasement of doug: a synthetic approach to enhancer biology. Integr Biol (Camb), 8(4):475–84, 2016. - PubMed
    1. Venken Koen J. T. and Bellen Hugo J.. Emerging technologies for gene manipulation in Drosophila melanogaster. Nature Reviews Genetics, 6(3):167–178, March 2005. Number: 3 Publisher: Nature Publishing Group. - PubMed

Publication types

MeSH terms

Substances