

In-Vial Detection of Protein Denaturation Using Intrinsic Fluorescence Anisotropy
- PMID: 36696963
- PMCID: PMC9909669
- DOI: 10.1021/acs.analchem.2c03912
In-Vial Detection of Protein Denaturation Using Intrinsic Fluorescence Anisotropy
Abstract
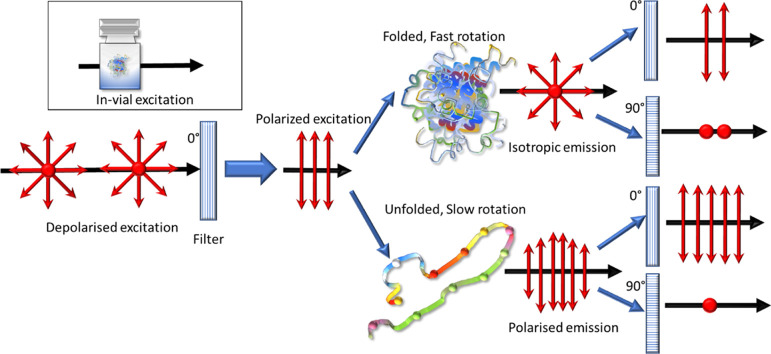
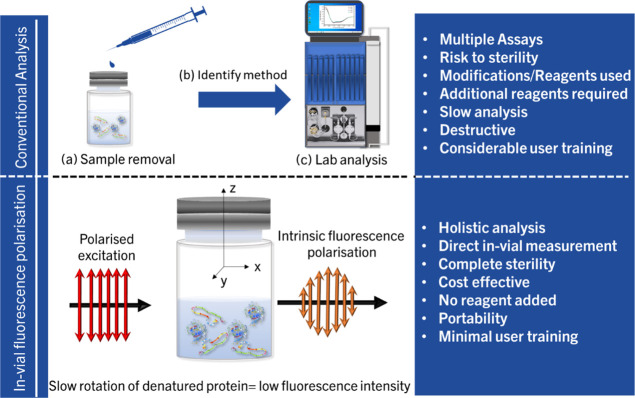
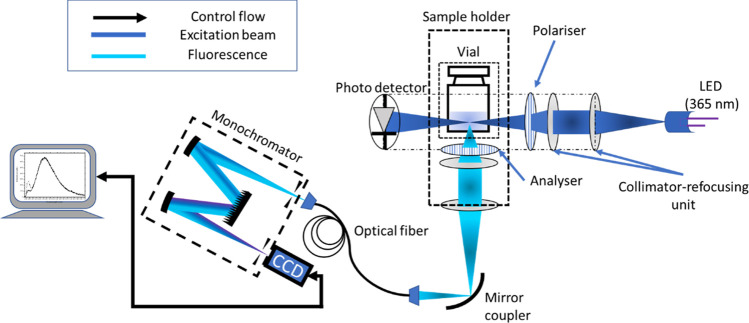
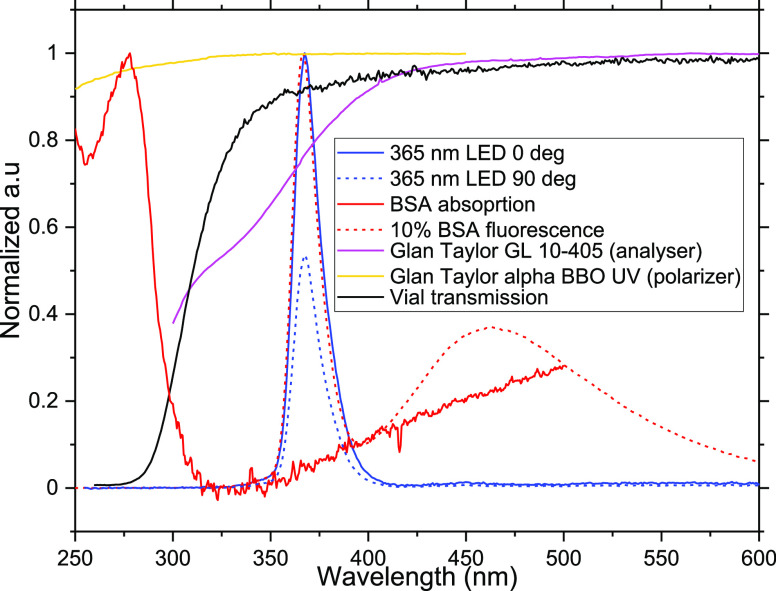
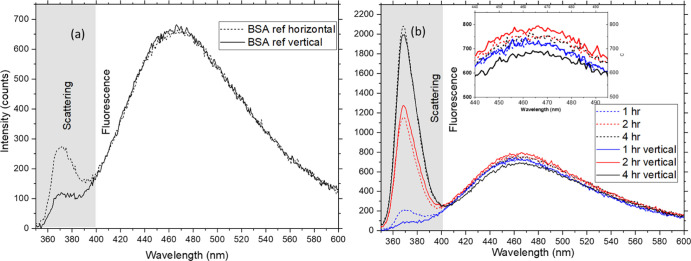
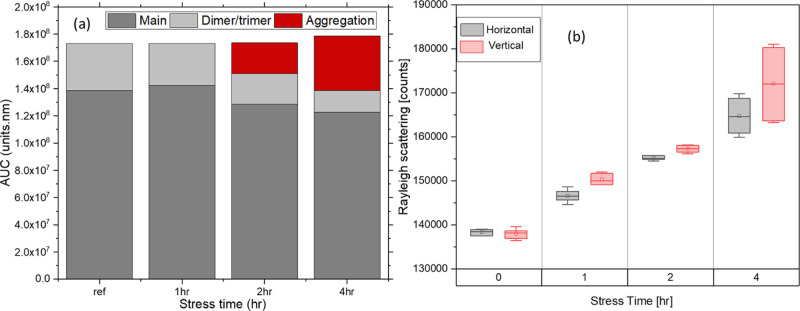
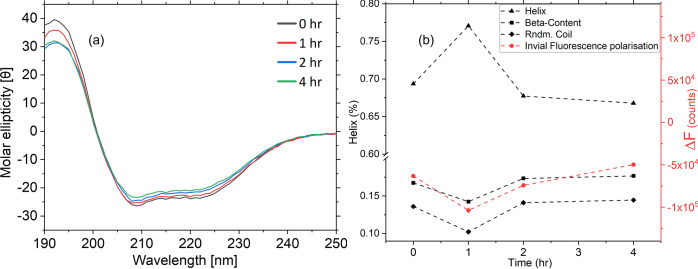
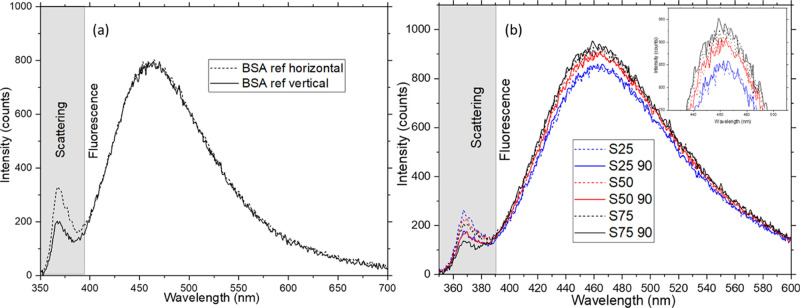
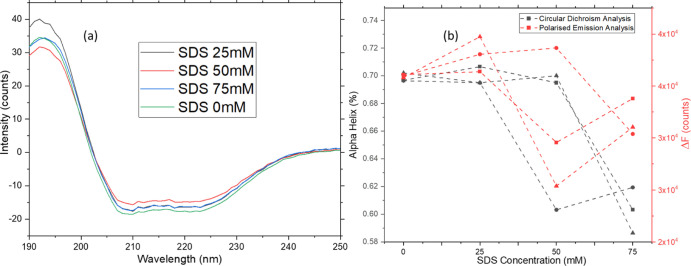
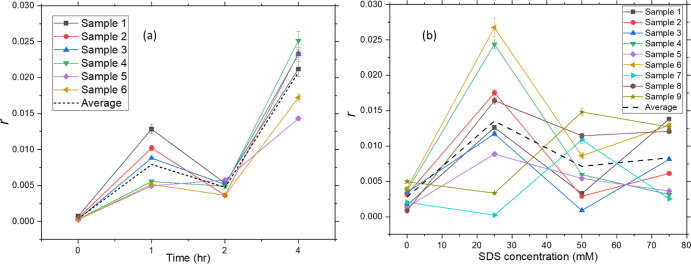
The conventional quality control techniques for identifying the denaturation of biopharmaceuticals includes sodium dodecyl sulfate-polyacrylamide gel electrophoresis for identifying fragmentation, ion exchange chromatography and isoelectric focusing for identifying deamidation, reverse-phase high-performance liquid chromatography (HPLC) for identifying oxidation, and size-exclusion HPLC for identifying aggregation. These stability assessments require essential processes that are destructive to the product tested. All these techniques are lab based and require sample removal from a sealed storage vial, which can breach the sterility. In this work, we investigate the heat- and surfactant-induced denaturation of an in-vial-stored model protein, bovine serum albumin (BSA), by analyzing its intrinsic fluorescence without removing the sample from the vial. A lab-based bespoke setup which can do the measurement in vial is used to demonstrate the change in fluorescence polarization of the protein to determine the denaturation level. The results obtained are compared to circular dichroism and size-exclusion HPLC measurements. The results prove that in-vial fluorescence measurements can be performed to monitor protein denaturation. A cost-effective portable solution to provide a top-level overview of biopharmaceutical product stability from manufacture to the point of patient administration can be further developed using the same technique.
Conflict of interest statement
The authors declare no competing financial interest.
Figures
Similar articles
-
Fluorescence lifetime and rotational correlation time of bovine serum albumin-sodium dodecyl sulfate complex labeled with 1-dimethylaminonaphthalene-5-sulfonyl chloride: effect of disulfide bridges in the protein on these fluorescence parameters.J Protein Chem. 1990 Feb;9(1):17-22. doi: 10.1007/BF01024979. J Protein Chem. 1990. PMID: 2340072
-
Secondary structural changes of large and small fragments of bovine serum albumin in thermal denaturation and in sodium dodecyl sulfate denaturation.J Protein Chem. 1993 Apr;12(2):223-8. doi: 10.1007/BF01026044. J Protein Chem. 1993. PMID: 8489708
-
Vibrational circular dichroism spectra of protein films: thermal denaturation of bovine serum albumin.Biophys Chem. 2004 Sep 1;111(1):73-7. doi: 10.1016/j.bpc.2004.04.005. Biophys Chem. 2004. PMID: 15450377
-
Protective effect of small amounts of sodium dodecyl sulfate on the helical structure of bovine serum albumin in thermal denaturation.J Colloid Interface Sci. 2003 Jan 1;257(1):41-6. doi: 10.1016/s0021-9797(02)00017-6. J Colloid Interface Sci. 2003. PMID: 16256454
-
Biophysical analysis of phaseolin denaturation induced by urea, guanidinium chloride, pH, and temperature.J Protein Chem. 1992 Jun;11(3):281-8. doi: 10.1007/BF01024867. J Protein Chem. 1992. PMID: 1388671
Cited by
-
Enhancing vaccine stability in transdermal microneedle platforms.Drug Deliv Transl Res. 2025 Apr 16. doi: 10.1007/s13346-025-01854-4. Online ahead of print. Drug Deliv Transl Res. 2025. PMID: 40240731 Review.
References
-
- Brenner V.Causes of Supply Chain Disruptions: An Empirical Analysis in Cold Chains for Food and Pharmaceuticals, 2015, pp 21–85.
-
- Khan S. A. R.; Razzaq A.; Yu Z.; Shah A.; Sharif A.; Janjua L. Disruption in Food Supply Chain and Undernourishment Challenges: An Empirical Study in the Context of Asian Countries. Soc. Econ. Plann. Sci. 2022, 82, 101033.10.1016/j.seps.2021.101033. - DOI
Publication types
MeSH terms
Substances
LinkOut - more resources
Full Text Sources
Miscellaneous
