. 2023 Feb;601(4):801-829.
doi: 10.1113/JP283566. Epub 2023 Jan 25.

Brainstem astrocytes control homeostatic regulation of caloric intake

Affiliations

Brainstem astrocytes control homeostatic regulation of caloric intake

Courtney Clyburn et al. J Physiol. 2023 Feb.

Abstract

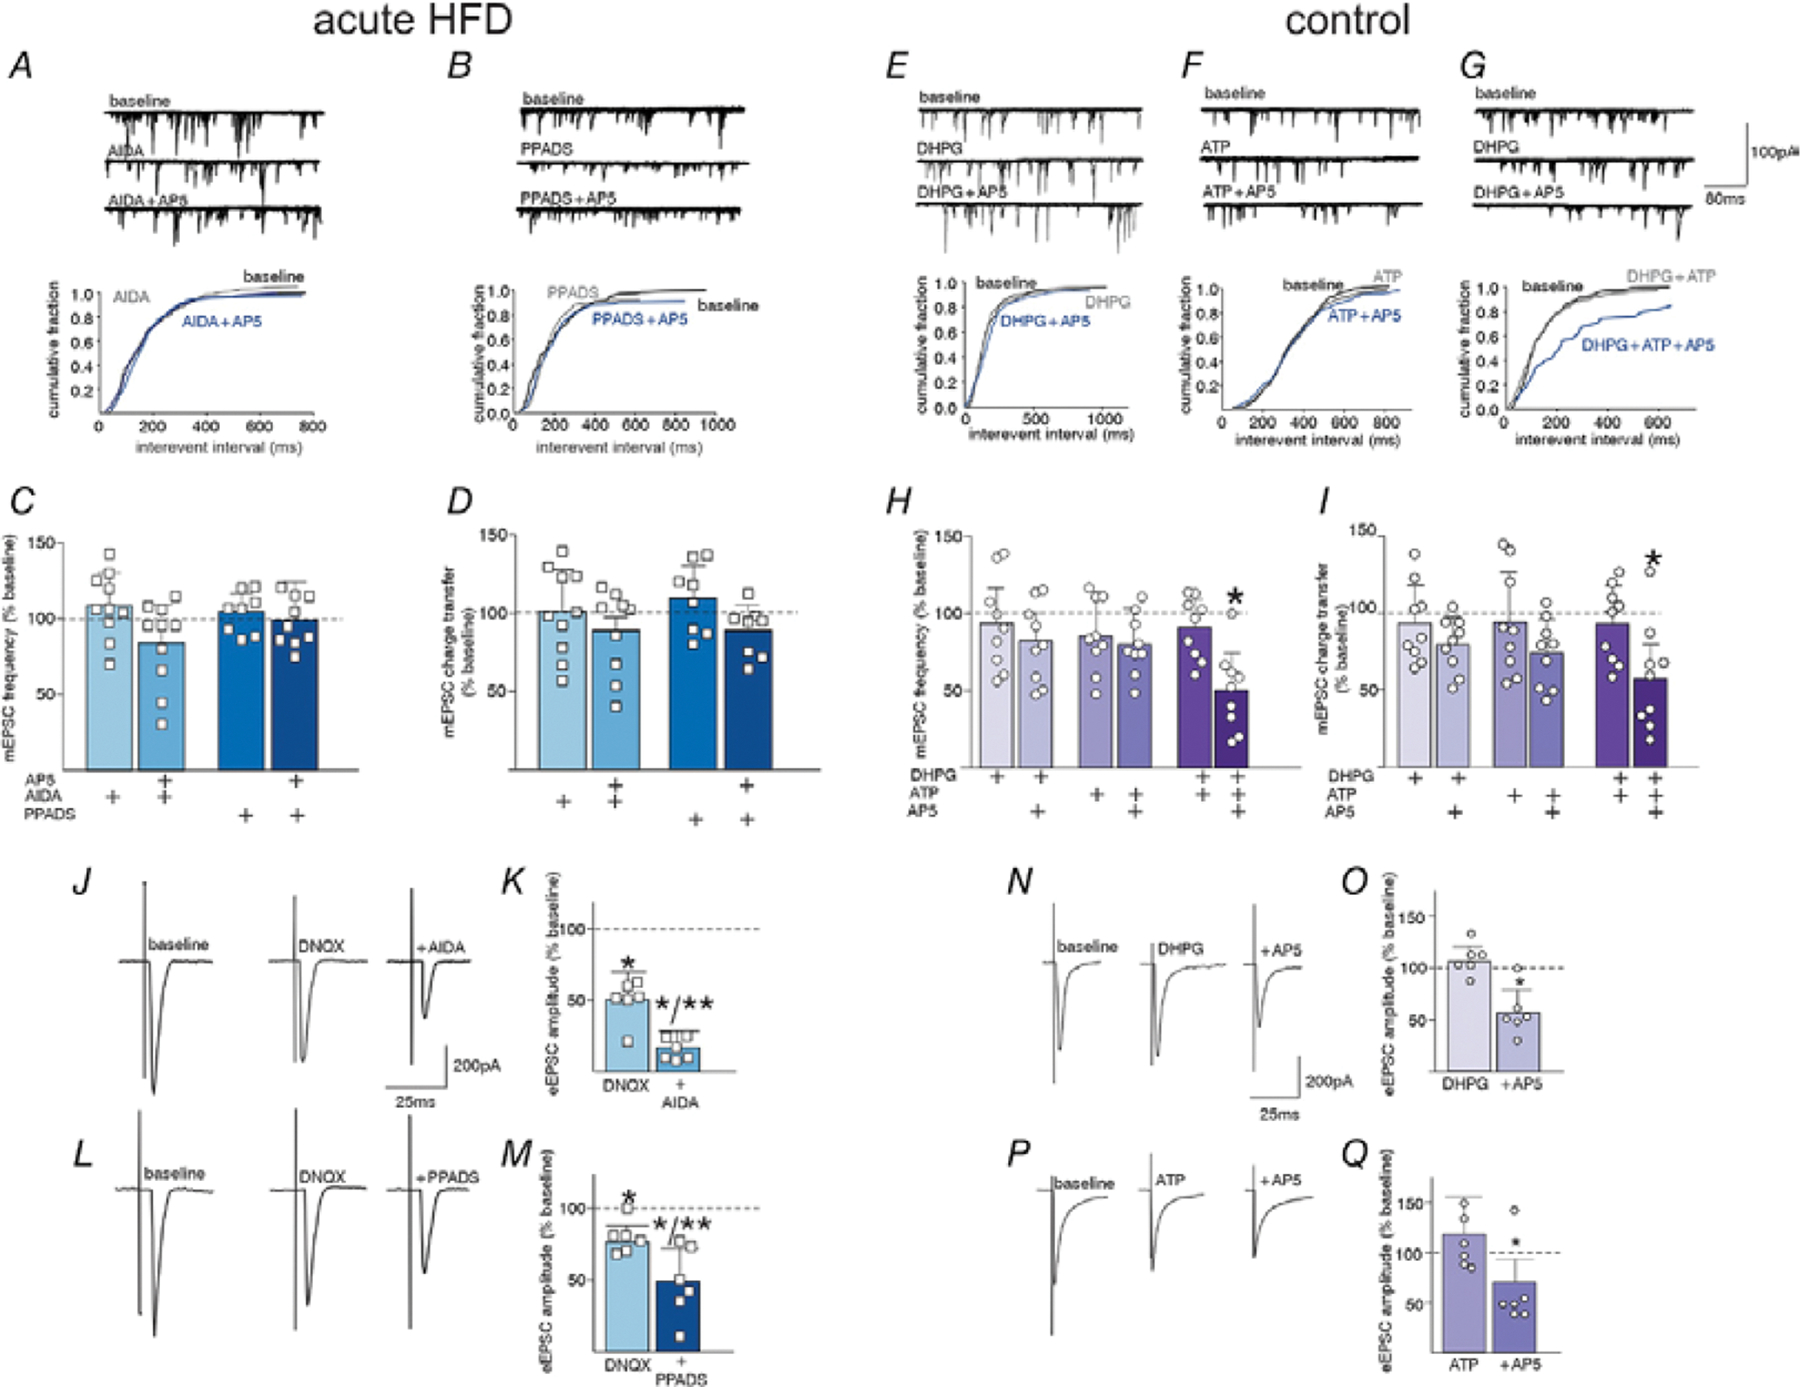
Prolonged high-fat diet (HFD) exposure is associated with hyperphagia, excess caloric intake and weight gain. After initial exposure to a HFD, a brief (24-48 h) period of hyperphagia is followed by the regulation of caloric intake and restoration of energy balance within an acute (3-5 day) period. Previous studies have demonstrated this occurs via a vagally mediated signalling cascade that increases glutamatergic transmission via activation of NMDA receptors located on gastric-projecting neurons of the dorsal motor nucleus of the vagus (DMV). The present study used electrophysiological recordings from thin brainstem slice preparations, in vivo recordings of gastric motility and tone, measurement of gastric emptying rates, and food intake studies to investigate the hypothesis that activation of brainstem astrocytes in response to acute HFD exposure is responsible for the increased glutamatergic drive to DMV neurons and the restoration of caloric balance. Pharmacological and chemogenetic inhibition of brainstem astrocytes reduced glutamatergic signalling and DMV excitability, dysregulated gastric tone and motility, attenuated the homeostatic delay in gastric emptying, and prevented the decrease in food intake that is observed during the period of energy regulation following initial exposure to HFD. Understanding the mechanisms involved in caloric regulation may provide critical insights into energy balance as well as into the hyperphagia that develops as these mechanisms are overcome. KEY POINTS: Initial exposure to a high fat diet is associated with a brief period of hyperphagia before caloric intake and energy balance is restored. This period of homeostatic regulation is associated with a vagally mediated signalling cascade that increases glutamatergic transmission to dorsal motor nucleus of the vagus (DMV) neurons via activation of synaptic NMDA receptors. The present study demonstrates that pharmacological and chemogenetic inhibition of brainstem astrocytes reduced glutamatergic signalling and DMV neuronal excitability, dysregulated gastric motility and tone and emptying, and prevented the regulation of food intake following high-fat diet exposure. Astrocyte regulation of glutamatergic transmission to DMV neurons appears to involve release of the gliotransmitters glutamate and ATP. Understanding the mechanisms involved in caloric regulation may provide critical insights into energy balance as well as into the hyperphagia that develops as these mechanisms are overcome.

Keywords: NMDA receptor; astrocyte; feeding; gastroenterology; high fat diet; neurophysiology; neuroplasticity; obesity.


Conflict of interest statement

Declaration of Interests

The authors declare no competing interests

Figures

Figure 1:
Figure 1:. Acute HFD modulates the neurochemical phenotype of brainstem astrocytes
A. A schematic diagram illustrating the experimental timeline. Rats (N=5–8 per time point) were exposed to a HFD for 1, 3, 5, and 14d prior to tissue fixation and processing for immunohistochemical localization of GFAP-immunoreactivity (-IR; green; labelling activated astrocytes) or ChAT-IR (magenta; labelling cholinergic neurons). Brainstems were harvested from rats on a control diet at each time point at the same time as the HFD samples (N=6–8 per time point). B. Representative higher magnification images of the DVC in control (upper) and following 3d of acute HFD exposure (lower) illustrating GFAP (left) and GFAP+ChAT co-localization (right). Scale bar = 50μm. C. Graphical representation of GFAP-IR in the left and right DMV of control and HFD rats at 1, 3, 5, and 14d of HFD exposure. In the HFD group, GFAP mean fluorescence intensity was significantly increased at 3 and 5d compared to 1 or 14d. In addition, there was a significant difference in GFAP mean fluorescence intensity between control and HFD rats at day 3 and day 5 (multivariate ANOVA with targeted contrasts: *p<0.05, one-way ANOVA with post-hoc Bonferroni multiple comparison test, N=5–8 per time point. Data are represented as mean±SD). D. Graphical representation of GFAP-IR in the left and right NTS of control and HFD rats at 1, 3, 5, and 14d of HFD exposure. (*p<0.05, one way ANOVA with post-hoc Bonferroni multiple comparison test). E. Representative images of GFAP and GFAP+ChAT (left and right image in each set, respectively) DVC in control (left) and time matched HFD (right) rats at 1, 3, and 14d (top to bottom, respectively). Images were taken at the same confocal settings for comparison between groups. White scale bar = 150μm. AP = area postrema, CC = central canal, NTS = nucleus tractus solitarius, DMV = dorsal motor nucleus of the vagus
Figure 2:
Figure 2:. The acute HFD-induced regulation of caloric intake is dependent upon activation of DVC astrocytes.
A. A schematic diagram illustrating the experimental timeline investigating the effects of pharmacological inhibition of astrocytes on food intake B. 4th ventricular application of FA (N=6 rats) attenuated the homeostatic regulation of daily caloric intake (left) and total caloric intake (right). Total caloric intake (area under the curve: AUC) in 1–5d of HFD exposure was significantly increased following 4th ventricular application of FA compared to PBS controls (N=6 rats). p<0.05, two-tailed unpaired Student’s T-Test. Data are represented as mean ± SEM. C. A schematic diagram illustrating the experimental timeline for the chemogenetic food intake study. D. CNO treatment in GFAP-hM4DGi transfected rats (N=6) inhibited the homeostatic regulation of daily caloric intake (left) and total caloric intake (AUC; right) compared to empty vector rats treated with CNO (N=6) and GFAP-hM4DGi rats treated with clozapine (N=6) *p<0.05, one-way ANOVA with post-hoc Bonferroni multiple comparison test. Data are represented as mean ± SD. E. Representative images of GFAP (left) GFAP-hM4DGi (middle) and their co-localization (right) in the DMV of a rat after 3dd of HFD exposure. Scale bar = 50μm.
Figure 3:
Figure 3:. Acute HFD-induced delay in gastric emptying is dependent upon activation of DVC astrocytes
A. A schematic diagram illustrating the experimental timeline in which the 13C octanoic acid breath test technique was used to assess the acute HFD-mediated delay in gastric emptying following chemogenetic inhibition of DVC astrocytes (GFAP-hM4DGi + CNO, N=7 rats, empty vector + CNO = 6 rats, GFAP-hM4DGi + clozapine, N=7 rats). Gastric emptying measurements were made at 1, 4, and 9d of HFD exposure. B. Representative gastric emptying curves of empty vector+CNO (left) and GFAP-hM4DGi+clozapine (middle) rats (middle) as well as GFAP-hM4DGi+CNO rats (right) at 1 (black) 4 (purple) and 9d (grey) of HFD exposure. Vertical lines indicate T1/2. C. Graphical representation of gastric emptying time (T1/2) at 1 (closed), 4 (check), and 9d (open)of HFD exposure in empty vector+CNO (left; N=6), GFAP-hM4DGi+clozapine (middle; N=7), and in GFAP-hM4DGi+CNO rats (right; N=7). Gastric emptying rates at day 4 of HFD exposure were significantly delayed in empty vector+CNO and GFAP-hM4DGi+clozapine rats compared to 1d of HFD exposure. In contrast, there was no difference in gastric emptying time in GFAP-hM4DGi+CNO rats. Dashed line indicates 125% of baseline. Two-way ANOVA with targeted contrasts: *p<0.05, one-way ANOVA with post-hoc Bonferroni multiple comparison test. Data are represented as mean±SD. D. Graphical representation of the proportion of rats that exhibited a significant delay in gastric emptying after 4d of HFD exposure. The proportion (%) of GFAP-hM4DGi +CNO rats that exhibited a significant delay in gastric emptying at 4d of HFD exposure (>25% of baseline) was significantly decreased compared to empty vector+CNO and GFAP-hM4DGi+clozapine rats. *p<0.05, Pearson χ2-test for independence
Figure 4:
Figure 4:. Acute HFD-induced modulation of gastric tone and motility is dependent upon activation of DVC astrocytes
A. A schematic diagram illustrating the experimental timeline in which the effects of chemogenetic inhibition of DVC astrocytes to modulate gastric motility and tone were assessed. B. Micrograph illustrating post-hoc identification of microinjection site. C. Representative traces illustrating the effects of KynA on gastric tone and motility following acute HFD exposure in the antrum (left) and corpus (right) in GFAP-hM4DGi rats. Note that 4th ventricular application of CNO attenuated the KynA-mediated decrease in gastric motility and while clozapine had no effect. D. Graphical representation of the effects of DVC microinjection of KynA following 4th ventricular application of CNO or clozapine in GFAP-hM4DGi rats (N=7). CNO significantly attenuated the KynA-mediated decrease in all gastric measures compared to KynA alone while clozapine had no significant effect. *p<0.05, one-way ANOVA with post-hoc Bonferroni multiple comparison test. Data are represented as mean ± SD. E. Representative traces of the effects of KynA on gastric tone and motility following acute HFD exposure in the antrum (left) and corpus (right) in empty vector rats. Note that 4th ventricular application of CNO had no effect on the KynA-mediated decrease in gastric motility and tone. F. Graphical representation of the effects of KynA following 4th ventricular application of CNO in empty vector control rats (N=5). Following acute HFD exposure, DVC microinjection of KynA produced a significant decrease in antrum (top) and corpus (bottom) motility (left) and tone (right). No significant differences were observed between CNO and KynA and KynA alone in any gastric measure. *p<0.05, two-tailed paired Student’s T-Tests. Data are represented as mean ± SD.
Figure 5:
Figure 5:. Effects of FA and AP5 on mEPSCs from gastric-projecting DMV neurons
A. A schematic diagram illustrating the experimental design for experiments in which the effects of pharmacological inhibition of astrocytes was assessed on DMV neurons. B. AP5 had no effect on mEPSC frequency in a control DMV neuron voltage clamped at −50mV (summarized in the cumulative fraction graph to the right). C. AP5 decreased mEPSC frequency in an acute HFD DMV neuron (summarized in the cumulative fraction graph to the right). D, E. Graphical summary of the effects of AP5 on mEPSCs frequency (D) and charge transfer (E) in control (black) and acute HFD (blue) DMV neurons. AP5 had no effect on mEPSC frequency and charge transfer in control DMV neurons (N=12 neurons from 4 rats), but decreased mEPSC frequency and charge transfer in acute HFD DMV neurons (N=20 neurons from 8 rats; *p<0.05, two-tailed unpaired Student’s T-Test. Data are represented as mean ± SD. F. Acute perfusion with FA decreased mEPSC frequency and occluded the inhibitory effect of subsequent perfusion with AP5 in an acute HFD DMV neuron (summarized in the sample cumulative fraction graph, right). G. In contrast, acute perfusion with FA had no effect on mEPSC frequency in a control DMV neuron (summarized a sample cumulative fraction graph, right). H. Graphical summary of the time-dependent effects of acute perfusion with FA to decrease mEPSC frequency in acute HFD (N=8 neurons from 3 rats), but not control DMV neurons (N=6 neurons from 4 rats). Note that FA perfusion occluded the effects of subsequent application of AP5 to inhibit mEPSCs in acute HFD neurons. I, J, Graphical summary of the effects of FA to reduce mEPSC frequency (I) and charge transfer (J) in acute HFD (N=8 from 4 rats) but not control (N=6 from 3 rats) DMV neurons. FA also occluded the effects of subsequent AP5 application to reduce mEPSC frequency and charge transfer in HFD DMV neurons. *p<0.05, one-way ANOVA with post-hoc Bonferroni multiple comparison test. Data are represented as mean ± SD. K, L, Graphical summary of the effects of AP5 to decrease mEPSC frequency (K) and charge transfer (L) in acute HFD neurons following pharmacological inhibition of brainstem astrocytes. Following both acute (20min; light blue) and long-term (1–2hr pre-incubation; dark blue) perfusion with FA, AP5 was no longer able to inhibit mEPSC frequency and charge transfer; there was no significant difference between acute FA and FA pre-incubation (acute FA, N=8 neurons from 4 rats. FA pre-incubation, N=8 neurons from 3 rats). M, N, Graphical summary of the effects of FA to inhibit NMDA mEPSC frequency (M) and charge transfer (N). Following perfusion with DNQX which itself decreased mEPSC frequency and charge transfer, perfusion with FA decreased the frequency and charge transfer of NMDA mEPSCs (*p<0.05, two-tailed unpaired Student’s T-Test. Data are represented as mean ± SD).
Figure 6:
Figure 6:. Pharmacological inhibition of astrocytes attenuates evoked activation of NMDA receptors in acute HFD DMV neurons
A. Electrical stimulation of the adjacent NTS was used to evoke EPSCs (eEPSCs) in control DMV neurons voltage clamped at =−50mV. Perfusion with AP5 had no effect on eEPSC amplitude, but further addition of DNQX abolished evoked glutamatergic transmission. B. In an acute HFD DMV neuron, perfusion with AP5 significantly inhibited eEPSC amplitude, which was abolished completely by further addition of DNQX. C. Graphical summary of the effects of AP5 and DNQX to inhibit glutamatergic transmission in control and acute HFD DMV neurons. Two-way ANOVA with targeted contrasts: *p<0.05, two-tailed paired Student’s T-Test. Data are represented as mean±SD. D. In an acute HFD DMV neuron, perfusion with DNQX decreased, but did not abolish, eEPSC amplitude (middle). Subsequent perfusion with FA decreased the amplitude of the remaining NMDA-receptor mediated eEPSC (right). E. Graphical summary of the effects of FA to inhibit NMDA receptor mediated currents in acute HFD DMV neurons (N=6 neurons from 3 rats). *p<0.05, two-tailed unpaired Student’s T-Test. Data are represented as mean±SD
Figure 7:
Figure 7:. Pharmacological inhibition of astrocytes attenuates the NMDA-mediated effects to increase DMV neuronal excitability following acute HFD
A. In an acute HFD neuron current clamped at a membrane potential to allow spontaneous action potential (AP) firing frequency of approximately 1 pulse per second (pps), perfusion with AP5 caused a reversible decrease in AP firing rate. B. Perfusion with FA decreased AP firing frequency in an acute HFD DMV neuron. C. In the presence of FA, and after readjustment of the membrane potential to restore AP firing rate, subsequent perfusion with AP5 had no effect on AP firing rate. D. Graphical summary illustrating the effects of AP5 and FA to decrease AP firing rate (N=7 neurons from 3 rats for each); FA occluded the ability of subsequent application of AP5 to decreased AP firing rate (N=6 neurons from 3 rats). *p<0.05, two-tailed paired Students T-test. Data are represented as mean ± SD. E. FA microinjection into the left DMV decreased astrocyte activation in the DMV as assessed by GFAP-IR (left, magenta) and GFAP + ChAT (right, green) in the rostral (upper) and intermediate (lower) DMV. Scale bar = 150μm. F. After electrophysiological recording, Neurobiotin was injected into DMV neurons to allow post-hoc localization of neuronal morphology (green) relative to astrocytes (GFAP-IR, magenta). Note the dense network of astrocytes surrounding the recorded neurons. Scale bare = 50μm.
Figure 8:
Figure 8:. Chemogenetic inhibition of astrocytes attenuates the acute HFD-induced activation of NMDA receptors
A. Perfusion with CNO had no effect on mEPSC frequency, and did not attenuate the actions of AP5 to decrease glutamatergic transmission (summarized cumulative fraction graph below), in an acute HFD DMV neuron following transfection with the empty DREADD vector. B. Perfusion with clozapine had no effect on mEPSC frequency, and did not attenuate the actions of AP5 to decrease glutamatergic transmission (summarized cumulative fraction graph below), in an acute HFD DMV neuron following GFAP-hM4DGi transfection. C. In contrast, in the GFAP-hM4DGi transfected DMV of an acute HFD rat, perfusion with CNO decreased mEPSC frequency, and occluded subsequent inhibitory actions of AP5 (summarized in the cumulative fraction graph below). D. Perfusion with the selective synaptic NMDA receptor antagonist, MK801 decreased mEPSC frequency and occluded the effects of subsequent application of CNO to decrease glutamatergic transmission (summarized in the cumulative fraction graph below) in an acute HFD DMV neuron from a GFAP-hM4DGi transfected rat F. G. Graphical summary of the effects of chemogenetic inhibition of astrocytes and AP to inhibit mEPSC frequency (F) and charge transfer (G) in acute HFD DMV neurons from empty vector+CNO (N=9 neurons from 4 rats), GFAP-hM4DGi+clozapine (N= 9 neurons from 4 rats), GFAP-hM4DGi+CNO transfected rats (N=8 neurons from 6 rats) as well as the effects of MK801 to occlude subsequent actions of CNO in GFAP-hM4DGi transfected rats (N= 8 neurons from 6 rats). Two-way ANOVA with targeted contrasts: #p<0.05, one-way ANOVA with post-hoc Bonferroni multiple comparison test, *p<0.05, two-tailed unpaired Student’s T-Test. Data are represented as mean±SD. G. In an empty vector transfected acute HFD rat, a DMV neuron was current clamped at a potential that allowed spontaneous action potential (AP) firing of approximately 1 pulse per second (p.p.s). CNO perfusion had no effect on AP firing rate and did not prevent subsequent application of AP5 to inhibit firing. H Similarly, in a GFAP-hM4DGi transfected acute HFD DMV neuron, clozapine perfusion had no effect on AP firing rate and did not affect the ability of AP5 to decrease firing frequency. I. In contrast, in a GFAP-hM4DGi transfected rat, perfusion with CNO decreased AP firing; following adjustment of the membrane potential to restore action potential firing rate (arrow), subsequent application of AP5 had no effect on firing rate. J. Graphical summary of the effects of chemogenetic inhibition of DVC astrocytes on AP firing in acute HFD DMV neurons from empty vector+CNO (N=7 neurons from 4 rats), GFAP-hM4DGi+clozapine (N=6 neurons from 5 rats), and GFAP-hM4DGi+CNO transfected rats (N=6 neurons from 4 rats). Two-way ANOVA with targeted contrasts: #p<0.05, one-way ANOVA with post-hoc Bonferroni multiple comparison test, *p<0.05, two-tailed unpaired Student’s T-Test. Data are represented as mean±SD).
Figure 9:
Figure 9:. Acute HFD-induced activation of NMDA receptors is dependent upon activation of metabotropic glutamate and purinergic receptors.
A. In an acute HFD DMV neuron, perfusion with the group I mGluR receptor antagonist, AIDA, prevented AP5 from decreasing mEPSC frequency (summarized by the cumulative fraction graph below). B. Similarly, perfusion with the P2X receptor antagonist, PPADS prevented the ability of AP5 to decease mEPSC frequency (summarized in the cumulative fraction graph below). C, D. Graphical summary of the effects of antagonists to block AP5 mediated effects on mEPSC frequency (C.) and charge transfer (D.) (N=10 neurons from 6 rats and N=8 neurons from 3 rats for AIDA and PPADS, respectively; two-way ANOVA with targeted contrasts: *p<0.05, one-way ANOVA with post-hoc Bonferroni multiple comparison test or two-tailed paired Student’s T-Test. Data are represented as mean±SD). E. In a control DMV neuron, perfusion with DHPG did not uncover any AP5-mediated decrease in mEPSC frequency (cumulative fraction graph below). F. Similarly, perfusion with the ATP did not uncover any AP5-mediated decrease in mEPSC frequency (cumulative fraction graph below). G. In contrast, perfusion both DHPG and ATP uncovered inhibitory effects of AP5 (cumulative fraction graph below). H. I. Graphical summary of the effects of agonists perfusion to uncover AP5 mediated inhibition of mEPSC frequency (H.) and charge transfer (I.) (DHPG, 3/9 neurons from 3 rats; ATP, 5/9 neurons from 3 rats; DHPG+ATP 8/9 neurons from 3 rats. Two-way ANOVA with targeted contrasts: *p<0.05, one-way ANOVA with post-hoc Bonferroni multiple comparison test or two-tailed paired Student’s T-Test. Data are represented as mean±SD). J. In an acute HFD DMV neuron, perfusion with DNQX was used to isolate an NMDA receptor mediated glutamate current, which was inhibited by subsequent perfusion with AIDA. K. Graphical summary of the effects of a AiDA to block NMDA receptor mediated eEPSCs. (N=6 neurons from 4 rats) L. Perfusion with DNQX decreased eEPSC amplitude and subsequent perfusion with PPADS inhibited the remaining evoked NMDA current. M. Graphical summary of the effects of PPADS to block NMDA receptor mediated eEPSCs (N=6 neurons from 3 rats). N. In a control DMV neuron, perfusion with DHPG uncovered the ability of AP5 to inhibit NMDA receptor mediated eEPSCs. O. Graphical summary of the effects of the DHPG, to uncover NMDA receptor mediated transmission in control DMV neurons (N=6 neurons from 3 rats; *p<0.05, two-tailed paired Student’s T-Test. Data are represented as mean±SD). P. In a control DMV neuron, perfusion with ATP uncovered the ability of AP5 to inhibit NMDA receptor mediated eEPSCs. Q. Graphical summary of the effects of ATP, to uncover NMDA receptor mediated transmission in control DMV neurons. (N=6 neurons from 3 rats) *p<0.05, two-tailed paired Student’s T-Test. Data are represented as mean±SD

Comment in

Similar articles

Cited by

References

    1. Accorsi-Mendonca D, Bonagamba LGH & Machado BH. (2019). Astrocytic modulation of glutamatergic synaptic transmission is reduced in NTS of rats submitted to short-term sustained hypoxia. J Neurophysiol 121, 1822–1830. - PubMed
    1. Agulhon C, Petravicz J, McMullen AB, Sweger EJ, Minton SK, Taves SR, Casper KB, Fiacco TA & McCarthy KD. (2008). What is the role of astrocyte calcium in neurophysiology? Neuron 59, 932–946. - PMC - PubMed
    1. Angulo MC, Kozlov AS, Charpak S & Audinat E. (2004). Glutamate released from glial cells synchronizes neuronal activity in the hippocampus. J Neurosci 24, 6920–6927. - PMC - PubMed
    1. Araque A, Carmignoto G, Haydon PG, Oliet SH, Robitaille R & Volterra A. (2014). Gliotransmitters travel in time and space. Neuron 81, 728–739. - PMC - PubMed
    1. Astiz M, Pernia O, Barrios V, Garcia-Segura LM & Diz-Chaves Y. (2017). Short-Term High-Fat Diet Feeding Provides Hypothalamic but Not Hippocampal Protection against Acute Infection in Male Mice. Neuroendocrinology 104, 40–50. - PubMed

Publication types

Substances