

Performance of Statistical and Machine Learning Risk Prediction Models for Surveillance Benefits and Failures in Breast Cancer Survivors
- PMID: 36697364
- PMCID: PMC10073265
- DOI: 10.1158/1055-9965.EPI-22-0677
Performance of Statistical and Machine Learning Risk Prediction Models for Surveillance Benefits and Failures in Breast Cancer Survivors
Abstract
Background: Machine learning (ML) approaches facilitate risk prediction model development using high-dimensional predictors and higher-order interactions at the cost of model interpretability and transparency. We compared the relative predictive performance of statistical and ML models to guide modeling strategy selection for surveillance mammography outcomes in women with a personal history of breast cancer (PHBC).
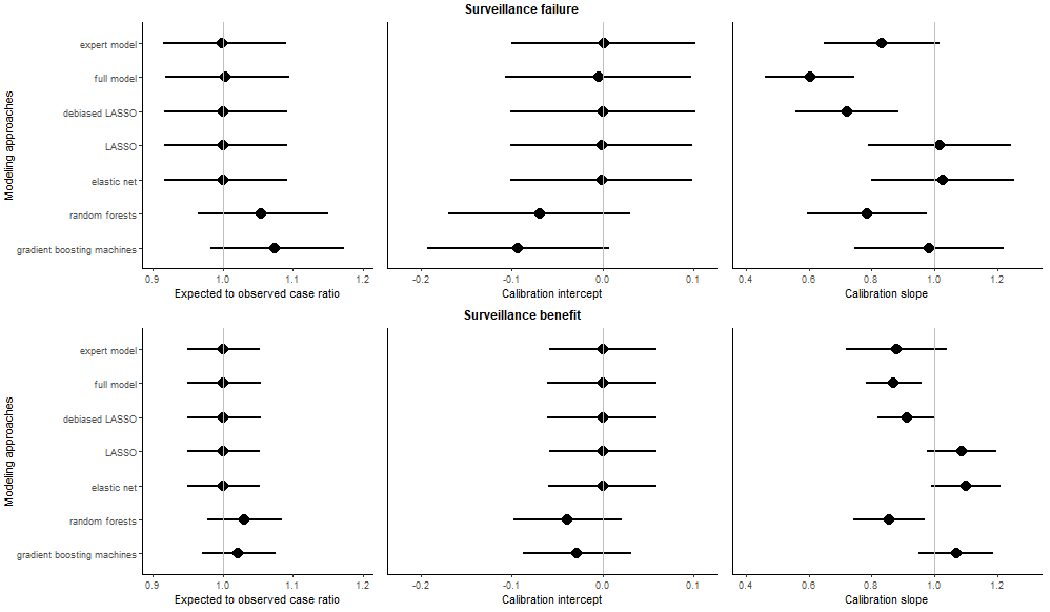
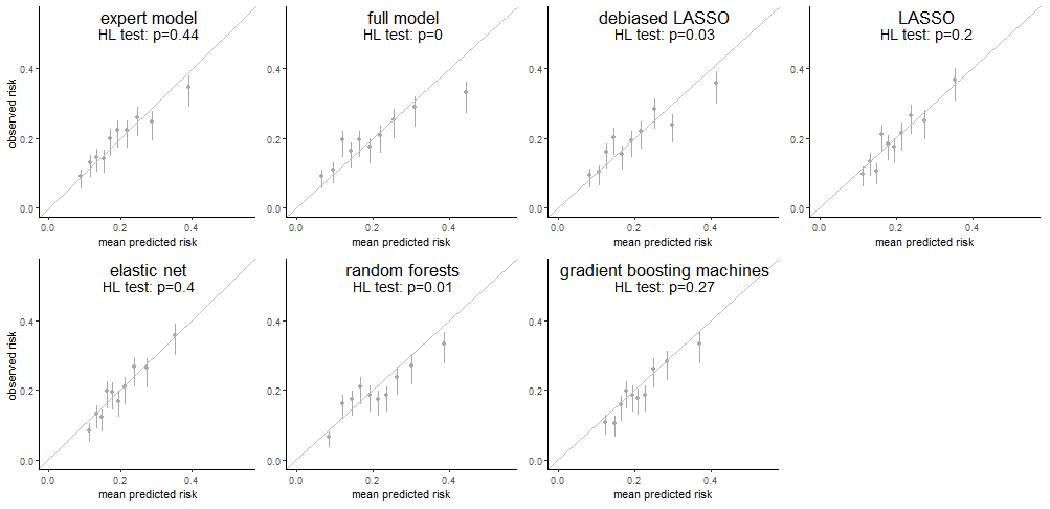
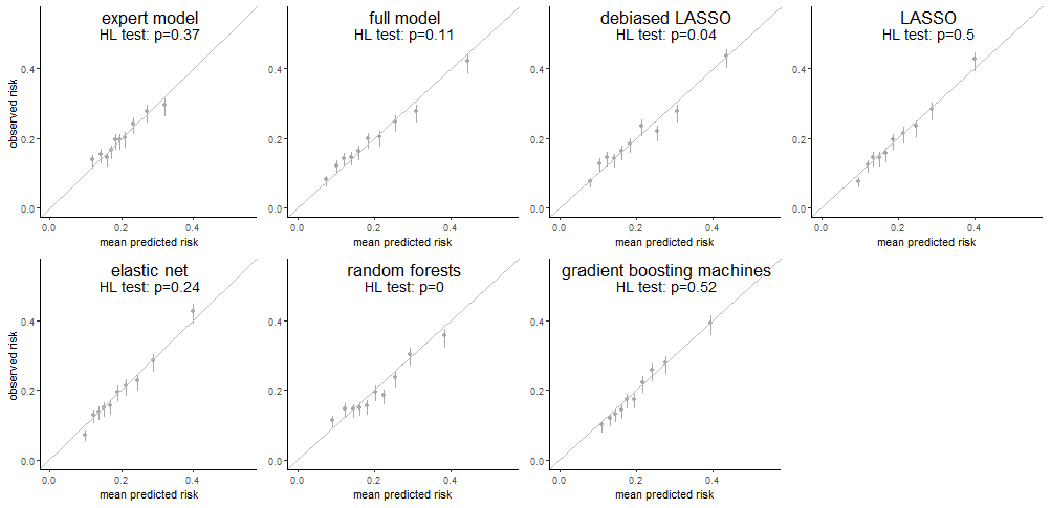
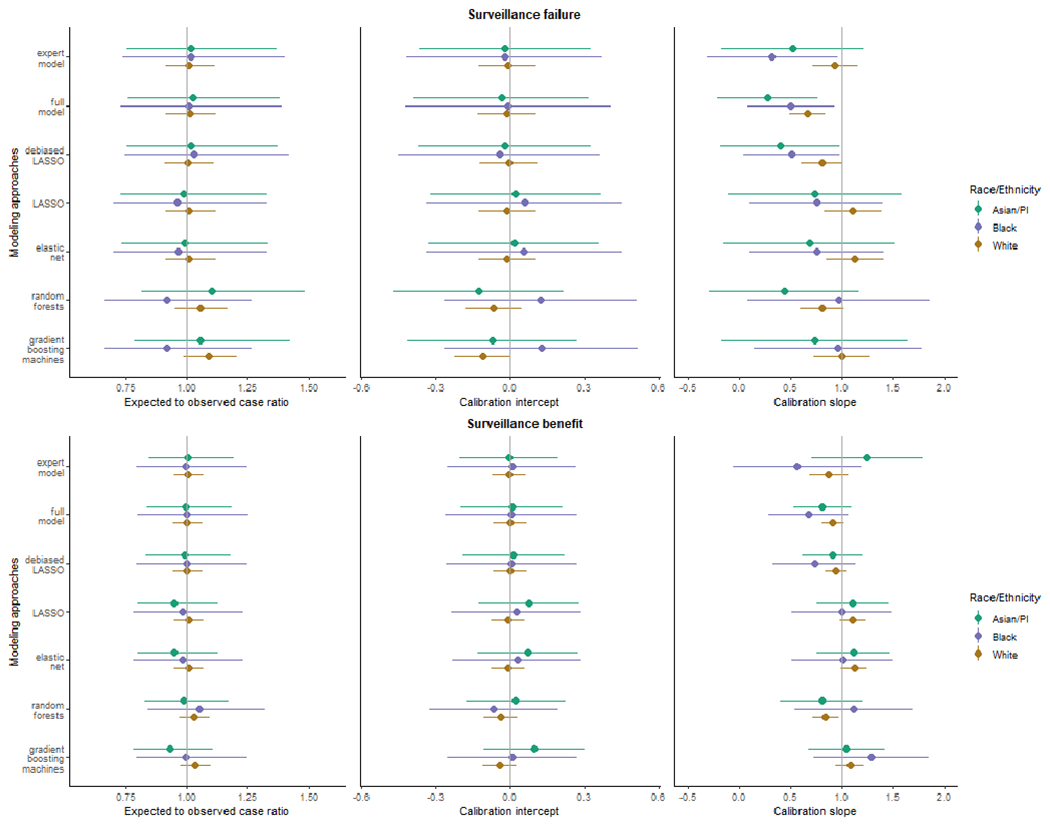
Methods: We cross-validated seven risk prediction models for two surveillance outcomes, failure (breast cancer within 12 months of a negative surveillance mammogram) and benefit (surveillance-detected breast cancer). We included 9,447 mammograms (495 failures, 1,414 benefits, and 7,538 nonevents) from years 1996 to 2017 using a 1:4 matched case-control samples of women with PHBC in the Breast Cancer Surveillance Consortium. We assessed model performance of conventional regression, regularized regressions (LASSO and elastic-net), and ML methods (random forests and gradient boosting machines) by evaluating their calibration and, among well-calibrated models, comparing the area under the receiver operating characteristic curve (AUC) and 95% confidence intervals (CI).
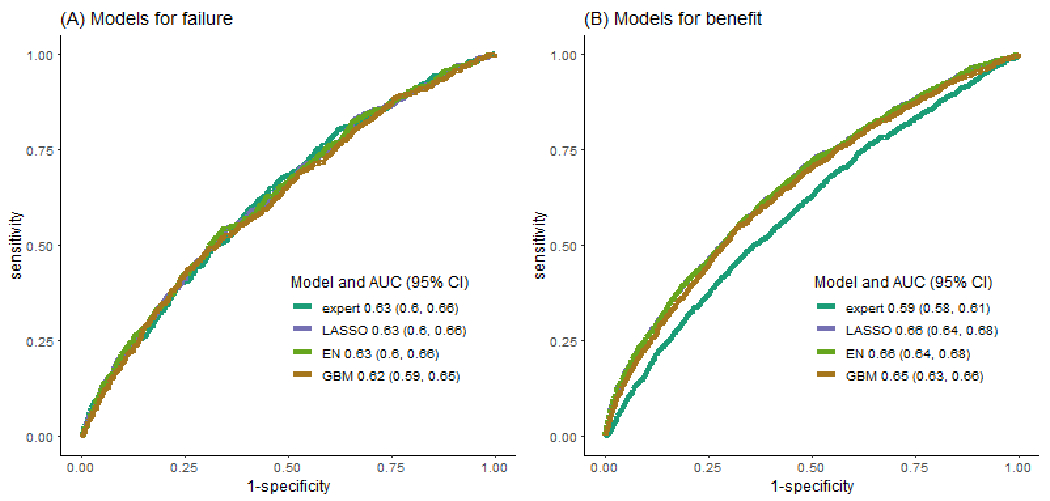
Results: LASSO and elastic-net consistently provided well-calibrated predicted risks for surveillance failure and benefit. The AUCs of LASSO and elastic-net were both 0.63 (95% CI, 0.60-0.66) for surveillance failure and 0.66 (95% CI, 0.64-0.68) for surveillance benefit, the highest among well-calibrated models.
Conclusions: For predicting breast cancer surveillance mammography outcomes, regularized regression outperformed other modeling approaches and balanced the trade-off between model flexibility and interpretability.
Impact: Regularized regression may be preferred for developing risk prediction models in other contexts with rare outcomes, similar training sample sizes, and low-dimensional features.
©2023 American Association for Cancer Research.
Conflict of interest statement
The following authors have potential conflicts of interest; Dr. Diana Buist: Athena WISDOM Study Data Safety and Monitoring Board (2015-present); Dr. Janie M Lee: Research Grant from GE Healthcare (11/15/2016-12/31/2020), Consulting agreement with GE Healthcare (2017 only); Dr. Diana Miglioretti: Honorarium from Society for Breast Imaging for keynote lecture in April 2019. Royalties from Elsevier; Dr. Karla Kerlikowske: Non-paid consultant for Grail on the STRIVE study (2017-present). No other disclosures were reported.
Figures
Similar articles
-
Predicting five-year interval second breast cancer risk in women with prior breast cancer.J Natl Cancer Inst. 2024 Jun 7;116(6):929-937. doi: 10.1093/jnci/djae063. J Natl Cancer Inst. 2024. PMID: 38466940 Free PMC article.
-
Breast Biopsy Intensity and Findings Following Breast Cancer Screening in Women With and Without a Personal History of Breast Cancer.JAMA Intern Med. 2018 Apr 1;178(4):458-468. doi: 10.1001/jamainternmed.2017.8549. JAMA Intern Med. 2018. PMID: 29435556 Free PMC article.
-
Deep learning modeling using normal mammograms for predicting breast cancer risk.Med Phys. 2020 Jan;47(1):110-118. doi: 10.1002/mp.13886. Epub 2019 Nov 19. Med Phys. 2020. PMID: 31667873 Free PMC article.
-
A Machine Learning Approach to Predicting Need for Hospitalization for Pediatric Asthma Exacerbation at the Time of Emergency Department Triage.Acad Emerg Med. 2018 Dec;25(12):1463-1470. doi: 10.1111/acem.13655. Epub 2018 Nov 29. Acad Emerg Med. 2018. PMID: 30382605
-
Mammographic surveillance in women with a personal history of breast cancer: how accurate? How effective?Breast. 2010 Dec;19(6):439-45. doi: 10.1016/j.breast.2010.05.010. Epub 2010 Jun 12. Breast. 2010. PMID: 20547457 Review.
Cited by
-
Predicting five-year interval second breast cancer risk in women with prior breast cancer.J Natl Cancer Inst. 2024 Jun 7;116(6):929-937. doi: 10.1093/jnci/djae063. J Natl Cancer Inst. 2024. PMID: 38466940 Free PMC article.
-
Sources of Disparities in Surveillance Mammography Performance and Risk-Guided Recommendations for Supplemental Breast Imaging: A Simulation Study.Cancer Epidemiol Biomarkers Prev. 2023 Nov 1;32(11):1531-1541. doi: 10.1158/1055-9965.EPI-23-0330. Cancer Epidemiol Biomarkers Prev. 2023. PMID: 37351916 Free PMC article.
-
Development and validation of prediction models for sentinel lymph node status indicating postmastectomy radiotherapy in breast cancer: population-based study.BJS Open. 2025 Mar 4;9(2):zraf047. doi: 10.1093/bjsopen/zraf047. BJS Open. 2025. PMID: 40197824 Free PMC article.
