. 2023 Jan 26;14(1):417.
doi: 10.1038/s41467-023-36121-y.

Mapping lesion-specific response and progression dynamics and inter-organ variability in metastatic colorectal cancer

Affiliations

Mapping lesion-specific response and progression dynamics and inter-organ variability in metastatic colorectal cancer

Jiawei Zhou et al. Nat Commun. .

Abstract

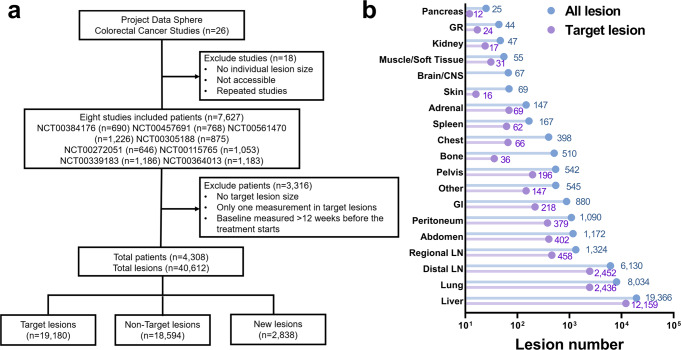
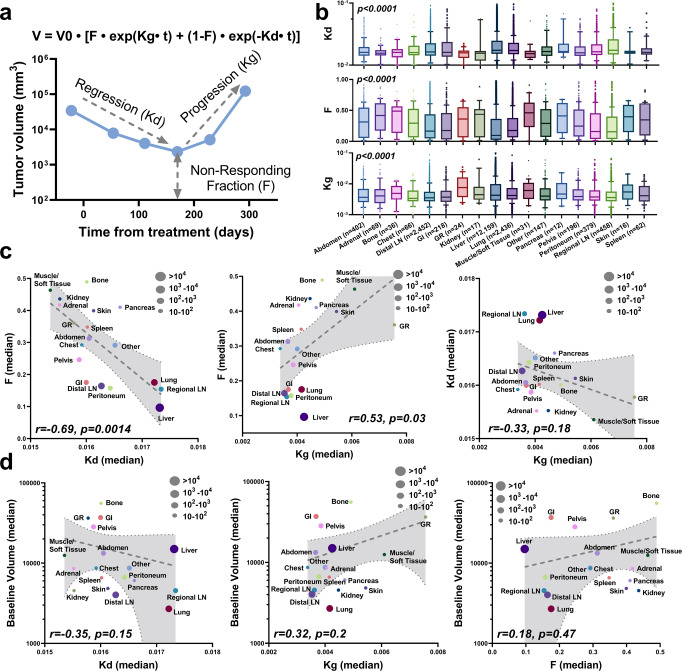
Achieving systemic tumor control across metastases is vital for long-term patient survival but remains intractable in many patients. High lesion-level response heterogeneity persists, conferring many dissociated responses across metastatic lesions. Most studies of metastatic disease focus on tumor molecular and cellular features, which are crucial to elucidating the mechanisms underlying lesion-level variability. However, our understanding of lesion-specific heterogeneity on the macroscopic level, such as lesion dynamics in growth, response, and progression during treatment, remains rudimentary. This study investigates lesion-specific response heterogeneity through analyzing 116,542 observations of 40,612 lesions in 4,308 metastatic colorectal cancer (mCRC) patients. Despite significant differences in their response and progression dynamics, metastatic lesions converge on four phenotypes that vary with anatomical site. Importantly, we find that organ-level progression sequence is closely associated with patient long-term survival, and that patients with the first lesion progression in the liver often have worse survival. In conclusion, our study provides insights into lesion-specific response and progression heterogeneity in mCRC and creates impetus for metastasis-specific therapeutics.


Conflict of interest statement

The authors declare no competing interests.

Figures

Fig. 1
Fig. 1. Data source.
a CONSORT diagram of metastatic colorectal cancer data inclusion and exclusion criteria. b The number of all lesions (target, non-target, and new) and target lesions across organs. GR Genitourinary and Reproductive, CNS Central nervous system, GI Gastrointestinal tract, LN Lymph nodes. Source data are provided as a Source Data file.
Fig. 2
Fig. 2. Tumor response dynamics were recapitulated by modeling.
a Schematic plot of tumor growth model. b Box plots of model parameters Kd, F and Kg across organs. Significance was calculated using Kruskal-Wallis tests. The box extends from the 25th to 75th percentiles and the line in the middle is plotted as the median. The whiskers are drawn down to the 10th percentile and up to the 90th percentile. Points below and above the whiskers represent individual lesions. c The correlations between model parameters. d The correlations between model parameters and tumor baseline volume. The size of the dots represents lesion number (reported in b). The dashed lines with gray area are the linear regression with 95% confidence interval. The correlation coefficients and p-values were calculated using two-tailed Pearson correlation tests. Source data are provided as a Source Data file.
Fig. 3
Fig. 3. Organ-level tumor response and progression probabilities suggest phenotypic convergence.
a, b Data are presented as the hazard ratio estimates with 95% confidence interval by organs on lesion response and progression in colorectal cancer patients. c, d are the anatomical charts of organ-specific response and progression hazard ratios in metastatic colorectal cancer (mCRC) and metastatic head and neck squamous cell carcinomas (mHNSCC). e, f Data are presented as the hazard ratio estimates with 95% confidence interval in response and progression by organs stratified on treatments in mCRC. P-values in a, b, e, and f were calculated by two-sided likelihood ratio tests. TAR + Chemo, antibody targeted therapies (bevacizumab or panitumumab) plus chemotherapy; Chemo Alone, chemotherapy alone. Source data are provided as a Source Data file.
Fig. 4
Fig. 4. Patient progression sequence association with patient survival.
a Patients were clustered into five groups based on their lesion progression sequence. The column labels are the progression sequence. Color of the heatmap represents the log10 scale of patient number (all plus one to avoid zero values). b Kaplan-Meier curves of clustered patients overall survival. c Box plots of the first lesion progression time (1st), time between first and second progression (2nd-1st), time between second and third progression (3rd-2nd), time between third and fourth progression (4th-3rd), and the average progression time in Lung-First (n = 577), Other-First (n = 639), and Liver-First (n = 930). The box extends from the 25th to 75th percentiles and the line in the middle is plotted as the median. The whiskers are drawn down to the 10th percentile and up to the 90th percentile. Points below and above the whiskers represent individual lesions. P-values in c were calculated by two-sided Dunn’s multiple comparisons. Source data are provided as a Source Data file.
Fig. 5
Fig. 5. Targeted therapy decreases average time to progression but has minimal effect on progression sequence.
a Lung-First, Other-First and Liver-First patients overall survival stratified by treatments. b Lung-First, Other-First and Liver-First patient proportions by treatments. ce are patient progression sequences stratified by treatments. fh are the box plots of the first lesion progression time (1st), time between first and second progression (2nd-1st), time between second and third progression (3rd-2nd), time between third and fourth progression (4th-3rd), and the average progression time by treatments of the groups in ce. N = 307/n = 440/n = 335 patients from TAR + Chemo and n = 270/n = 490/n = 304 patients from Chemo Alone were included in fh. The box extends from the 25th to 75th percentiles and the line in the middle is plotted as the median. The whiskers are drawn down to the 10th percentile and up to the 90th percentile. Points below and above the whiskers represent individual lesions. P-values in fh were calculated by two-sided Kruskal-Wallis tests. TAR + Chemo, antibody-targeted therapies (bevacizumab or panitumumab) plus chemotherapy; Chemo Alone Chemotherapy alone. Source data are provided as a Source Data file.

References

    1. Welch DR, Hurst DR. Defining the hallmarks of metastasis. Cancer Res. 2019;79:3011–3027. - PMC - PubMed
    1. Eccles SA, Welch DR. Metastasis: Recent discoveries and novel treatment strategies. Lancet. 2007;369:1742–1757. - PMC - PubMed
    1. Anderson RL, et al. A framework for the development of effective anti-metastatic agents. Nat. Rev. Clin. Oncol. 2019;16:185–204. - PMC - PubMed
    1. Schmid S, et al. Organ-specific response to nivolumab in patients with non-small cell lung cancer (NSCLC) Cancer Immunol. Immunother. 2018;67:1825–1832. - PMC - PubMed
    1. Osorio JC, et al. Lesion-level response dynamics to programmed cell death protein (PD-1) blockade. J. Clin. Oncol. 2019;37:3546–3555. - PMC - PubMed

Publication types