. 2023 Jan 25;14(1):405.
doi: 10.1038/s41467-023-36116-9.

Epigenetic and transcriptional regulations prime cell fate before division during human pluripotent stem cell differentiation

Affiliations

Epigenetic and transcriptional regulations prime cell fate before division during human pluripotent stem cell differentiation

Pedro Madrigal et al. Nat Commun. .

Abstract

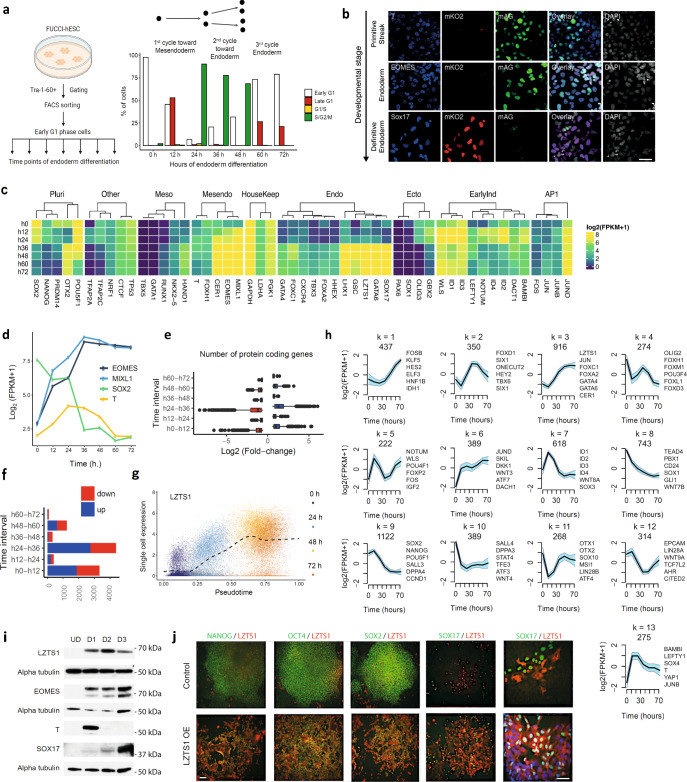
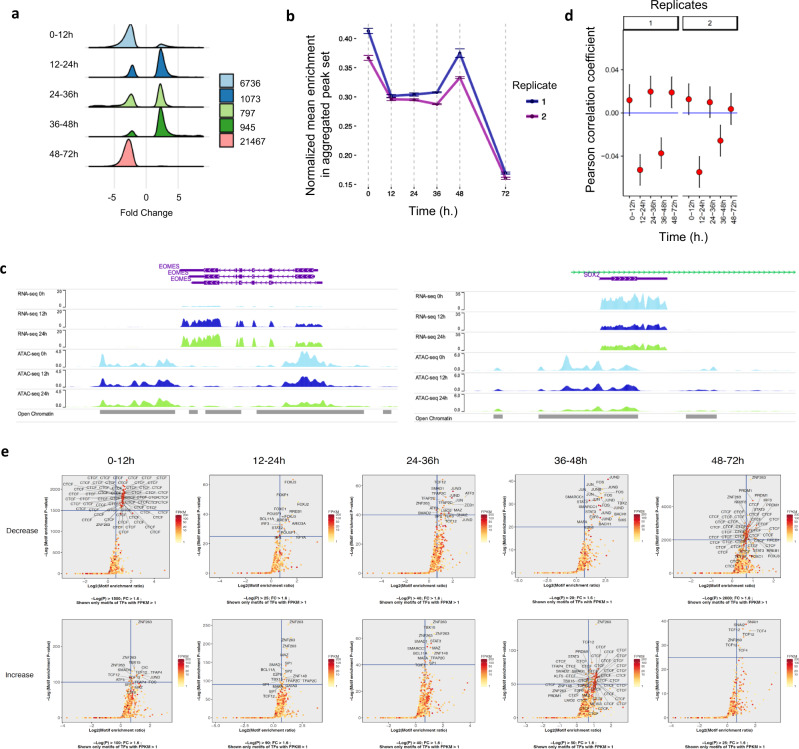
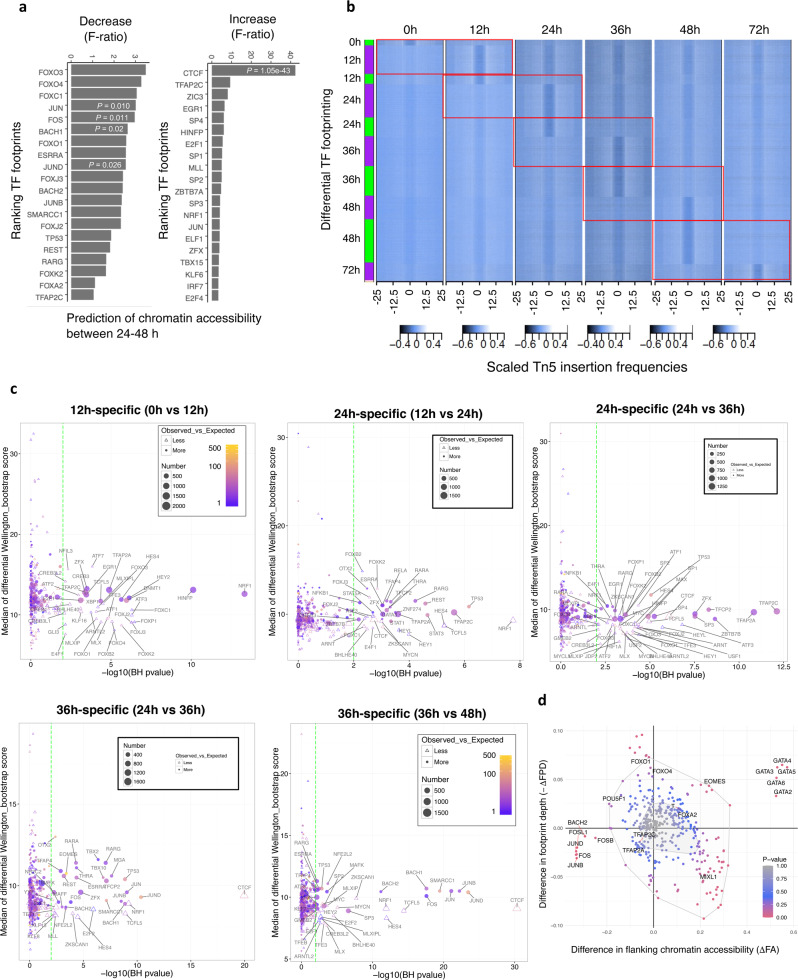
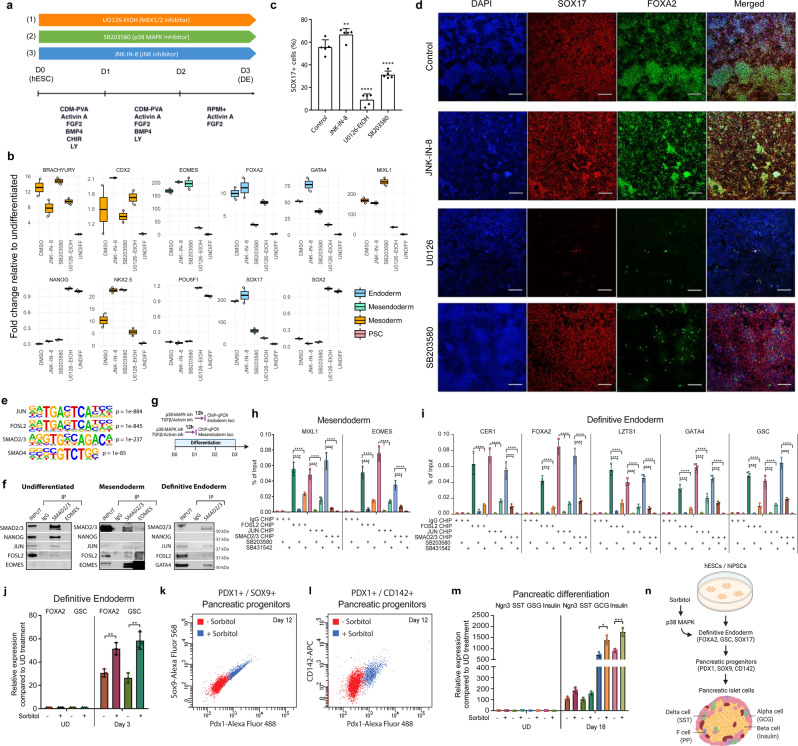
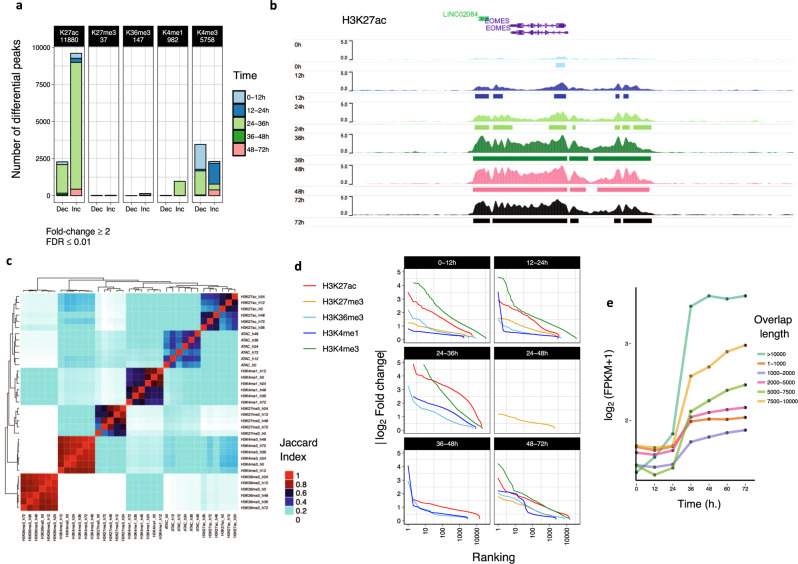
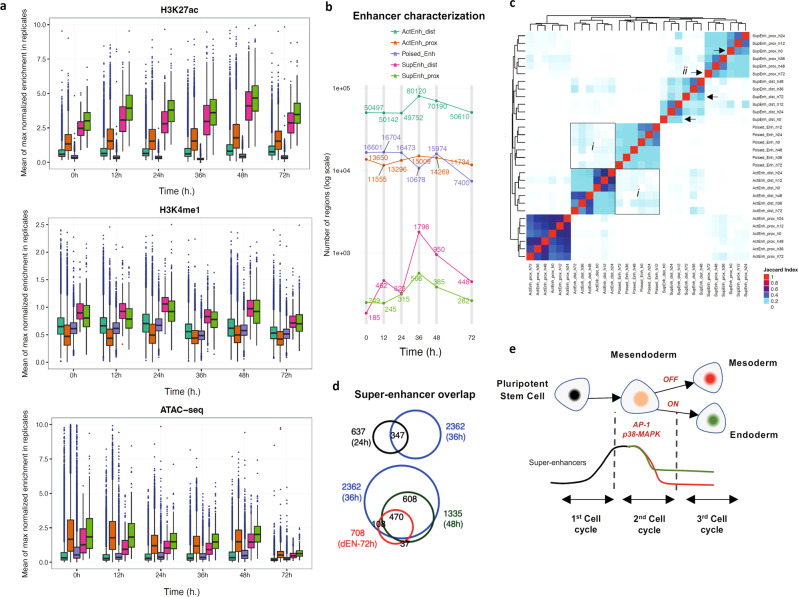
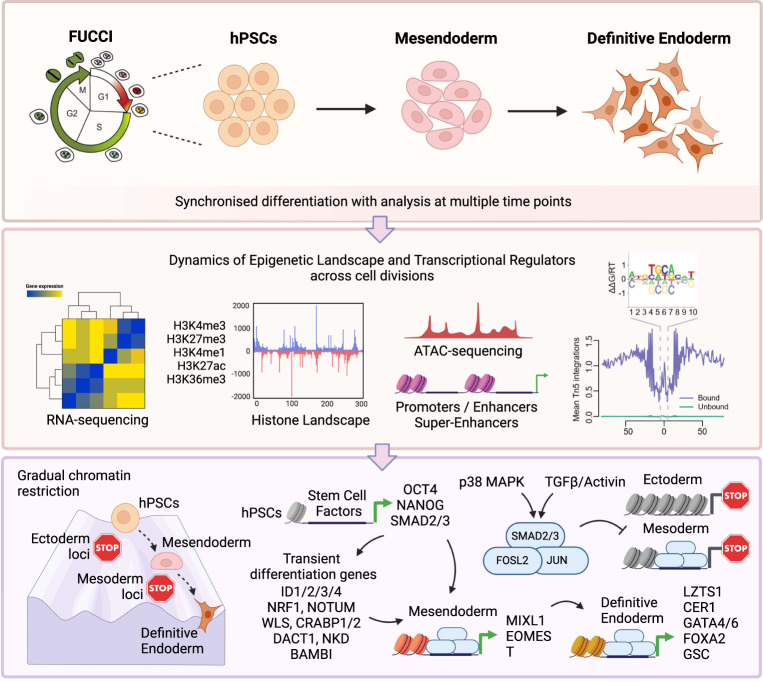
Stem cells undergo cellular division during their differentiation to produce daughter cells with a new cellular identity. However, the epigenetic events and molecular mechanisms occurring between consecutive cell divisions have been insufficiently studied due to technical limitations. Here, using the FUCCI reporter we developed a cell-cycle synchronised human pluripotent stem cell (hPSC) differentiation system for uncovering epigenome and transcriptome dynamics during the first two divisions leading to definitive endoderm. We observed that transcription of key differentiation markers occurs before cell division, while chromatin accessibility analyses revealed the early inhibition of alternative cell fates. We found that Activator protein-1 members controlled by p38/MAPK signalling are necessary for inducing endoderm while blocking cell fate shifting toward mesoderm, and that enhancers are rapidly established and decommissioned between different cell divisions. Our study has practical biomedical utility for producing hPSC-derived patient-specific cell types since p38/MAPK induction increased the differentiation efficiency of insulin-producing pancreatic beta-cells.


Conflict of interest statement

The authors declare no competing interests.

Figures

Fig. 1
Fig. 1. Differentiation of cell cycle synchronised hESCs reveals that each cell division results in a new cellular identity.
a Schematic representation of experimental setup to differentiate synchronised EG1-FUCCI hPSCs into endoderm. The bar plot indicates the proportion of cells in the population at each cell cycle phase and time point. The schematic representation was created with BioRender.com. b Immunofluorescence analyses showing expression of the primitive streak (T, 36 h), early-endoderm (EOMES, 48 h) and definitive endoderm (SOX17, 72 h) markers in FUCCI-hESCs differentiating into endoderm after synchronisation. For immunostaining, the scale bar represents 100 µm. c Gene expression analyses show stage-specific and selected genes that are differentially expressed upon differentiation. d Mean gene expression of T, EOMES, MIXL1 and SOX2 during the time course. e The number of differentially expressed genes (FC >1.5; FDR ≤0.01), and f distribution of log2 fold changes during endoderm differentiation. In (e), the boxes show the interquartile range, with the median marked as a heavy vertical band. Whiskers represent the highest (lowest) datapoint within 1.5 times the interquartile range of the 75th (25th) percentile. Outliers are plotted separately as individual points beyond the whiskers on the boxplot. Data in (e) depicts n = 3 biologically independent samples over an independent experiment. g Single-cell expression (y-axis) of LZTS1, plotted along pseudotime (x-axis). The black dashed line indicates the smoothed mean. Gene expression values correspond to log2(CPM + 1). h Average pattern of gene expression of the 13 clusters identified by k-means clustering. Representative genes are shown beside each cluster. The y-axis represents row-scaled log2(FPKM + 1). The interval represents two standard deviations from the mean. i Western blot analyses show the expression of mesendoderm markers (T), endoderm markers (SOX17, EOMES) and LZTS1 during the differentiation of hPSCs into endoderm. j Immunostaining showing the expression of pluripotency markers (NANOG, OCT4 and SOX2), endoderm markers (SOX17) and LZTS1 in hPSCs (control) and hPSCs overexpressing LZTS1 (LZTS1 OE). For immunostaining, the scale bars represent 100 µm. Source data are provided as a Source Data file.
Fig. 2
Fig. 2. Chromatin accessibility during differentiation of G1 synchronised hPSCs.
a The number of regions showing significant chromatin accessibility increase (“opening”; |FC| ≥2 and adj-P ≤ 10-4) or decrease (“closing”; |FC| ≥2 and adj-P ≤ 10-4) during differentiation of cell synchronised EG1-FUCCI hPSCs. b Normalised mean read-enrichment in ATAC-seq consensus peaks during endoderm differentiation of EG1-FUCCI hPSCs. Data are presented as mean values ± SD. c ATAC-seq and RNA-seq genome browser track visualisation (WashU Epigenome Browser) showing change in EOMES and SOX2 (GENCODE v29) expression and associated chromatin status during the first 36 h of differentiation. The data tracks shown correspond to the first replicates. Open chromatin represents a merged list of genomic regions during differentiation. The purple bars indicate (protein) coding genes, while green represents ncRNA. d Pearson’s product-moment correlation between log2 fold change in RNA (reported by DESeq2) and fold change of the maximum normalised ATAC-seq signal in the two replicates in a region 10 kb upstream of the promoter of protein-coding genes. Mean and 95% confidence interval are shown. e Motif enrichment analyses in ATAC-seq peaks changing between different time points. The analyses shown include only motifs for DNA-binding proteins with expression above 1 FPKM. P values from the one-sided statistical test were calculated by HOMER using the Binomial distribution. Data in (b) and (d) depicts n = 3 biologically independent experiments.
Fig. 3
Fig. 3. Digital genomic footprinting reveals the dynamic activity of key transcription factors during endoderm differentiation of EG1 synchronised hPSCs.
a Top 20 (out of 353) best predictors of a functional linear model using TF footprints at 48 h to model chromatin accessibility change between 24–48 h. P values computed for the F-statistic (Wald test), to evaluate whether the fit to the data is better than what we would expect by chance, are shown for selected TFs. b Heatmap of normalised Tn5 insertions for differential footprints (Wellington bootstrap score S > 20). Red rectangles drawn indicate the results for each pairwise comparison. c Overrepresentation analysis for TFs associated with differential footprints shown in (b). Each differential footprint was first matched to the consensus list of footprints detected by FootprintMixture and Wellington (see Methods). P values (two-sided Chi-squared test; Benjamini–Hochberg multiple hypothesis testing correction) indicate if the proportions of footprints at each time point for a TF are significantly different when comparing differential footprints and the total number of footprints at this time point. Only TFs with adjusted P ≤ 0.01 have been labelled. d Bag plot depicting changes in flanking chromatin accessibility (ΔFA) and footprint depth (ΔFPD) in ATAC-seq of endoderm differentiation between 24 and 48 h in human motifs. Statistically significant changes in FA/FPD were evaluated by the two-sided Chi-squared test. Motifs of genes that were not differentially expressed during endoderm differentiation (RNA-seq) were removed. Outlier motif ARID5A (ΔFA = 0.15, ΔFPD = 0.27) was also removed from the plot.
Fig. 4
Fig. 4. Inhibition of AP-1 complex blocks endoderm differentiation of human pluripotent stem cells via locus-specific transcriptional complexes.
a Schematic representation of the experimental plan to characterise the functional relevance of MEK1/2, JNK and p38 pathways in endoderm differentiation. hPSCs were grown for 3 days in culture conditions inducing endoderm differentiation in the presence of small-molecule inhibitors. b QPCR, c FACS and d immunostaining were performed after 3 days for pluripotency markers (POU5F1/OCT4, NANOG and SOX2), mesendoderm/mesoderm markers (BRACHYURY/T, NKX2.5, CDX2 and MIXL1) and endoderm markers (SOX17, EOMES, GATA4 and FOXA2). For QPCR, the boxes show the interquartile range, with the median marked as a heavy horizontal band. Whiskers represent the highest (lowest) datapoint within 1.5 times the interquartile range of the 75th (25th) percentile. The diamonds represent each datapoint. For FACS, one-way ANOVA was performed, followed by Dunnett’s multiple comparisons test where each of the three treatment conditions was compared against the control in n = 5 experiments. The statistical significance for FACS marks adjusted P values: ** (0.0096), **** (<0.0001). For immunostaining, the scale bar represents 200 µm. Experiments represent three replicates. Statistical analysis was performed by two-way ANOVA with multiple comparisons and **** marks adjusted P value <0.0001. e Consensus binding motifs for AP-1 transcription factors (JUN and FOSL2), SMAD2/3 and SMAD4 were obtained from ATAC-seq analyses at 36 h time point with corresponding P values. f The switching of transcription factor complexes during hPSC differentiation to definitive endoderm. SMAD2/3 was immunoprecipitated from nuclear extracts of undifferentiated hPSCs, at 36 and at 72 h after initiating endoderm differentiation and analysed for the co-immunoprecipitation of NANOG, EOMES, GATA4, FOSL2 and JUN. g Schematic representation of the experimental outline for analysing the impact of p38-MAPK and TGFβ/Activin A signalling on SMAD2/3 and FOSL2/JUN binding and H3K27ac enrichment on mesendoderm at 24 h, and endoderm or mesoderm loci at 36 h by ChIP-qPCR. Cells were treated with p38-MAPK and TGFβ/Activin A inhibitors for 12 h in the presence of differentiation signals before sample collection. h FOSL2/JUN and SMAD2/3 cooperative binding to MIXL1 and EOMES regulatory regions at mesendoderm differentiation stage during hPSC differentiation. Early G1 phase synchronised cells were differentiated to endoderm for 12 h to receive the pluripotency exit signalling, and then treated with p38-MAPK inhibitor SB203580 or TGFβ/Activin signalling inhibitor SB431542 for 12 h, followed by cell fixation for ChIP-qPCR (before first cell division). Analyses reveal that p38-MAPK and TGFβ/Activin signalling regulate the cooperative binding of AP-1 TFs FOSL2/JUN and SMAD2/3 to mesendoderm genes at 24 h time point; n = 3 biologically independent experiments. i FOSL2/JUN and SMAD2/3 cooperative binding to CER1, FOXA2, LZTS1, GATA4 and GSC regulatory regions at endoderm differentiation stage during hPSC differentiation. Early G1 phase synchronised cells were differentiated to endoderm for 24 h, and then treated with p38-MAPK inhibitor SB203580 or TGFβ/Activin signalling inhibitor for 12 h, followed by cell fixation for ChIP-qPCR (before second cell division). p38-MAPK and TGFβ/Activin signalling regulate the cooperative binding of AP-1 TFs FOSL2/JUN and SMAD2/3 to definitive endoderm genes at 36 h time point. n = 3 biologically independent experiments. jm Activation of p38-MAPK signalling improves definitive endoderm and pancreatic differentiation. Cells were treated with 200 mM Sorbitol during 24 to 72 h of endoderm differentiation and analysed by j qPCR of FOXA2 and GSC expression at day 3, k, l FACS of PDX1, SOX9 and CD142 co-expression at day 12, m qPCR of NGN3, SST, GSG and Insulin expression at day 18 of pancreatic differentiation. Experiments represent three replicates. n Activation of p38-MAPK signalling by Sorbitol improves definitive endoderm differentiation and the formation of endoderm-derived pancreatic cell types. Schematic representation of hESC and hiPSC differentiation to definitive endoderm, pancreatic progenitors and pancreatic islets of the Langerhans that contain ɑ, β, δ and F cells expressing their corresponding secreted factors such as insulin by β cells. Activation of p38-MAPK by Sorbitol improved definitive endoderm differentiation and the formation of subsequent pancreatic cells. Adapted from 'Pancreatic Islet of Langerhans', by BioRender.com (2023). Retrieved from https://app.biorender.com/biorender-templates. Statistical analyses in (h, i, j, m) were performed by two-way ANOVA with Tukey’s multiple comparisons tests and * marks adjusted P value <0.05 and ** marks adjusted P value <0.01, *** marks adjusted P value <0.001, **** marks adjusted P value <0.0001. Data were presented as mean values ± SD. Source data are provided as a Source Data file.
Fig. 5
Fig. 5. Histone modification dynamics during differentiation of EG1 synchronised hPSCs.
a The number of genomic regions containing dynamic chromatin marks in consecutive time points based on histone mark ChIP-seq. b H3K27ac ChIP-seq for EOMES locus (GENCODE v29; first replicate shown). c Hierarchical clustering of Jaccard Index values obtained for overlaps between ChIP-seq and ATAC-seq regions. d The absolute value of log2 fold-enrichment ratios for significant sites (FDR ≤0.01) obtained after differential histone modification analysis. e Gene expression versus length of the direct overlap between H3K4me1 and H3K27ac both increase between 24 and 36 h (for protein-coding genes, 10 kb around).
Fig. 6
Fig. 6. Epigenome dynamics upon differentiation reveal super-enhancers assembly and loss to establish a new cellular identity.
a Distribution of H3K27ac, H3K4me1 and ATAC-seq signal in the enhancer regions shown in (b). The boxes show the interquartile range, with the median marked as a heavy horizontal band. Whiskers represent the highest (lowest) datapoint within 1.5 times the interquartile range of the 75th (25th) percentile. Statistical outliers are plotted separately as individual points beyond the whiskers on the boxplot. n = 2 biologically independent samples. b Enhancer classification during endoderm differentiation: ActEnh_dist (H3K27ac+, H3K4me1+, H3K4me3−, <3 kb); ActEnh_prox (H3K27ac+, H3K4me1+, H3K4me3+, <3 kb); Poised_Enh (H3K27ac−, H3K4me1+); SupEnh_dist (H3K27ac+, H3K4me1+, H3K4me3−, > 3 kb); SupEnh_prox (H3K27ac+, H3K4me1+, H3K4me3+, > 3 kb). c Hierarchical clustering of Jaccard Index values obtained for overlaps between different enhancer regions. The squares (i) highlight the conversion of poised into active enhancers, while the arrows (ii) indicate the similarity of super-enhancers at 0 and 72 h with other time points. d Endoderm-specific super-enhancers are a subset of those established at 36 h. e Schematic model of the super-enhancer establishment during endoderm differentiation at each consecutive cell division.
Fig. 7
Fig. 7. Schematic depiction of the study design, analyses methods and results from synchronised hPSC differentiation to definitive endoderm.
We took advantage of the Fluorescent Ubiquitination-based Cell Cycle Indicator (FUCCI) reporter to develop a culture system allowing the differentiation of human embryonic stem cells (hESCs) synchronised in their early G1 phase of the cell cycle to assess the epigenome and transcriptome dynamics during the first two divisions leading to definitive endoderm. Our data comprise multiple time points spanning each successive cell cycle and include simultaneous analysis of RNA-seq, ATAC-seq and ChIP-seq. A summary of the results is shown together with a map of Waddington’s epigenetic landscape for endoderm cell fate specification upon differentiation of human pluripotent stem cells. Overall, these data reveal key successive interplays between epigenetic modifications during differentiation and provide a valuable resource to investigate mechanisms in germ layer specification. Created with BioRender.com.

Similar articles

Cited by

References

    1. Roadmap Epigenomics C, et al. Integrative analysis of 111 reference human epigenomes. Nature. 2015;518:317–330. doi: 10.1038/nature14248. - DOI - PMC - PubMed
    1. Gonzales KA, et al. Deterministic restriction on pluripotent state dissolution by cell cycle pathways. Cell. 2015;162:564–579. doi: 10.1016/j.cell.2015.07.001. - DOI - PubMed
    1. Wang A, et al. Epigenetic priming of enhancers predicts developmental competence of hESC-derived endodermal lineage intermediates. Cell Stem Cell. 2015;16:386–399. doi: 10.1016/j.stem.2015.02.013. - DOI - PMC - PubMed
    1. Adam RC, et al. Pioneer factors govern super-enhancer dynamics in stem cell plasticity and lineage choice. Nature. 2015;521:366–370. doi: 10.1038/nature14289. - DOI - PMC - PubMed
    1. Tsankov AM, et al. Transcription factor binding dynamics during human ES cell differentiation. Nature. 2015;518:344–349. doi: 10.1038/nature14233. - DOI - PMC - PubMed

Publication types

Substances