

Excessive daytime sleepiness in a model of Parkinson's disease improved by low-frequency stimulation of the pedunculopontine nucleus
- PMID: 36697421
- PMCID: PMC9876933
- DOI: 10.1038/s41531-023-00455-7
Excessive daytime sleepiness in a model of Parkinson's disease improved by low-frequency stimulation of the pedunculopontine nucleus
Abstract
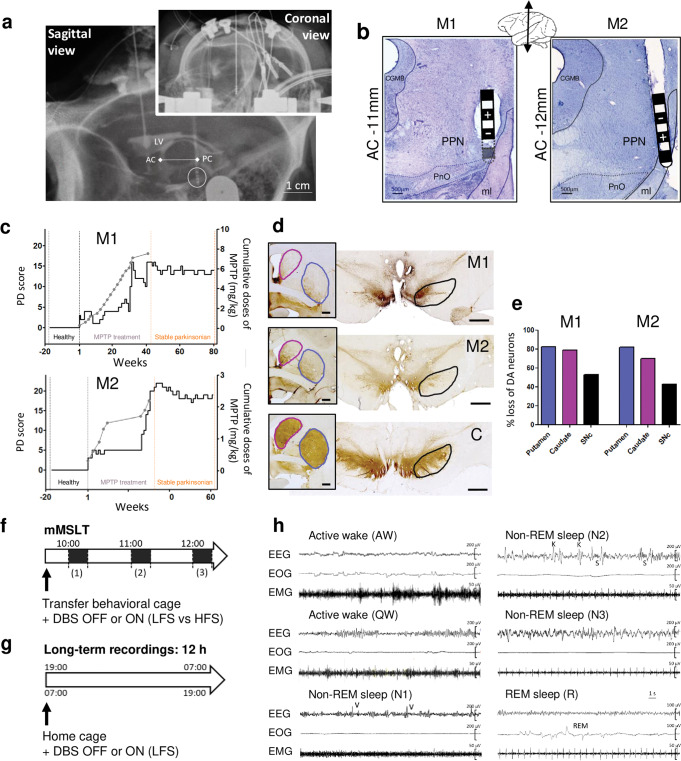
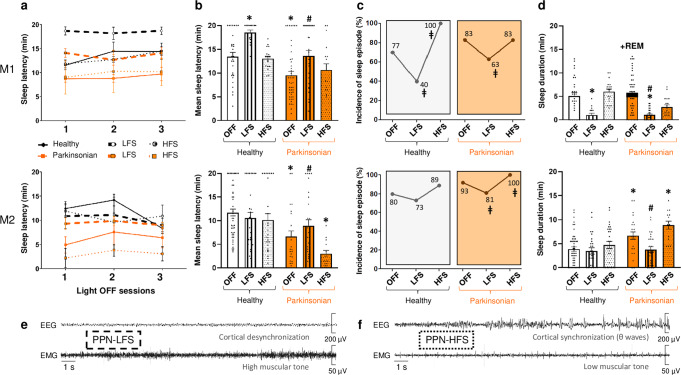
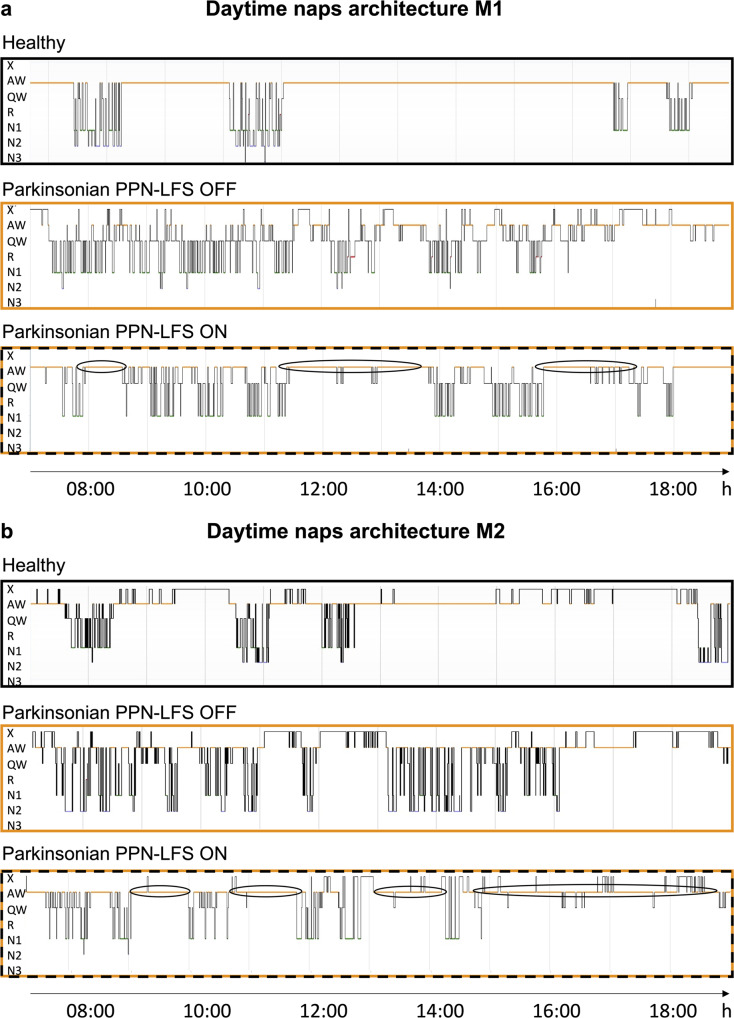
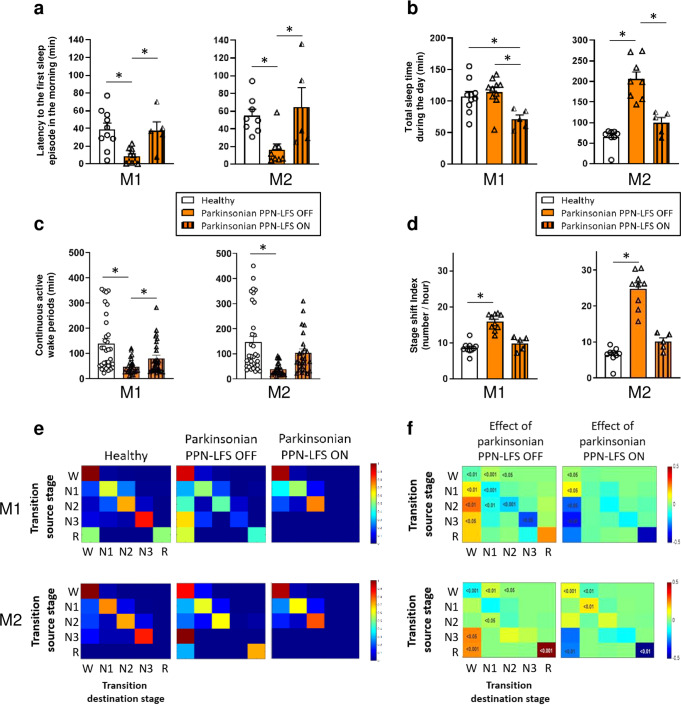
Patients with Parkinson's disease often complain of excessive daytime sleepiness which negatively impacts their quality of life. The pedunculopontine nucleus, proposed as a target for deep brain stimulation to improve freezing of gait in Parkinson's disease, is also known to play a key role in the arousal system. Thus, the putative control of excessive daytime sleepiness by pedunculopontine nucleus area stimulation merits exploration for treating Parkinson's disease patients. To this end, two adult nonhuman primates (macaca fascicularis) received a deep brain stimulation electrode implanted into the pedunculopontine nucleus area along with a polysomnographic equipment. Stimulation at low frequencies and high frequencies was studied, in healthy and then MPTP-treated nonhuman primates. Here, we observed that MPTP-treated nonhuman primates suffered from excessive daytime sleepiness and that low-frequency stimulation of the pedunculopontine nucleus area was effective in reducing daytime sleepiness. Indeed, low-frequency stimulation of the pedunculopontine nucleus area induced a significant increase in sleep onset latency, longer continuous periods of wakefulness and thus, a partially restored daytime wake architecture. These findings may contribute to the development of new therapeutic strategies in patients suffering from excessive daytime sleepiness.
© 2023. The Author(s).
Conflict of interest statement
S.C. declares no non-financial competing interest but the following is the financial competing interest: he has received consultation fees from Medtronic and Boston Scientific in the last 5 years. A.Davin, A.Devergnas, C.B., C.N.G., O.D., N.T., and B.P. declare no competing interests.
Figures
Similar articles
-
Opposite effects of low and high frequency deep brain stimulation of lateral hypothalamus on arousal and temperature in a monkey pilot study.Sci Rep. 2024 Nov 16;14(1):28318. doi: 10.1038/s41598-024-79508-7. Sci Rep. 2024. PMID: 39550400 Free PMC article.
-
Low-frequency versus high-frequency stimulation of the pedunculopontine nucleus area in Parkinson's disease: a randomised controlled trial.J Neurol Neurosurg Psychiatry. 2015 Jun;86(6):674-9. doi: 10.1136/jnnp-2013-307511. Epub 2014 Sep 2. J Neurol Neurosurg Psychiatry. 2015. PMID: 25185212 Clinical Trial.
-
Parkinsonian daytime sleep-wake classification using deep brain stimulation lead recordings.Neurobiol Dis. 2023 Jan;176:105963. doi: 10.1016/j.nbd.2022.105963. Epub 2022 Dec 12. Neurobiol Dis. 2023. PMID: 36521781 Free PMC article.
-
Excessive daytime sleepiness and unintended sleep episodes associated with Parkinson's disease.Oman Med J. 2015 Jan;30(1):3-10. doi: 10.5001/omj.2015.02. Oman Med J. 2015. PMID: 25829994 Free PMC article. Review.
-
Pedunculopontine nucleus deep brain stimulation in Parkinson's disease: A clinical review.Mov Disord. 2018 Jan;33(1):10-20. doi: 10.1002/mds.27098. Epub 2017 Sep 28. Mov Disord. 2018. PMID: 28960543 Review.
Cited by
-
Opposite effects of low and high frequency deep brain stimulation of lateral hypothalamus on arousal and temperature in a monkey pilot study.Sci Rep. 2024 Nov 16;14(1):28318. doi: 10.1038/s41598-024-79508-7. Sci Rep. 2024. PMID: 39550400 Free PMC article.
-
Excessive Daytime Sleepiness as a Risk Factor for Impulse Control Disorders in Parkinson's Disease.Neuropsychiatr Dis Treat. 2024 Dec 13;20:2517-2527. doi: 10.2147/NDT.S485339. eCollection 2024. Neuropsychiatr Dis Treat. 2024. PMID: 39691631 Free PMC article.
-
From Night to Light: A Bibliometric Analysis of the Global Research Trajectory of Sleep Disorders in Parkinson's Disease.J Multidiscip Healthc. 2025 Jan 30;18:473-492. doi: 10.2147/JMDH.S503849. eCollection 2025. J Multidiscip Healthc. 2025. PMID: 39902191 Free PMC article.
-
Butyrate improves abnormal sleep architecture in a Parkinson's disease mouse model via BDNF/TrkB signaling.NPJ Parkinsons Dis. 2025 Jun 19;11(1):175. doi: 10.1038/s41531-025-01029-5. NPJ Parkinsons Dis. 2025. PMID: 40537481 Free PMC article.
-
Impact of excessive daytime sleepiness on the progression of freezing of gait in de novo Parkinson's disease: a cohort study.Neurol Sci. 2025 Feb;46(2):723-731. doi: 10.1007/s10072-024-07738-8. Epub 2024 Sep 26. Neurol Sci. 2025. PMID: 39325240 Free PMC article.
References
Grants and funding
LinkOut - more resources
Full Text Sources
