. 2023 Jan 25;13(1):1396.
doi: 10.1038/s41598-023-28486-3.

Characterization of a novel dual murine model of chemotherapy-induced oral and intestinal mucositis

Affiliations

Characterization of a novel dual murine model of chemotherapy-induced oral and intestinal mucositis

Ali I Mohammed et al. Sci Rep. .

Abstract

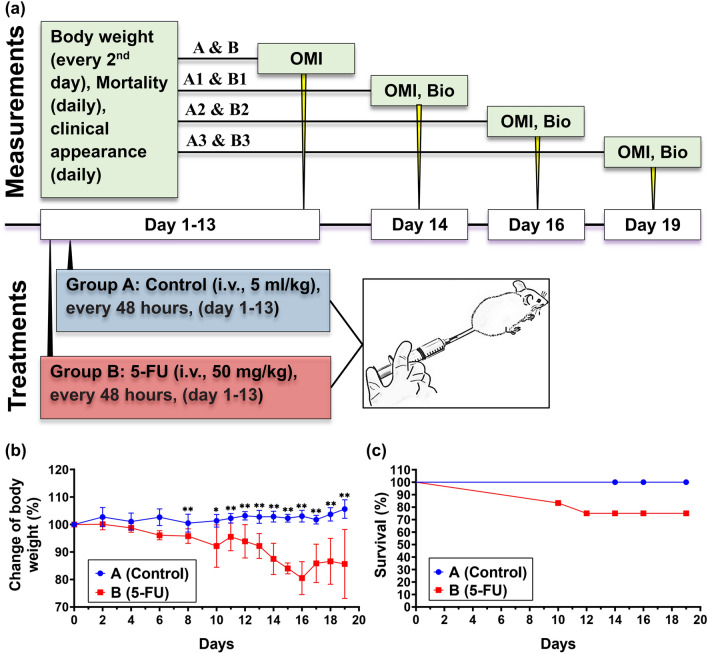
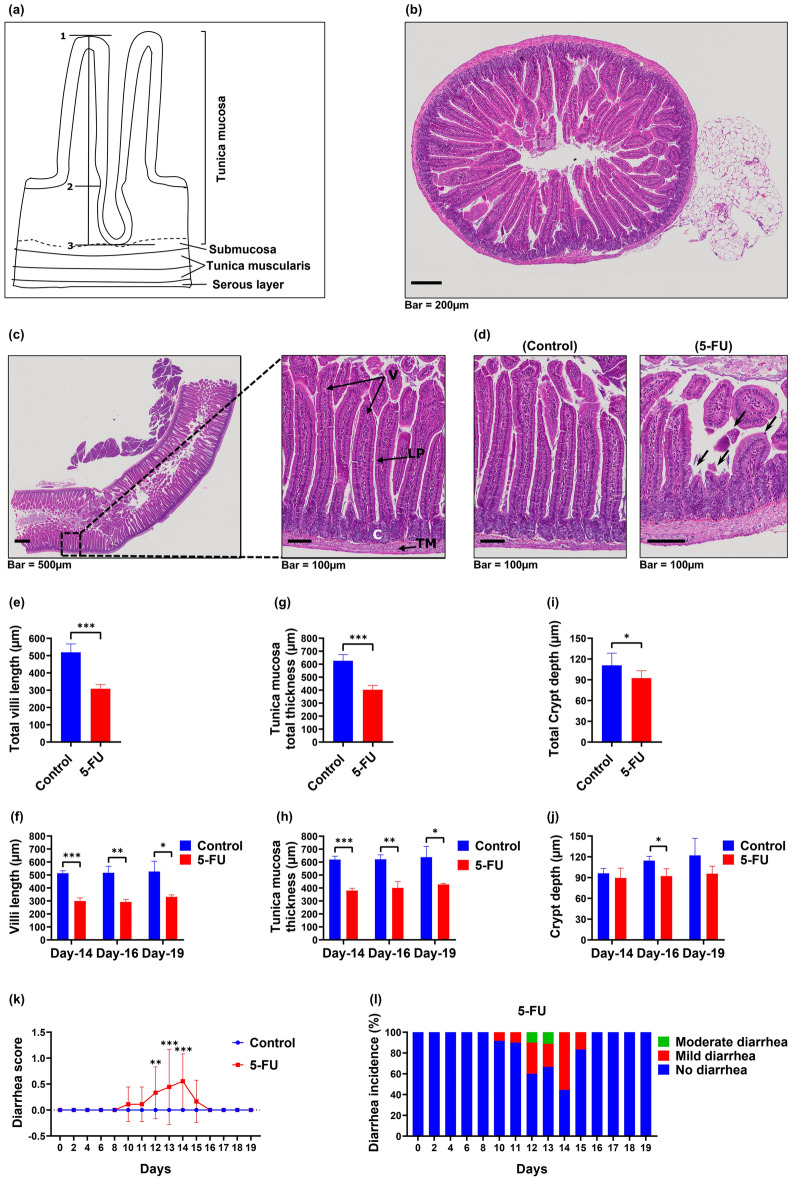
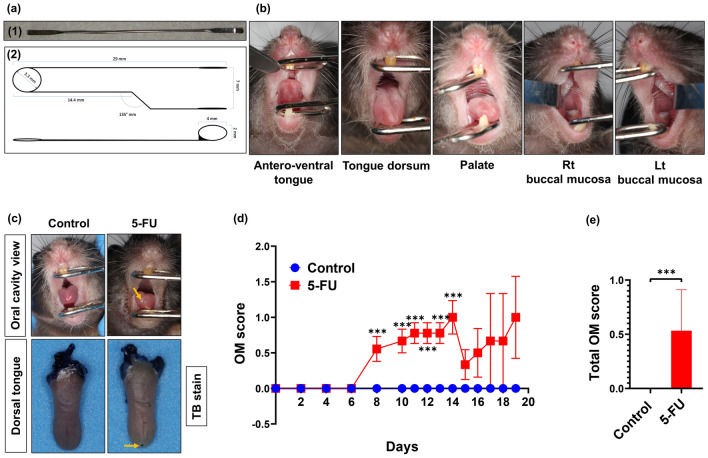
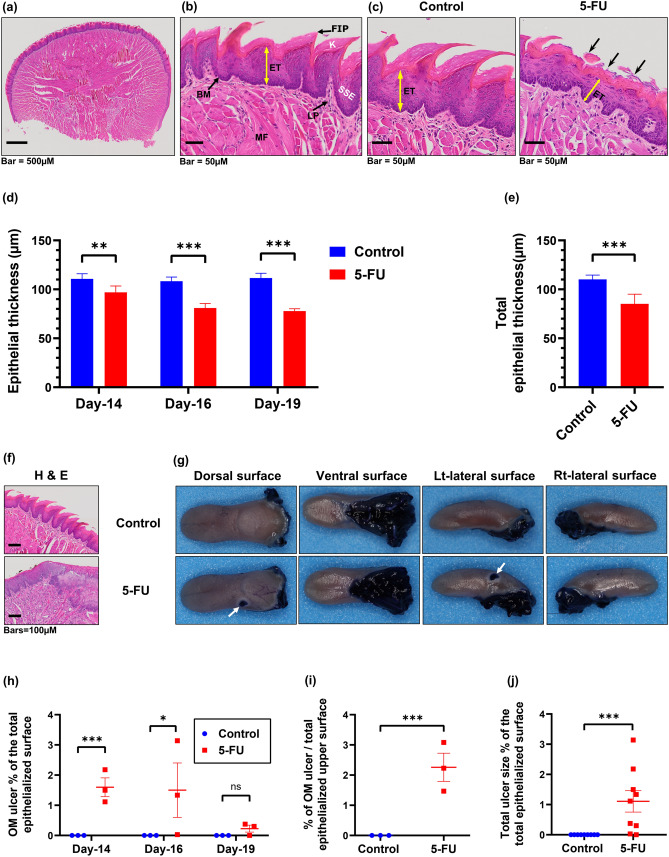
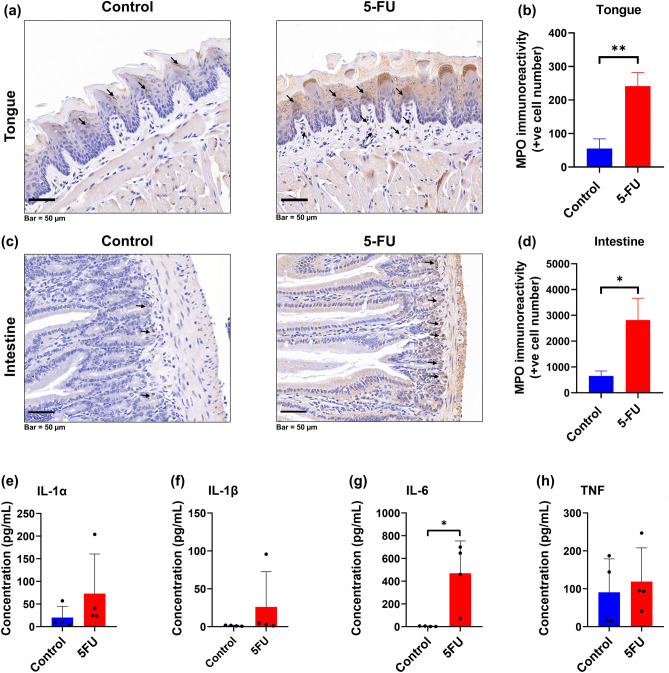
Oral and intestinal mucositis are debilitating inflammatory diseases observed in cancer patients undergoing chemo-radiotherapy. These are devastating clinical conditions which often lead to treatment disruption affecting underlying malignancy management. Although alimentary tract mucositis involves the entire gastrointestinal tract, oral and intestinal mucositis are often studied independently utilizing distinct organ-specific pre-clinical models. This approach has however hindered the development of potentially effective whole-patient treatment strategies. We now characterize a murine model of alimentary tract mucositis using 5-Fluorouracil (5-FU). Mice were given 5-FU intravenously (50 mg/kg) or saline every 48 h for 2 weeks. Post initial injection, mice were monitored clinically for weight loss and diarrhea. The incidence and extent of oral mucositis was assessed macroscopically. Microscopical and histomorphometric analyses of the tongue and intestinal tissues were conducted at 3 interim time points during the experimental period. Repeated 5-FU treatment caused severe oral and intestinal atrophy, including morphological damage, accompanied by body weight loss and mild to moderate diarrhea in up to 77.8% of mice. Oral mucositis was clinically evident throughout the observation period in 88.98% of mice. Toluidine blue staining of the tongue revealed that the ulcer size peaked at day-14. In summary, we have developed a model reproducing the clinical and histologic features of both oral and intestinal mucositis, which may represent a useful in vivo pre-clinical model for the study of chemotherapy-induced alimentary tract mucositis and the development of preventative therapies.


Conflict of interest statement

The authors declare no competing interests.

Figures

Figure 1
Figure 1
5-FU reduces body weight and survival of mice. (a) Schematic of the experimental procedure. 6–12 weeks-old C57BL/6 female mice were divided into 2 groups: Group A; Saline as normal control; Group B; 5-FU as positive control. 5-FU (50 mg/kg/day) was injected intravenously at 2-day intervals, starting from day 1 to day 13. Group A received physiological saline (the vehicle of 5-FU, 5 ml/kg/day). At days 14, 16, and 19 mice were sacrificed, and the tongue and the jejunum, were retrieved at necropsy. (b) Changes in body weight (BW) over time during 5-FU administration; BW of mice was measured every 24–48 h. The BW percentage change of each mouse was calculated and compared with the percent of BW at day 0. The mean BW of every group at day-0 was defined as 100%. Data are represented as mean ± standard error of mean (SEM). Multiple t tests were used to determine the statistical significance between the two groups. (c) Time-course of survival during 5-FU treatment. Logrank test was used for comparative analysis of survival rates. *P < 0.01 versus 5-FU group; **P < 0.001 versus 5-FU group; (n = 9 and 12 for group A and B, respectively).
Figure 2
Figure 2
5-FU-induces intestinal mucosa damage in mice. Histological changes in the intestinal villi were determined using hematoxylin and eosin (H&E) staining. (a) Diagram of the wall of the small intestine demonstrating the morphometric measurements of the tunica mucosa, intestinal villi and crypts of the ileum. 1–3: Thickness of the tunica mucosa; 1–2: Length of the intestinal villi; 2–3: Depth of the intestinal crypt. (b) Representative microphotograph showing the histologic section of a transversely cut intestinal segment of the control animal. (c) Representative microphotograph showing the histologic section of a longitudinally cut intestinal segment of a control animal. Structural landmarks: Villi (V), Crypts (C), lamina propria (LP), Tunica muscularis (TM). (d) Representative microphotograph showing histological appearance of the intestinal mucosa of control, and 5-FU-treated mice. Compared with control mice, the innermost layer was largely destroyed, and the epithelial thickness reduced (epithelial atrophy), with villus length shortening and thinning of lamina propria (black arrows), accompanied by inflammatory cell infiltration. Identical histological aspects were confirmed in multiple control, and 5-FU-treated mice (n = 3, and 3, respectively). (e) Total villi length (average) of the mice jejunum between Day-14 and Day-19. (f) The average villi length of the jejunum at each time point. (g) Total thickness of tunica mucosa (average) of the mice jejunum between Day-14 and Day-19. (h) The average tunica mucosa thickness of the jejunum at each timepoint. (i) Total crypt depth (average) of the mice jejunum between Day-14 and Day-19. (j) The average crypt depth of the jejunum at each time point. Unpaired student t test was used to determine the statistical significance between groups. Data represented as mean ± SD. *p < 0.05. **p < 0.005. ***p < 0.001; n = 9 mice/group, 3 mice/group/timepoint, 12 representative measurement/tissue. (k) Diarrhea score. Score: 0, no diarrhea; 1, mild diarrhea; 2, moderate diarrhea; 3, severe diarrhea. Multiple t tests were used to determine the statistical significance between the two groups. The data shown are means ± SD. **P < 0.005 versus control group (A); *** P < 0.001 versus control group (A). (l) Incidence (%) and severity of diarrhea following 5-FU treatment. The occurrence of mild and moderate diarrhea was observed in mice treated with 5-FU.
Figure 3
Figure 3
5-FU treatment in mice induces chemotherapy-induced oral mucositis (CIOM). 5-FU (50 mg/kg/day) was injected intravenously to group B at 2-days intervals, starting from day 1 to day 13. Group A (control) injected with saline. Oral mucositis (OM) was scored on a six-point scale as described in Methods. (a) Oral cavity examination tools; 1: Stainless steel laboratory micro spatula; 2: Schematic diagram of Celentano Murine Mouth Opener (CMMO). (b) Oral cavity examination views. Animals were sacrificed at different time points, and tongues collected. Tongues were stained with 1% toluidine blue (TB) in 10% acetic acid. (c) Representative photographs show oral mucosa with diffuse erythema on the antero-dorsal surface of the tongue in treated mice, with representative tongues after TB staining showing the epithelium ulceration (blue) at the dorsal surface of the tongue. Yellow arrows show areas of erythema, erosion, and ulceration. (d) Comparative OM scores, error bars = mean ± SEM. ***P < 0.001 versus control group. Multiple t tests were used to determine the statistical significance between the two groups. (e) Mean value of the total score of OM between day-0 and day-19 for each group. Unpaired student t test was used to determine the statistical significance between groups. Data are the mean ± SEM (in = 9 for group A and B). ***p < 0.0001.
Figure 4
Figure 4
5-FU-induces tongue mucosa damage and oral mucositis in mice. Histological changes of the tongue were determined by H&E staining. (a) Representative photomicrograph showing the histologic section of the tongue base from control animal. (b) Representative photomicrograph of dorsal tongue mucosa showing keratin layer (K), filiform papillae (FIP), stratified squamous keratinized epithelium (SSE), basement membrane (BM), lamina propria (LP), and muscle fibers (MF), with epithelial thickness (ET) measured from basal membrane to epithelial granular layer. (c) Representative photomicrograph of the tongue mucosa from control and 5-FU-treated mice. Compared with control mice, the superficial regions were largely destroyed, and the epithelial thickness (double headed yellow arrow) was reduced (epithelial atrophy), with the filiform papilla being entirely damaged (black arrows). Identical histological aspects were confirmed in multiple control, and 5-FU-treated mice. (d) Graphical representation of the average epithelial thickness of the dorsal tongue at each time point measured. Unpaired student t test was used to determine the statistical significance between groups. (e) Graphical representation of total epithelial thickness of the dorsal tongue between Day-14 and Day-19. Multiple t tests were used to determine the statistical significance between the two groups. Data represent Mean ± SD (18 representative measurement/tissue; three representative mice/group/timepoint).**p < 0.005. ***p < 0.001. (f) Representative photomicrograph shows tongue sections from group A and B, with the connective tissue in the 5-FU group (A) showing cellular infiltrate indicative of an inflammatory response. Black arrow shows area of erosion. (g) Representative photographs show TB stained tongues revealing CIOM ulcers (blue staind, weight arrows) at various tongue surfaces. Pearson chi-square tests for independence (categorical variables) were used to examine differences in ulcer status Tongues were stained with 1% TB in 10% acetic acid, imaged, and the ulcer size and the total epithelialized surface of the tongue were measured. (h) Graphical representation of the mean oral mucositis (OM) ulcer size as a percentage of the total epithelialized surface of the tongue (days 14, 16, and 19). Multiple t tests was used to determine the statistical significance between the two groups. (i) Graphical representation of the mean percentage OM ulcer size compared to the total epithelialized upper surface of the tongue on day-14. Unpaired student t test was used to determine the statistical significance between groups. (j) Graphical representation of the total mean OM ulcer size as a percentage of the total epithelialized surface of the tongue between day-14 and day-19. Unpaired student t test was used to determine the statistical significance between groups. Data represent the mean ± SEM (n = 9, and 9 for group A and B, respectively). *p < 0.05; ***p < 0.001.
Figure 5
Figure 5
Effect of 5-FU on MPO levels in tongue and jejunum tissues, and inflammatory cytokynes levels in serum. Immunohistochemical analysis for MPO expression. Mice received 5-FU Intravenously (i.v.), withtongue and jejunum were excised at sacrifice on day 14. MPO immunolabelled cells in tongue and intestinal mucosal sections were counted. MPO positive cells were counted in tongue mucosa of each section from three different transverse sections/tongue of three representative mice/group. MPO positive cells in the intestine were counted from twelve full villus per jejunum section, four intestinal sections per mice, with three representative mice per group. (a) Representative microphotograph showing immunohistochemical staining for MPO in tongue mucosa of C57BL/6 mice (images at magnification X20). MPO positive cells were detected in the epithelial and lamina propria area (black arrows; bar indicates 50 μm). (b) Graphical representation of the number of MPO positive cells/tongue. Data are expressed as mean ± SD. (c) Representative microphotograph showing immunohistochemical staining for MPO in small intestine of C57BL/6 mice (images at magnification X20). MPO positive cells were detected in the tunica mucosa and submucosa area (black arrows; bar indicates 50 μm). (d) Graphical representation of the number of MPO positive cells/intestine. Data are expressed as mean ± SD. Levels of pro-Inflammatory cytokine proteins, IL-1α (e), IL-1β (f), IL-6 (g), and TNF (h), were determined in serum at day 14. Data are expressed as mean ± SD. *P < 0.05, **P < 0.005.

Similar articles

Cited by

References

    1. Scully, C., Sonis, S. & Diz, P. D. Oral mucositis. Oral Diseases, 229 (2006). - PubMed
    1. Pico JL, Avila-Garavito A, Naccache P. Mucositis: Its occurrence, consequences, and treatment in the oncology setting. Oncologist. 1998;3:446–451. doi: 10.1634/theoncologist.3-6-446. - DOI - PubMed
    1. Keefe D, Brealey J, Goland G, Cummins A. Chemotherapy for cancer causes apoptosis that precedes hypoplasia in crypts of the small intestine in humans. Gut. 2000;47:632–637. doi: 10.1136/gut.47.5.632. - DOI - PMC - PubMed
    1. Keefe DM. Gastrointestinal mucositis: A new biological model. Support. Care Cancer. 2004;12:6–9. doi: 10.1007/s00520-003-0550-9. - DOI - PubMed
    1. Lalla RV, Peterson DE. Treatment of mucositis, including new medications. Cancer J. 2006;12:348–354. doi: 10.1097/00130404-200609000-00004. - DOI - PubMed

Publication types

Substances