

Data mining combines bioinformatics discover immunoinfiltration-related gene SERPINE1 as a biomarker for diagnosis and prognosis of stomach adenocarcinoma
- PMID: 36697459
- PMCID: PMC9876925
- DOI: 10.1038/s41598-023-28234-7
Data mining combines bioinformatics discover immunoinfiltration-related gene SERPINE1 as a biomarker for diagnosis and prognosis of stomach adenocarcinoma
Abstract
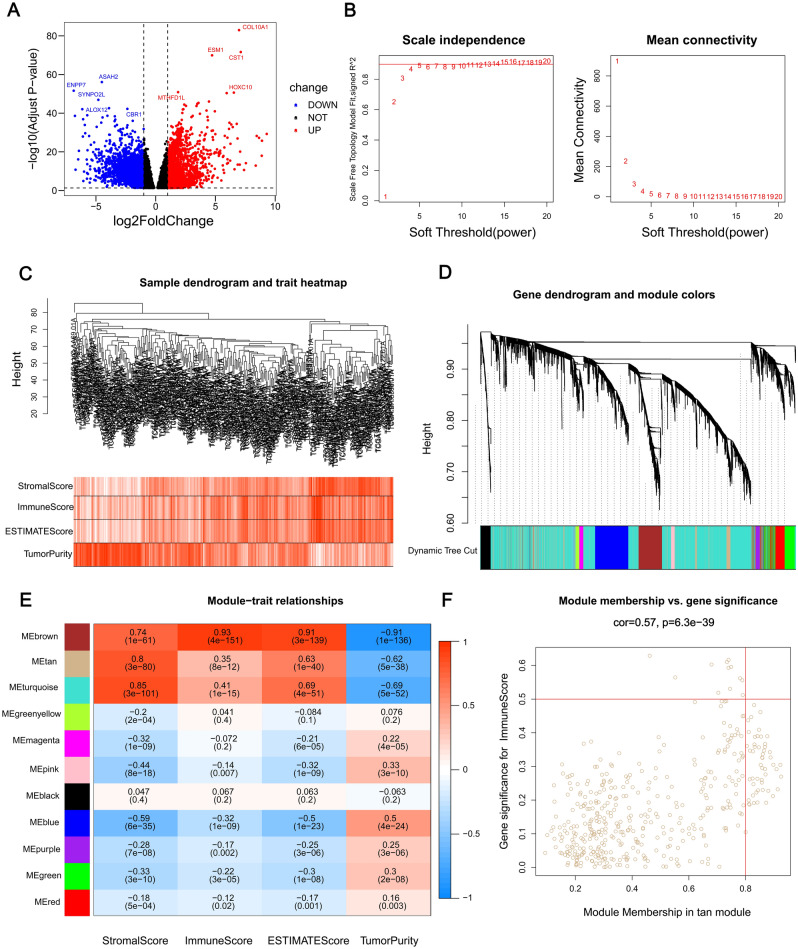
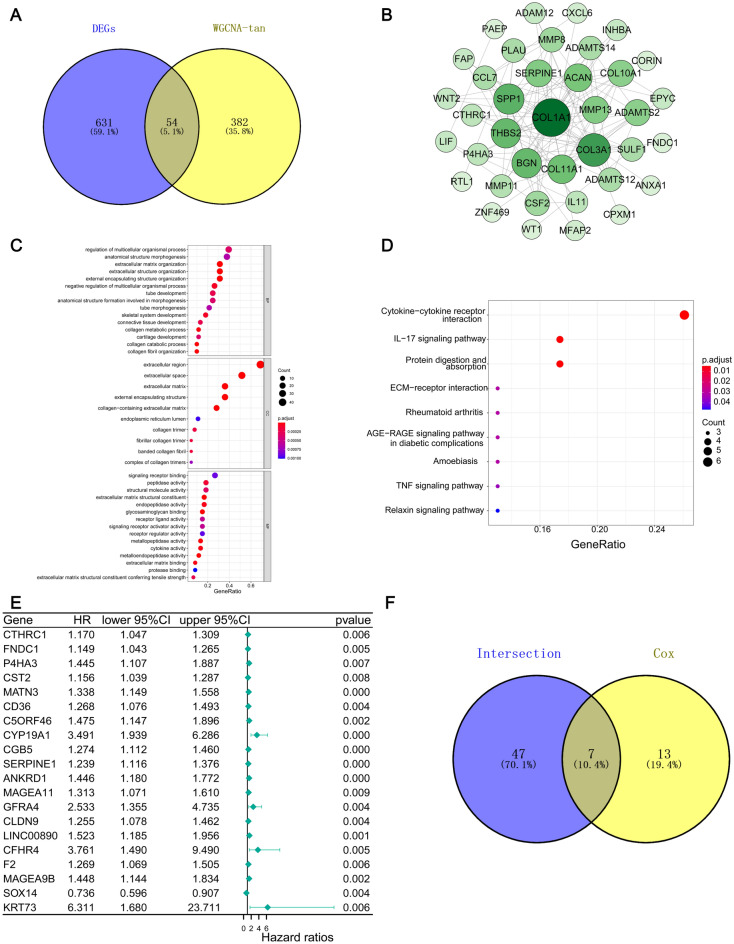
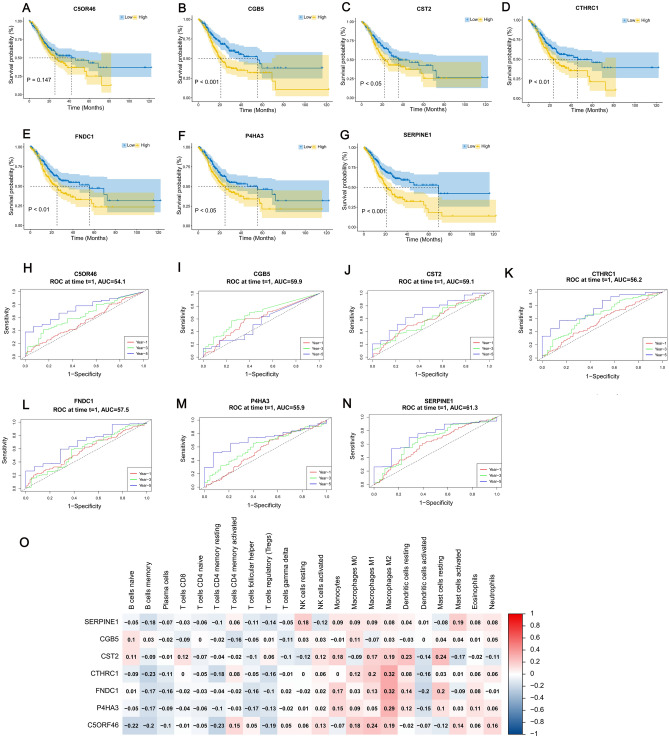
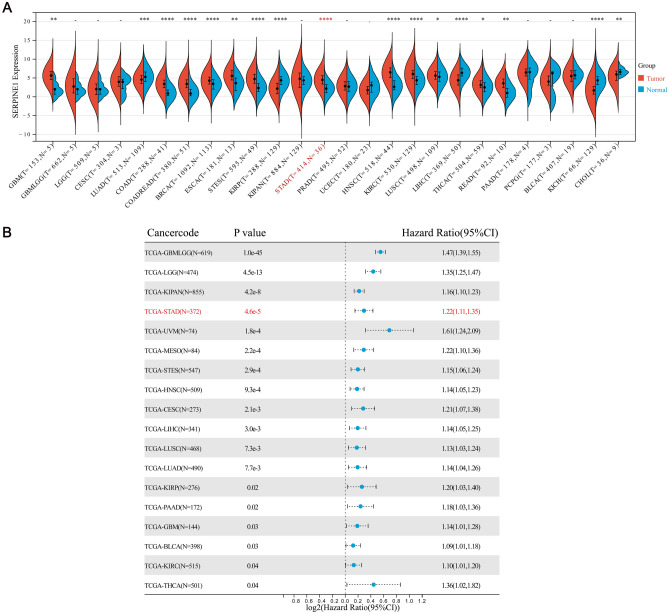
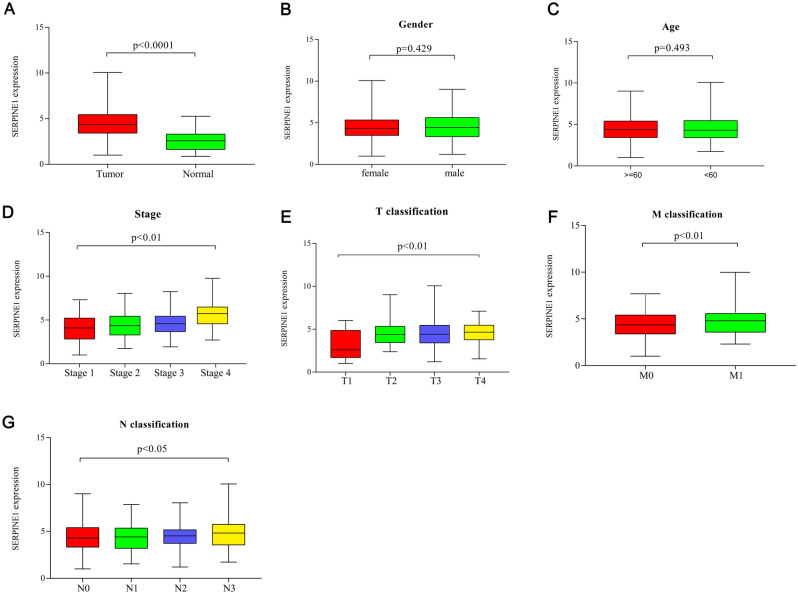
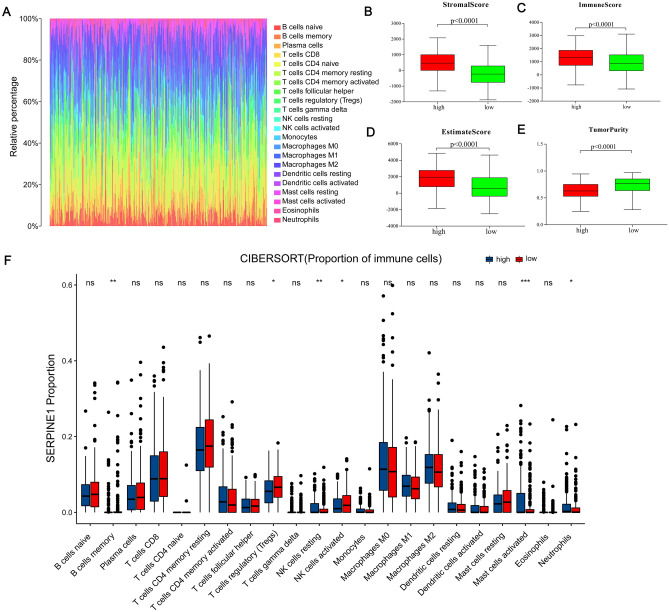
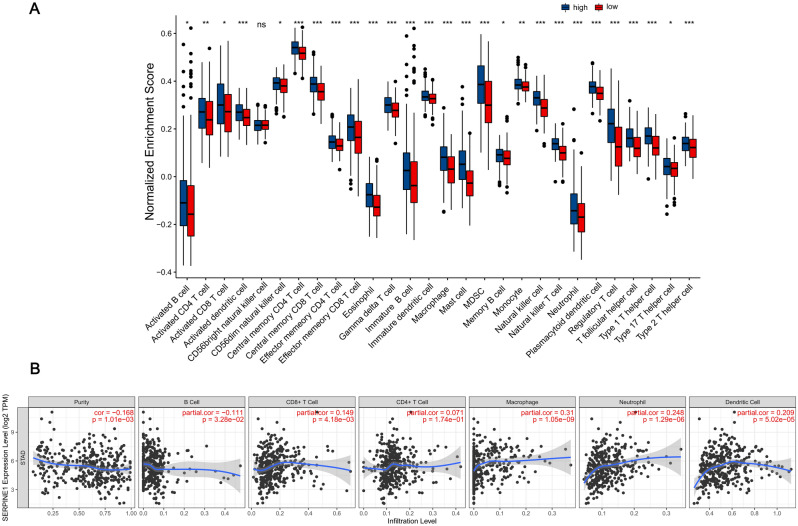
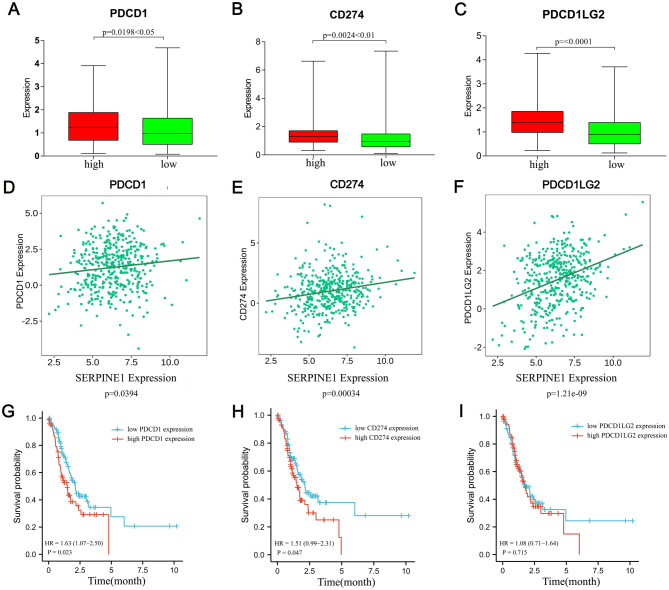
Stomach adenocarcinoma (STAD) is a type of cancer which often at itsadvanced stage apon diagnosis and mortality in clinical practice. Several factors influencethe prognosis of STAD, including the expression and regulation of immune cells in the tumor microenvironment. We here investigated the biomarkers related to the diagnosis and prognosis of gastric cancer, hoping to provide insights for the diagnosis and treatment of gastric cancer in the future. STAD and normal patient RNA sequencing data sets were accessed from the cancer genome atlas (TCGA database). Differential genes were determined and obtained by using the R package DESeq2. The stromal, immune, and ESTIMATE scores are calculated by the ESTIMATE algorithm, followed by the modular genes screening using the R package WGCNA. Subsequently, the intersection between the modular gene and the differential gene was taken and the STRING database was used for PPI network module analysis. The R packages clusterProfiler, enrichplot, and ggplot2 were used for GO and KEGG enrichment analysis. Cox regression analysis was used to screen survival-related genes, and finally, the R package Venn Diagram was used to take the intersection and obtain 7 hub genes. The time-dependent ROC curve and Kaplan-Meier survival curve were used to find the SERPINE1 gene, which plays a critical role in prognosis. Finally, the expression pattern, clinical characteristics, and regulatory mechanism of SERPINE1 were analyzed in STAD. We revealed that the expression of SERPINE1 was significantly increased in the samples from STAD compared with normal samples. Cox regression, time-dependent ROC, and Kaplan-Meier survival analyses demonstrated that SERPINE1 was significantly related to the adverse prognosis of STAD patients. The expression of SERPINE1 increased with the progression of T, N, and M classification of the tumor. In addition, the results of immune infiltration analysis indicated that the immune cells' expression were higher in high SERPINE1 expression group than that in low SERPINE1 expression group, including CD4+ T cells, B cells, CD8+ T cells, macrophages, neutrophils and other immune cells. SERPINE1 was closely related to immune cells in the STAD immune microenvironment and had a synergistic effect with the immune checkpoints PD1 and PD-L1. In conclusion, we proved that SERPINE1 is a promising prognostic and diagnostic biomarker for STAD and a potential target for immunotherapy.
© 2023. The Author(s).
Conflict of interest statement
The authors declare no competing interests.
Figures
Similar articles
-
Amino acid metabolism-related genes as potential biomarkers and the role of MATN3 in stomach adenocarcinoma: A bioinformatics, mendelian randomization and experimental validation study.Int Immunopharmacol. 2024 Dec 25;143(Pt 1):113253. doi: 10.1016/j.intimp.2024.113253. Epub 2024 Sep 30. Int Immunopharmacol. 2024. PMID: 39353384
-
Construction of store-operated calcium entry-related gene signature for predicting prognosis and indicates immune microenvironment infiltration in stomach adenocarcinomas.Sci Rep. 2024 Sep 27;14(1):22342. doi: 10.1038/s41598-024-73324-9. Sci Rep. 2024. PMID: 39333689 Free PMC article.
-
Identification of pivotal genes associated with the prognosis of gastric carcinoma through integrated analysis.Biosci Rep. 2021 Apr 30;41(4):BSR20203676. doi: 10.1042/BSR20203676. Biosci Rep. 2021. PMID: 33754626 Free PMC article.
-
Identification and characterization of nucleotide metabolism and neuroendocrine regulation-associated modification patterns in stomach adenocarcinoma with auxiliary prognostic assessment and immunotherapy response prediction.Front Endocrinol (Lausanne). 2023 Jan 16;13:1076521. doi: 10.3389/fendo.2022.1076521. eCollection 2022. Front Endocrinol (Lausanne). 2023. PMID: 36726460 Free PMC article. Review.
-
A novel necroptosis-related gene index for predicting prognosis and a cold tumor immune microenvironment in stomach adenocarcinoma.Front Immunol. 2022 Oct 27;13:968165. doi: 10.3389/fimmu.2022.968165. eCollection 2022. Front Immunol. 2022. PMID: 36389725 Free PMC article. Review.
Cited by
-
Pan-cancer analysis of SERPINE family genes as biomarkers of cancer prognosis and response to therapy.Front Mol Biosci. 2024 Jan 11;10:1277508. doi: 10.3389/fmolb.2023.1277508. eCollection 2023. Front Mol Biosci. 2024. PMID: 38274096 Free PMC article.
-
Characterization of the Prognosis and Tumor Microenvironment of Cellular Senescence-related Genes through scRNA-seq and Bulk RNA-seq Analysis in GC.Recent Pat Anticancer Drug Discov. 2024;19(4):530-542. doi: 10.2174/0115748928255417230924191157. Recent Pat Anticancer Drug Discov. 2024. PMID: 37807645
-
Identification and experimental validation of biomarkers related to mitochondrial and programmed cell death in obsessive-compulsive disorder.Sci Rep. 2025 Aug 30;15(1):31971. doi: 10.1038/s41598-025-17606-w. Sci Rep. 2025. PMID: 40885831 Free PMC article.
-
Glial-Cell-Line-Derived Neurotrophic Factor Promotes Glioblastoma Cell Migration and Invasion via the SMAD2/3-SERPINE1-Signaling Axis.Int J Mol Sci. 2024 Sep 23;25(18):10229. doi: 10.3390/ijms251810229. Int J Mol Sci. 2024. PMID: 39337713 Free PMC article.
-
9S1R nullomer peptide induces mitochondrial pathology, metabolic suppression, and enhanced immune cell infiltration, in triple-negative breast cancer mouse model.Biomed Pharmacother. 2024 Jan;170:115997. doi: 10.1016/j.biopha.2023.115997. Epub 2023 Dec 20. Biomed Pharmacother. 2024. PMID: 38118350 Free PMC article.
References
-
- Huang Z, et al. A new strategy to identify ceRNA-based CCDC144NL-AS1/SERPINE1 regulatory axis as a novel prognostic biomarker for stomach adenocarcinoma via high throughput transcriptome data mining and computational verification. Front. Oncol. 2022;11:802727. doi: 10.3389/fonc.2021.802727. - DOI - PMC - PubMed
Publication types
MeSH terms
Substances
LinkOut - more resources
Full Text Sources
Medical
Research Materials
Miscellaneous
