. 2021 Jul 23;4(1):111.
doi: 10.1038/s42004-021-00547-6.

Nanoscopic investigation of C9orf72 poly-GA oligomers on nuclear membrane disruption by a photoinducible platform

Affiliations

Nanoscopic investigation of C9orf72 poly-GA oligomers on nuclear membrane disruption by a photoinducible platform

Hung-Ming Chien et al. Commun Chem. .

Abstract

Glycine-alanine dipeptide repeats (GA DPRs) translated from the mutated C9orf72 gene have recently been correlated with amyotrophic lateral sclerosis (ALS). While GA DPRs aggregates have been suggested as amyloid, the biophysical features and cytotoxicity of GA DPRs oligomers has not been explored due to its unstable nature. In this study, we develop a photoinducible platform based on methoxynitrobenzene chemistry to enrich GA DPRs that allows monitoring the oligomerization process of GA DPRs in cells. By applying advanced microscopies, we examined the GA DPRs oligomerization process nanoscopically in a time-dependent manner. We provided direct evidences to demonstrate GA DPRs oligomers rather than nanofibrils disrupt nuclear membrane. Moreover, we found GA DPRs hamper nucleocytoplasmic transport in cells and cause cytosolic retention of TAR DNA-binding protein 43 in cortical neurons. Our results highlight the toxicity of GA DPRs oligomers, which is a key step toward elucidating the pathological roles of C9orf72 DPRs.


Conflict of interest statement

The authors declare no competing interests.

Figures
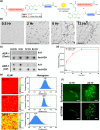
Fig. 1
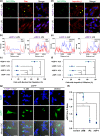
Fig. 1. Diagram of ADP probes and their biophysical characterization.
a Structure of ADP-1 and ADP-2 probes and the scheme of their photo-liberating reaction. b Time-course transmission electron microscope analysis of ADP-1 (50 μM). Scale bars indicate 200 nm. c Dot blot analysis of ADP-1-induced GA DPRs over time. The sample was incubated until the indicated time and applied on the membrane. Membranes were stained with anti-GA DPRs antibody and A11 antibody. N = 3. d Time-course turbidity measurements of irradiated (wavelength: 365 nm, power density: 32 mW/cm2, duration: 1 min) (red) and unirradiated (black) ADP-1 (50 μM). Data are collected at 0.5th, 2nd, 6th, 12th, 24th, 48th, and 96th hour (Standard deviation, N = 3). e Fluorescence lifetime images and the histograms of the photoinitiated ADP-2 (5 μM). Images were taken at the 0.5th, 2nd, and 24th hours of incubation; scale bars indicate 5 µm. f Epi-fluorescence and direct stochastic optical reconstruction microscopy (dSTORM) images of the photoinitiated ADP-2 (50 μM). Images were acquired at the 12th and 24th hours of incubation; scale bars indicate 10 µm.
Fig. 2
Fig. 2. GA DPRs delivered by ADP-1 and 2 probes oligomerized in cells.
a Time-course fluorescence lifetime images and histograms of ADP-2 in SH-SY5Y cells. 1 μM ADP-2 were treated to cells and photoinitiated by UV light (wavelength: 335–379 nm, power density: ≤8.24 mW/cm2, duration: 1 min). Cell periphery was contoured with a white line in 12th and 24th hours, respectively. Images were taken at 2nd, 12th, 24th hour after UV illumination; scale bars indicate 5 µm. b A11 immunoblotting with cell lysates from SH-SY5Y cells received ADP-1 (1 µM) treatment with or without photoinitiation. After photoinitiation, cell lysates at different time points were harvested and analyzed. c Quantification analysis of A11 immunoblot of SH-SY5Y total cell lysates. The signal of A11 staining was first normalized to GAPDH staining and then compared to signal at 0.5 h incubation. Three biological replicates were carried out (r = 3). Mean and standard deviation for ADP-1, UV = 171.7 ± 17.0; ADP-1, dark = 85.8 ± 10.6. ** indicates statistical significance where p value < 0.01 (analyzed by two-sided Welch’s T test, p value = 0.005, degree of freedom = 3, t value = 3.18).
Fig. 3
Fig. 3. Photoinitiated GA DPRs impaired nucleocytoplasmic transport in human neuroblastoma cells.
a Immunofluorescence images of Ran protein (red) in ADP-2 photoinitiated (+ADP-2 +UV) or control SH-SY5Y cells. GA DPRs aggregates were shown in green color. Cells were treated with ADP-2 (1 μM) and then exposed to UV light (wavelength: 335–379 nm, power density: ≤8.24 mW/cm2, duration: 1 min) and incubated for 24 h. Yellow arrows indicate the cells with nuclear Ran depletion. White dash line indicates the region for fluorescence intensity profiling. Scale bars indicate 10 µm. b Fluorescence intensity profile of selected cells in Fig. 3A. Blue curve indicates DAPI channel and red curve indicates Ran channel. c Quantification analysis of SH-SY5Y cells with nuclear ran protein depletion. Three biological replicates were carried out (r = 3). More than 55 cells were counted and analyzed in each group (n ≥ 55). Mean and standard deviation for +ADP-1 +UV = 69.0 ± 9.6; +ADP-1 −UV = 16.2 ± 5.5; −ADP-1 +UV = 14.7 ± 6.0; −ADP-1 −UV = 18.0 ± 4.4. ** indicates statistical significance where p value < 0.01 (analyzed by two-sided Welch’s T test with Bonferroni correction, test statistic in group comparison between +ADP-1 +UV and −ADP-1 −UV: p value = 0.0011, degree of freedom = 3, t value = 3.18; group comparisons between +ADP-1 −UV and −ADP-1 –UV: p value = 0.23, degree of freedom = 4, t value = 2.77; group comparison between −ADP-1 +UV and −ADP-1 –UV: p value = 0.16, degree of freedom = 4, t value = 2.77), and n.s. indicates not significant. d Immunofluorescence images of importin-β (red) in SH-SY5Y after ADP-2 (1 μM) and irradiation treatment. GA DPRs aggregates were shown in green color. Yellow arrows indicate the cells with importin-β mislocalization. White dash line indicates the region for fluorescence intensity profiling. Scale bars indicate 10 µm. e Fluorescence intensity profile of selected cells in Fig. 3D. Blue curve indicates DAPI channel and red curve indicate the importin-β channel. f Quantification analysis of SH-SY5Y cells with importin-β diffusion. Three biological replicates were carried out (r = 3). More than 37 cells were counted and analyzed in each group (n ≥ 37). Mean and standard deviation for +ADP-1 +UV = 62.0 ± 7.0; +ADP-1 −UV = 21.7 ± 6.9; −ADP-1 +UV = 24.1 ± 7.6; −ADP-1 −UV = 17.8 ± 5.8. *** indicates statistical significance where p value < 0.001 (analyzed by two-sided Welch’s T test with Bonferroni correction, test statistic in group comparison between +ADP-1 +UV and −ADP-1 −UV: p value = 0.0004, degree of freedom = 4, t value = 2.78; group comparison between +ADP-1 −UV and −ADP-1 –UV: p value = 0.17, degree of freedom = 4, t value = 2.77; group comparison between −ADP-1 +UV and −ADP-1 –UV: p value = 0.10, degree of freedom = 4, t value = 2.77), and n.s. indicates not significant. g Immunofluorescence images of sGFP-transfected SH-SY5Y cells after ADP-1 treatment (1 μM) and UV-irradiation. Corresponding nuclear importation (Importazole, IPZ, 40 µM) and exportation (leptomycin B, LMB, 20 nM) inhibitors were used here as reference groups, respectively. Scale bars indicate 10 µm. h Quantification analysis of the nuclear-to-cytoplasmic ratio of sGFP reporter in SH-SY5Y. One biological replicate were carried out (r = 1). Cell counting number (n) in each group: control = 38, LMB = 36, IPZ = 31, ADP-1 = 38. Mean and standard deviation for control = 0.98 ± 0.10; LMB = 2.18 ± 0.22; IPZ = 0.54 ± 0.14; ADP-1 = 0.40 ± 0.06. *** indicates statistical significance where p value < 0.001, (analyzed by two-sided Welch’s T test with Bonferroni correction, test statistic in group comparison between control and LMB: p value = 7.6 × 10−33, degree of freedom = 48, t value = 2.01; group comparison between control and IPZ: p value = 3 × 10−21, degree of freedom = 54, t value = 2.00; group comparison between control and ADP-1: p value = 2.6 × 10−38, degree of freedom = 59, t value = 2.00).
Fig. 4
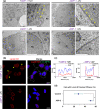
Fig. 4. GA DPRs disrupt the nuclear membrane and lamina.
a Transmission electron microscope images of in Cos-7 cells with ADP-1 treatment and photoinitiation, ADP-1 treatment only, photoinitiation only, and not treatment. Cos-7 cells were treated with ADP-1 (1 µM), photoinitiated, and then incubated for 24 h. Yellow arrows indicate the nuclear membrane. Black squares indicate the view of zoom-in images. Scale bars indicate 1 µm. b Immunofluorescence images of lamin B1 (red) in GA DPRs (green)-rich SH-SY5Y. Cells were treated with ADP-2 (1 µM), photoinitiated, and then incubated for 24 h. Yellow arrows indicate the lamin B1 nuclear diffusion. White dash line in the lamin B1 channel indicates the region for fluorescence intensity profiling. Scale bars indicate 10 µm. c Fluorescence intensity profile of the cells in Fig. 4B. Red curve indicates lamin B1 channel and the blue curve indicates DAPI channel. d Quantification analysis demonstrated the majority of cells with lamin B1 nuclear diffusion after ADP-2 treatment and photoinitiation (+ADP-2 +UV). Three biological replicates were carried out (r = 3). More than 53 cells were counted and analyzed in each group (n ≥ 53). Mean and standard deviation for group control = 28.0 ± 7.8; ADP-2 = 50.7 ± 3.3. * indicates statistical significance where p value < 0.05 (p value = 0.019, analyzed by two-sided Welch’s T test, degree of freedom = 3, t value = 3.18).
Fig. 5
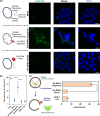
Fig. 5. GA DPRs oligomers permeabilize the nuclear membrane.
a Representative images of lamin B1 staining on digitonin-treated SH-SY5Y cells in the presence of GA DPRs oligomers (upper row), fibrils (middle), or mock (buffer only, bottom row). The nuclei were counterstained with DAPI. Scale bars indicate 10 μm. b Quantification analysis of SH-SY5Y cell nuclei with lamin B1 staining. Three biological replicates were carried out (r = 3). More than 27 cells were counted and analyzed in each group (n ≥ 27). Mean and standard deviation for mock = 13.9 ± 7.8; Triton = 96.9 ± 2.4; GA DPRs oligomers = 62.3 ± 23.9; GA DPRs fibrils = 9.5 ± 6.2; ADP-3 + UV = 10.6 ± 4.2. * indicates statistical significance where p value < 0.05 and ** indicates statistical significance where p value < 0.01 (analyzed by two-sided Welch’s T test with Bonferroni correction, test statistic in group comparison between mock and GA DPRs oligomers: p value = 0.009, degree of freedom = 4, t value = 2.77; group comparison between GA DPRs Oligomers and GA DPRs fibrils: p value = 0.011, degree of freedom = 3, t value = 3.18). c The ratio of the calcein (emission at 520 nm) leak-out from lipid-based liposome based on the fluorescence measurement. Fluorescence intensity was measured for each sample, and then subtracts from the background (liposome only) and normalized to the signal from the Triton X100 treatment (lysed liposome). Three experiment replicates were carried out (r = 3), Mean and standard deviation for GA DPRs oligomers = 32.4 ± 2.6; GA DPRs fibrils = 5.2 ± 0.8. ** indicates statistical significance where p value < 0.01 (analyzed by two-sided Welch’s T test, p value = 0.003, degree of freedom = 2, t value = 4.30).
Fig. 6
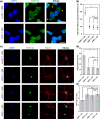
Fig. 6. GA DPRs induces TDP-43 cytosolic retention and causes severe damage to the mouse cortical neurons.
a Representive immunofluorescence of endogenous TDP-43 (Green) in neuroblastoma SH-SY5Y after ADP-1 treatment (1 μM), photoinitiated, and then incubated for 24 h. Yellow arrows indicate the cells with TDP-43 cytosolic retention. Scale bars indicate 10 µm. b Quantification analysis of SH-SY5Y cells with TDP-43 cytosolic retention. Three biological replicates were carried out (r = 3). More than 32 cells were counted and analyzed in each groups (n ≥ 32). Mean and standard deviation for +ADP-1 +UV = 57.2 ± 6.5; +ADP-1 −UV = 20.4 ± 5.4; −ADP-1 +UV = 18.6 ± 7.3; −ADP-1 −UV = 17.9 ± 6.3. *** indicates statistical significance where p value < 0.001 (analyzed by two-sided Welch’s T test with Bonferroni correction, test statistic in group comparison betwen +ADP-1 +UV and −ADP-1 −UV: p value = 0.0005, degree of freedom = 4, t value = 2.78; group compariosion betwen +ADP-1 −UV and −ADP-1 –UV: p value = 0.21, degree of freedom = 4, t value = 2.77; group compariosion betwen −ADP-1 +UV and −ADP-1 –UV: p value = 0.30, degree of freedom = 4, t value = 2.77), and n.s. indicates not significant. c Representative immunofluorescence images of 21DIV mouse cortical neurons stained with antibody against β-III-tubulin (red) and TDP-43 (green) treated with or without 1 μM ADP-1 and/or 2 min of UV irradiation. The mouse cortical neurons were further incubated for 24 h after ADP-1 treatment and/or UV irradiation. The DNA counter stain DAPI (blue) was included to identify the location of the nucleus. Scale bar indicates 10 µm. d Quantification analysis of degeneration area in 21DIV mouse cortical neurons. The degeneration area percentage (%) of neuron is quantified as fragemnted neurite area/total nerutite area. Three biological replicates were carried out (r = 3). Mean and standard deviation for +ADP-1 +UV = 36.8 ± 8.8; +ADP-1 −UV = 14.5 ± 5.5; −ADP-1 +UV = 14.4 ± 3.9; −ADP-1 −UV = 12.9 ± 5.0. ** indicates statistical significance where p value < 0.01 (analyzed by two-sided Welch’s T test with Bonferroni correction, test statistic in group compariosion betwen +ADP-1 +UV and −ADP-1 −UV: p value = 0.0086, degree of freedom = 3, t value = 3.18; group compariosion betwen +ADP-1 −UV and −ADP-1 –UV: p value = 0.24, degree of freedom = 4, t value = 2.77; group compariosion betwen −ADP-1 +UV and −ADP-1 –UV: p value = 0.234, degree of freedom = 4, t value = 2.77), and n.s. indicates not significant. e Quantification analysis nuclear-to-cytoplasmic ratio of TDP-43 in mice cortical neurons. Three biological replicates were carried out (r = 3) and counted neuron number (n) in each group: +ADP-1 +UV = 86; +ADP-1 −UV = 55; −ADP-1 +UV = 52; −ADP-1 −UV = 56. Mean and standard deviation for +ADP-1 +UV = 1.75 ± 0.05; +ADP-1 −UV = 2.62 ± 0.42; −ADP-1 +UV = 2.49 ± 0.79; −ADP-1 −UV = 2.66 ± 0.19. ** indicates statistical significance where p value  < 0.01 (analyzed by two-sided Welch’s T test with Bonferroni correction, test statistic in group compariosion betwen +ADP-1 +UV and −ADP-1 −UV: p value = 0.005, degree of freedom = 2, t value = 4.30; group compariosion betwen +ADP-1 −UV and −ADP-1 –UV: p value = 0.299, degree of freedom = 3, t value = 3.18; group compariosion betwen −ADP-1 +UV and −ADP-1 –UV: p value = 0.248, degree of freedom = 2, t value = 4.30), and n.s. indicates not significant.

Similar articles

Cited by

References

    1. DeJesus-Hernandez M, et al. Expanded GGGGCC hexanucleotide repeat in noncoding region of C9ORF72 causes chromosome 9p-linked FTD and ALS. Neuron. 2011;72:245–256. doi: 10.1016/j.neuron.2011.09.011. - DOI - PMC - PubMed
    1. Renton AlanE, et al. A hexanucleotide repeat expansion in C9ORF72 is the cause of chromosome 9p21-Linked ALS-FTD. Neuron. 2011;72:257–268. doi: 10.1016/j.neuron.2011.09.010. - DOI - PMC - PubMed
    1. Gijselinck I, et al. A C9orf72 promoter repeat expansion in a Flanders-Belgian cohort with disorders of the frontotemporal lobar degeneration-amyotrophic lateral sclerosis spectrum: a gene identification study. Lancet Neurol. 2012;11:54–65. doi: 10.1016/S1474-4422(11)70261-7. - DOI - PubMed
    1. Haeusler AR, Donnelly CJ, Rothstein JD. The expanding biology of the C9orf72 nucleotide repeat expansion in neurodegenerative disease. Nat. Rev. Neurosci. 2016;17:383. doi: 10.1038/nrn.2016.38. - DOI - PMC - PubMed
    1. Brown RH, Al-Chalabi A. Amyotrophic lateral sclerosis. N. Engl. J. Med. 2017;377:162–172. doi: 10.1056/NEJMra1603471. - DOI - PubMed