. 2022 Feb 3;5(1):14.
doi: 10.1038/s42004-022-00632-4.

The ubiquitous catechol moiety elicits siderophore and angucycline production in Streptomyces

Affiliations

The ubiquitous catechol moiety elicits siderophore and angucycline production in Streptomyces

Doris A van Bergeijk et al. Commun Chem. .

Abstract

Actinobacteria are a rich source of bioactive molecules, and genome sequencing has shown that the vast majority of their biosynthetic potential has yet to be explored. However, many of their biosynthetic gene clusters (BGCs) are poorly expressed in the laboratory, which prevents discovery of their cognate natural products. To exploit their full biosynthetic potential, better understanding of the signals that promote the expression of BGCs is needed. Here, we show that the human stress hormone epinephrine (adrenaline) elicits siderophore production by Actinobacteria. Catechol was established as the likely eliciting moiety, since similar responses were seen for catechol and for the catechol-containing molecules dopamine and catechin but not for related molecules. Exploration of the catechol-responsive strain Streptomyces sp. MBT84 using mass spectral networking revealed elicitation of a BGC that produces the angucycline glycosides aquayamycin, urdamycinone B and galtamycin C. Heterologous expression of the catechol-cleaving enzymes catechol 1,2-dioxygenase or catechol 2,3-dioxygenase counteracted the eliciting effect of catechol. Thus, our work identifies the ubiquitous catechol moiety as a novel elicitor of the expression of BGCs for specialized metabolites.


Conflict of interest statement

The authors declare no competing interests.

Figures
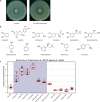
Fig. 1
Fig. 1. The catechol-moiety is key to the eliciting effect of epinephrine on Streptomyces sp. MBT42.
a Streptomyces sp. MBT42 was grown on NA supplemented with and without 100 µM epinephrine (n = 3). After 4 days of growth, plates were overlaid with B. subtilis to test for antimicrobial activity. Note the increased semi-transparent halo surrounding Streptomyces sp. MBT42 grown in presence of epinephrine. b An overview of the structurally related compounds tested. c Effect of different compounds on the bioactivity of Streptomyces sp. MBT42 against B. subtilis. Bioactivity was quantified by measuring the ratio between the surface area of the inhibition zone and the colony (data represent two independent experiments, the number of biologically independent replicates (=n) for each group is indicated in the figure, mean and standard deviation are indicated in red, the grey box highlights the response to compounds with a catechol moiety). One-way ANOVA, followed by a post hoc Tukey’s honest significant difference (HSD) test, was performed to compare the difference in bioactivity between the growth conditions. The symbols indicate a significant increase in bioactivity compared to (a) the control, (b) to compounds lacking a catechol moiety, and (c) to compounds lacking a catechol moiety except hydroquinone.
Fig. 2
Fig. 2. Catechols elicit siderophore production by Streptomyces sp. MBT42.
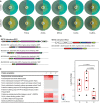
a Streptomyces sp. MBT42 was grown on NA with and without 100 µM catechol, supplemented with various metal salts (5 µM) (n = 3). After 4 days of growth, plates were overlaid with B. subtilis (left) to test for antimicrobial activity or with CAS agar to detect the extracellular production of iron-chelating molecules (orange halos; right). Note that catechol inhibits the growth of B. subtilis and induces siderophore production, and that these zones are highly comparable. When iron was added to the medium, siderophore production was almost completely inhibited and the semi-transparent halo was no longer visible. b Analysis using antiSMASH revealed two siderophore BGCs in the genome of MBT42. KnownClusterBlast output from antiSMASH which shows similar clusters from the MIBiG database. Genes marked with the same color are interrelated; white genes have no relationship. c Change in protein expression of the salinichelin-like BGC of Streptomyces sp. MBT42 in response to catechin (C), dopamine (D), and phenylephrine (P). The heatmap shows the log2 fold change of protein level compared to control (n = 4). Note the similarity between catechin and dopamine. The scatter plot shows the average log2 fold change of each protein. The mean and standard deviation are indicated in red The average log2 fold changes in protein level were compared between the different groups by one-way ANOVA, followed by a post hoc Tukey’s HSD test.
Fig. 3
Fig. 3. Catechol elicits the bioactivity and metabolite production of Streptomyces sp. MBT84.
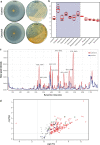
a The antibacterial activity against B. subtilis 168 and yellow pigment production of Streptomyces sp. MBT84 are increased in the presence of catechol. b None of the structurally related compounds, including epinephrine, increased the antibiotic production by Streptomyces sp. MBT84. One-way ANOVA, followed by a post hoc Tukey’s HSD test, was performed to compare the difference in bioactivity between the growth conditions (*p < 0.001, n = 3, mean and standard deviation are indicated in red, the grey box highlights the response to compounds with a catechol moiety). c LC-MS chromatogram overlay of the crude extract of Streptomyces sp. MBT84 grown with and without catechol. Multiple peaks were increased in intensity in the presence of catechol. d Volcano plot highlighting the increased metabolite production by Streptomyces sp. MBT84 in response to catechol. The x and y axes represent the log2 fold changes and the corresponding −log10 FDR-adjusted p-value of all the mass features, respectively. Red circles represent the mass features in catechol-grown cultures with a significant intensity difference of more than twofold compared to control cultures (FDR-adjusted p ≤ 0.1). Circles situated in the top left and top right quadrants represent the mass features that are most induced or repressed, respectively, by catechol with high statistical significance. The m/z values 469.149 and 579.186 are shown in purple and green, respectively (n = 6).
Fig. 4
Fig. 4. Molecular network of the ions detected in the crude extracts of Streptomyces sp. MBT84 revealing a large spectral family of angucyline compounds elicited by catechol.
A pie chart was mapped to the nodes which represents the abundance of each m/z value in the control (blue) and catechol-grown crude extracts (yellow). Nodes highlighted in red represent dereplicated metabolites, while those highlighted in green represent the compounds isolated and identified in this study. Streptomyces sp. MBT84 was grown for five days on MM agar plates with or without 100 µM catechol (n = 6).
Fig. 5
Fig. 5. Identification of the BGC responsible for the production of angucycline glycosides in Streptomyces sp. MBT84 using antiSMASH and MS-based quantitative proteomics.
a KnownClusterBlast output from antiSMASH which shows similar clusters from the MIBiG database. Genes marked with the same color are interrelated; white genes have no relationship. b Volcano plot of MS-based quantitative proteomics for cultures grown with and without catechol (n = 3). Proteins with an FDR-adjusted p-value ≥ 0.1 are grayed out. Proteins with a positive log2 fold change are higher expressed in catechol-grown cultures. c BGC4 coding for the biosynthesis of angucycline glycosides. Annotations are based on BLAST homology searches and genes are color-coded based on putative function. Significantly differentially expressed proteins are depicted in bold (FDR-adjusted p < 0.1, two-sample t-test, n = 3). d Average protein level of BGC4 of cultures grown with and without catechol (n = 3). Mean and standard deviation are indicated in red. Two sample t-test was done showing BGC4 is significantly differentially expressed in presence of catechol.

Similar articles

Cited by

References

    1. Barka EA, et al. Taxonomy, physiology, and natural products of actinobacteria. Microbiol Mol. Biol. Rev. 2016;80:1–43. doi: 10.1128/MMBR.00019-15. - DOI - PMC - PubMed
    1. Bérdy J. Bioactive microbial metabolites. J. Antibiot. 2005;58:1–26. doi: 10.1038/ja.2005.1. - DOI - PubMed
    1. Newman DJ, Cragg GM. Natural products as sources of new drugs over the last 25 years. J. Nat. Prod. 2007;70:461–477. doi: 10.1021/np068054v. - DOI - PubMed
    1. Davies J, Davies D. Origins and evolution of antibiotic resistance. Microbiol Mol. Biol. Rev. 2010;74:417–433. doi: 10.1128/MMBR.00016-10. - DOI - PMC - PubMed
    1. Kolter R, van Wezel GP. Goodbye to brute force in antibiotic discovery? Nat. Microbiol. 2016;1:15020. doi: 10.1038/nmicrobiol.2015.20. - DOI - PubMed