. 2021 Jun 17;4(1):92.
doi: 10.1038/s42004-021-00532-z.

Structural identification of N-glycan isomers using logically derived sequence tandem mass spectrometry

Affiliations

Structural identification of N-glycan isomers using logically derived sequence tandem mass spectrometry

Chia Yen Liew et al. Commun Chem. .

Abstract

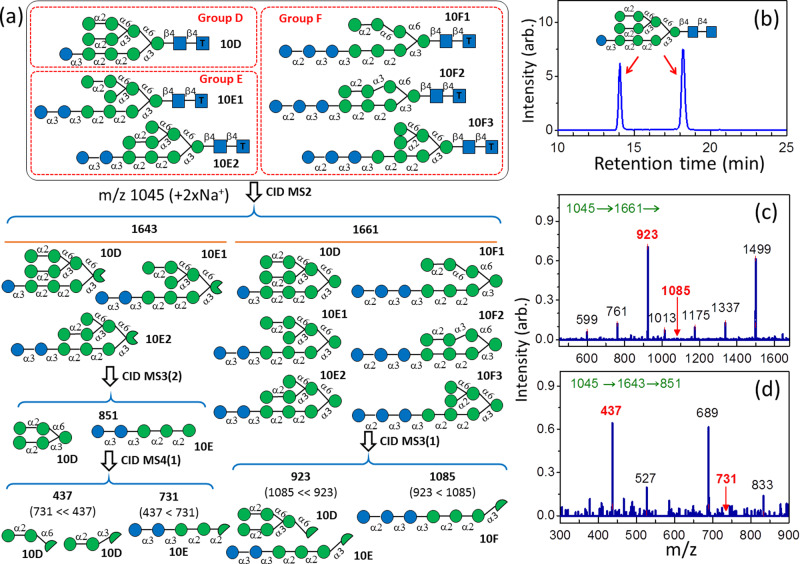
N-linked glycosylation is one of the most important protein post-translational modifications. Despite the importance of N-glycans, the structural determination of N-glycan isomers remains challenging. Here we develop a mass spectrometry method, logically derived sequence tandem mass spectrometry (LODES/MSn), to determine the structures of N-glycan isomers that cannot be determined using conventional mass spectrometry. In LODES/MSn, the sequences of successive collision-induced dissociation are derived from carbohydrate dissociation mechanisms and apply to N-glycans in an ion trap for structural determination. We validate LODES/MSn using synthesized N-glycans and subsequently applied this method to N-glycans extracted from soybean, ovalbumin, and IgY. Our method does not require permethylation, reduction, and labeling of N-glycans, or the mass spectrum databases of oligosaccharides and N-glycan standards. Moreover, it can be applied to all types of N-glycans (high-mannose, hybrid, and complex), as well as the N-glycans degraded from larger N-glycans by any enzyme or acid hydrolysis.


Conflict of interest statement

C.Y.L., S.-T.T., and C.-K.N. are co-inventors of a United States patent (US 10,796,788 B2) that part of the method described in the patent to determine the carbohydrate structure was used in this work. The remaining authors declare no competing interests.

Figures

Fig. 1
Fig. 1. LODES and CID spectra of Man4GlcNAc2N-glycans.
a LODES for Man4GlcNAc2 N-glycans; b CID spectrum of isomer 4F1; c, d CID spectra of isomer 4E2; e, f CID spectra of isomer 4E1; g, h CID spectra of isomer 4D2; i, j CID spectra of isomer 4D1. The numbers (in green) in the horizontal line at the top of each CID spectrum represent the CID sequence. The number on the top of each peak in CID spectrum represents m/z value, which the structural decisive fragments are highlighted in red boldface. Details of the process of structural determination using these spectra are provided in the main text.
Fig. 2
Fig. 2. LODES and CID spectra of asymmetrical biantennary N-glycans.
a LODES for the complex N-glycans 3-G1 and 6-G1 with the tag of 2-aminobenzamide acid (2-AB) at the reducing end. b, c CID spectra of isomer 6-G1 through two CID sequences. Ion m/z 730 in (b) is produced by the α-1→3 glycosidic bond cleavage from the branch with (α-1→3, α-1→6) linkages, and the intensity ratio of ions m/z 670, 640, and 610 [loss of neutrals (m = 60, 90, and 120) from ion m/z 730, respectively] is close to 4:6:1, indicating that the isomer is 6-G1 [propensity 2(a)]. Ion m/z 730 in (c) is produced by the cleavage of β-Man-(1→4)-GlcNAc glycosidic bond, and the intensity ratio of ions m/z 670, 640, and 610 is close to 5:3.5:1, indicating that the isomer is 6-G1 [propensity 2(a)]. d CID spectrum of isomer 3-G1. The intensity of ion m/z 640 is much higher than the intensities of ions m/z 670 and 610, indicating the isomer is 3-G1 [propensity 2(c)]. The numbers (in green) in the horizontal line at the top of each CID spectrum represent the CID sequence. The number on the top of each peak in CID spectrum represents m/z value, which the structural decisive fragments are highlighted in red boldface.
Fig. 3
Fig. 3. LODES and CID spectra of triantennary N-glycans.
a LODES for triantennary N-glycans with the tag (CH2)5NH2 at reducing end; b, c CID spectrum of 3′-sialygalactose and 6′-sialygalactose. dg CID spectra of isomer α-2-3 E1; hj CID spectra of isomer α-2-3 F1; km CID spectra of isomer α-2-6 D1. The numbers (in green) in the horizontal line at the top of each CID spectrum represent the CID sequence. The number on the top of each peak in CID spectrum represents m/z value, which the structural decisive fragments are highlighted in red boldface.
Fig. 4
Fig. 4. LODES and CID spectra of tetra-antennary N-glycans.
a LODES for tetra-antennary N-glycans with the tag of (CH2)5NH2 at the reducing end. The LODES of m/z 771 (denoted by the dashed green line) and the LODES of sialic acid (denoted by the dashed red line) in (a) are analogous to that in Fig. 3a. bd CID spectra of isomer α-2-3 E2. Intensity (ion m/z 448) > intensity (ion m/z 508) in (b) indicates that the isomer belongs to group E [propensity 2(f)]. Intensity (ion m/z 346) > intensity (ion m/z 316) in (c) indicates that the isomer belongs to group E2 [propensity 2(b)]. The ion m/z 406 in (c) includes disaccharides GlcNAc-(1→4)-Man and GlcNAc-(1→2)-Man; thus, the intensity of ion m/z 286 in (c) is not included in the comparison of the intensities of ions m/z 346 and 316. eg CID spectra of isomer α-2-6 D2. Intensity (ion m/z 448) < intensity (ion m/z 508) in (e) indicates that the isomer belongs to group D [propensity 2(f)]. Intensity (ion m/z 508) > intensity (ion m/z 478) and intensity (m/z = 448) in (f) indicates that the isomer is D2 (propensity 2(b)). A comparison of (d) and (g) with Fig. 3b, c suggests the glycosidic bond of sialic acid is α-2→3 and α-2→6, respectively. The numbers (in green) in the horizontal line at the top of each CID spectrum represent the CID sequence. The number on the top of each peak in CID spectrum represents m/z value, which the structural decisive fragments are highlighted in red boldface.
Fig. 5
Fig. 5. Chromatograms and structural assignments of Hex8GlcNAc2N-glycan from soybean and Man4GlcNAc2N-glycans from hen egg ovalbumin.
a Chromatograms (total intensity of fragments from ion m/z 1743) of Hex8GlcNAc2 N-glycan extracted from soybean proteins. This chromatogram shows the last separation in two-dimensional high-performance liquid chromatography (HPLC). b Chromatograms of the eluents collected from the chromatogram in (a). The eluents corresponding to the chromatogram in (a) were collected every 30 s. After repeating the collection of ten times, the eluents were stored in collecting tubes at room temperature for 6 h. Then the eluents were concentrated and reinjected into the same HPLC separately. The same retention time and relative intensities of the two peaks in chromatogram (b) are the same as that in chromatogram (a), representing they represent the α and β anomeric configurations of the sugar at the reducing end of the same isomer. c Chromatogram (total intensity of fragments from ion m/z 1097) of Man4GlcNAc2 N-glycans extracted from hen egg ovalbumin. This chromatogram shows the last separation in four-dimensional HPLC. The reduction of Man4-N-glycans was performed to demonstrate that LODES/MSn can be applied to N-glycans after reduction. Two peaks in the chromatogram represent two isomers. The details of HPLC conditions are described in Methods and the mass spectra used in LODES/MSn for structural determination are presented in Supplementary Information Figs. S4 and S5.
Fig. 6
Fig. 6. LODES, chromatograms, and CID spectra of Hex10GlcNAc2N-glycans from IgY.
a LODES for the structural determination of Hex10GlcNAc2 N-glycans. Only the LODES used for identifying isomer 10D is illustrated. The complete LODES of Hex10GlcNAc2 N-glycans is illustrated in the Supplementary Fig. S6. b Chromatogram (selective ion monitoring of ion m/z 1045) of Hex10GlcNAc2 N-glycan extracted from IgY. The chromatogram denotes the last separation in two-dimensional HPLC. Two peaks in the chromatogram represent the α and β anomeric configurations of the sugar at the reducing end of the same isomer. c, d CID mass spectra used to identify the structure. The intensity of ion m/z 923 is much higher than that of ion m/z 1085 in (b), indicating the Hex10GlcNAc2 belongs to groups D or E, according to MS3(1) in (a). The intensity of ion m/z 437 is much higher than that of ion m/z 731 in (c), indicating Hex10GlcNAc2 is isomer 10D according to MS4(1) in (a). The numbers (in green) in the horizontal line at the top of each CID spectrum represent the CID sequence. The number on the top of each peak in CID spectrum represents m/z value, which the structural decisive fragments are highlighted in red boldface.

Similar articles

Cited by

References

    1. Shental-Bechor D, Levy Y. Effect of glycosylation on protein folding: a close look at thermodynamic stabilization. Proc. Natl Acad. Sci. USA. 2008;105:8256–8261. doi: 10.1073/pnas.0801340105. - DOI - PMC - PubMed
    1. Live DH, Kumar RA, Beebe X, Danishefsky SJ. Conformational influences of glycosylation of a peptide: a possible model for the effect of glycosylation on the rate of protein folding. Proc. Natl Acad. Sci. USA. 1996;93:12759–12761. doi: 10.1073/pnas.93.23.12759. - DOI - PMC - PubMed
    1. Evers DL, Hung RL, Thomas VH, Rice KG. Preparative purification of a high-mannose type N-glycan from soy bean agglutinin by hydrazinolysis and tyrosinamide derivatization. Anal. Biochem. 1998;265:313–316. doi: 10.1006/abio.1998.2895. - DOI - PubMed
    1. Patrizi LD, et al. Structural characterization of the N-glycans of gp273, the ligand for sperm-egg interaction in the mollusc bivalve Unio elongatulusa. Glycoconj. J. 2001;18:511–518. doi: 10.1023/A:1019617728660. - DOI - PubMed
    1. Wang N, Seko A, Takeda Y, Ito Y. Preparation of asparagine-linked monoglucosylated high-mannosetype oligosaccharide from egg yolk. Carbohydr. Res. 2015;411:37–41. doi: 10.1016/j.carres.2015.04.011. - DOI - PubMed