

Alkanes increase the stability of early life membrane models under extreme pressure and temperature conditions
- PMID: 36697785
- PMCID: PMC9814696
- DOI: 10.1038/s42004-021-00467-5
Alkanes increase the stability of early life membrane models under extreme pressure and temperature conditions
Abstract
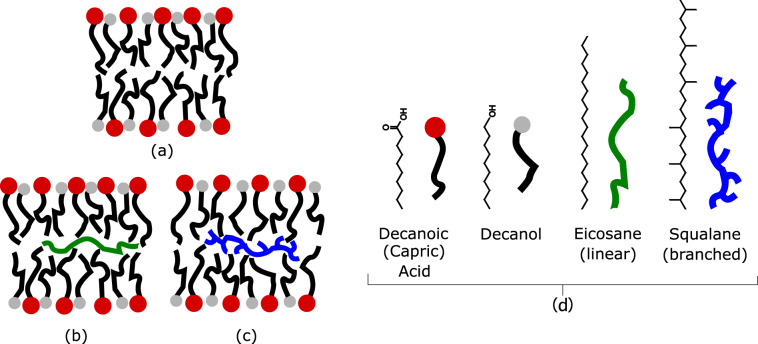
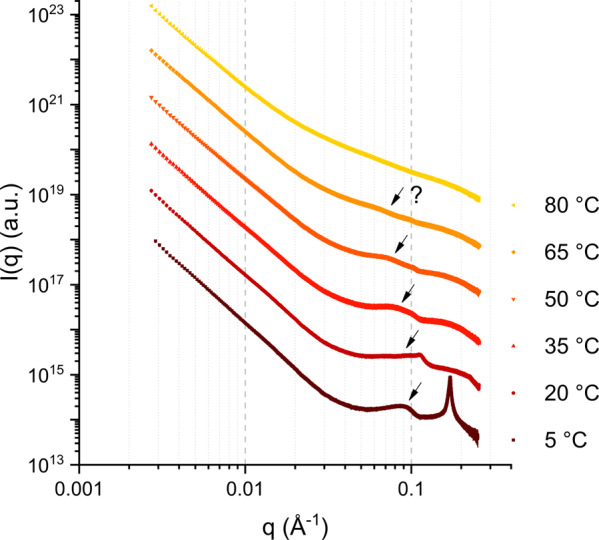
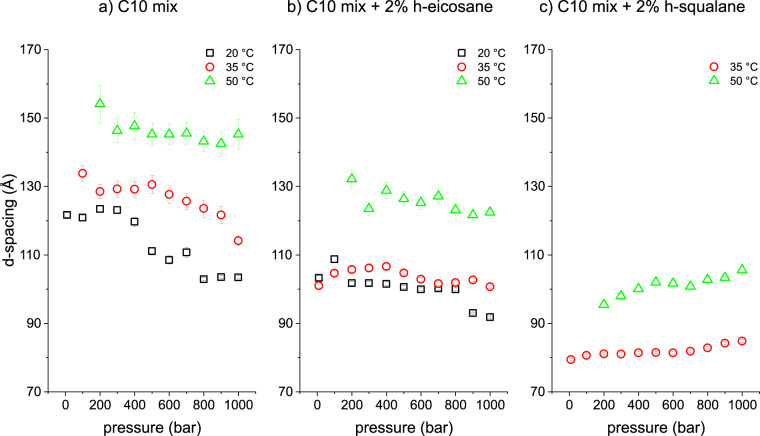
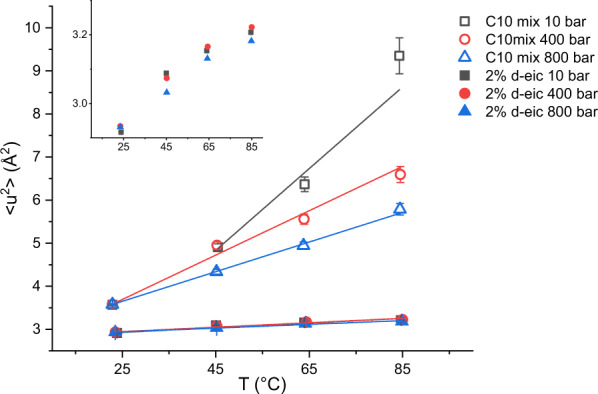
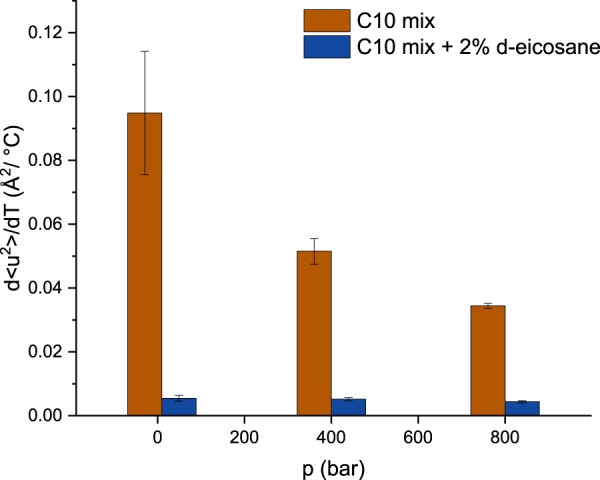
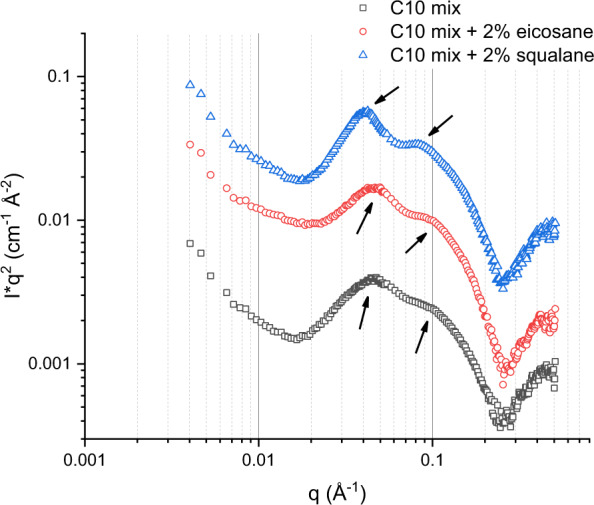
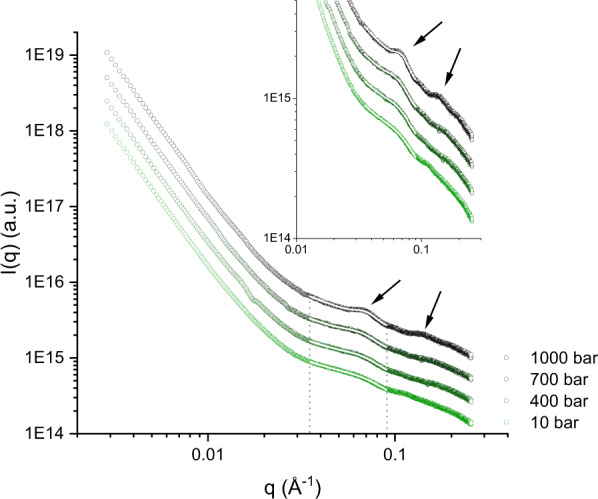
Terrestrial life appeared on our planet within a time window of [4.4-3.5] billion years ago. During that time, it is suggested that the first proto-cellular forms developed in the surrounding of deep-sea hydrothermal vents, oceanic crust fractures that are still present nowadays. However, these environments are characterized by extreme temperature and pressure conditions that question the early membrane compartment's capability to endure a stable structural state. Recent studies proposed an adaptive strategy employed by present-day extremophiles: the use of apolar molecules as structural membrane components in order to tune the bilayer dynamic response when needed. Here we extend this hypothesis on early life protomembrane models, using linear and branched alkanes as apolar stabilizing molecules of prebiotic relevance. The structural ordering and chain dynamics of these systems have been investigated as a function of temperature and pressure. We found that both types of alkanes studied, even the simplest linear ones, impact highly the multilamellar vesicle ordering and chain dynamics. Our data show that alkane-enriched membranes have a lower multilamellar vesicle swelling induced by the temperature increase and are significantly less affected by pressure variation as compared to alkane-free samples, suggesting a possible survival strategy for the first living forms.
© 2021. The Author(s).
Conflict of interest statement
The authors declare no competing interests.
Figures

Similar articles
-
Alkanes as Membrane Regulators of the Response of Early Membranes to Extreme Temperatures.Life (Basel). 2022 Mar 17;12(3):445. doi: 10.3390/life12030445. Life (Basel). 2022. PMID: 35330196 Free PMC article.
-
[Microbial diversity of deep-sea extremophiles--Piezophiles, Hyperthermophiles, and subsurface microorganisms].Biol Sci Space. 2000 Dec;14(4):341-52. doi: 10.2187/bss.14.341. Biol Sci Space. 2000. PMID: 11589226 Japanese.
-
Microporous Metal-Organic Frameworks for Adsorptive Separation of C5-C6 Alkane Isomers.Acc Chem Res. 2019 Jul 16;52(7):1968-1978. doi: 10.1021/acs.accounts.8b00658. Epub 2019 Mar 18. Acc Chem Res. 2019. PMID: 30883088
-
Relevance of Earth-Bound Extremophiles in the Search for Extraterrestrial Life.Astrobiology. 2022 Mar;22(3):322-367. doi: 10.1089/ast.2021.0033. Epub 2022 Feb 2. Astrobiology. 2022. PMID: 35108099 Review.
-
Bacterial exopolysaccharides from extreme marine habitats: production, characterization and biological activities.Mar Drugs. 2010 Jun 3;8(6):1779-802. doi: 10.3390/md8061779. Mar Drugs. 2010. PMID: 20631870 Free PMC article. Review.
Cited by
-
Residual Membrane Fluidity in Mycobacterial Cell Envelope Layers under Extreme Conditions Underlines Membrane-Centric Adaptation.J Phys Chem B. 2024 Jul 18;128(28):6838-6852. doi: 10.1021/acs.jpcb.4c02469. Epub 2024 Jul 3. J Phys Chem B. 2024. PMID: 38960927 Free PMC article.
-
Hybrid organic-inorganic structures trigger the formation of primitive cell-like compartments.Proc Natl Acad Sci U S A. 2023 Aug 15;120(33):e2300491120. doi: 10.1073/pnas.2300491120. Epub 2023 Aug 10. Proc Natl Acad Sci U S A. 2023. PMID: 37561785 Free PMC article.
-
Hydrocarbon Desaturation in Cyanobacterial Thylakoid Membranes Is Linked With Acclimation to Suboptimal Growth Temperatures.Front Microbiol. 2021 Nov 26;12:781864. doi: 10.3389/fmicb.2021.781864. eCollection 2021. Front Microbiol. 2021. PMID: 34899663 Free PMC article.
-
Alkanes as Membrane Regulators of the Response of Early Membranes to Extreme Temperatures.Life (Basel). 2022 Mar 17;12(3):445. doi: 10.3390/life12030445. Life (Basel). 2022. PMID: 35330196 Free PMC article.
-
Characterisation of a synthetic Archeal membrane reveals a possible new adaptation route to extreme conditions.Commun Biol. 2021 Jun 2;4(1):653. doi: 10.1038/s42003-021-02178-y. Commun Biol. 2021. PMID: 34079059 Free PMC article.
References
Grants and funding
LinkOut - more resources
Full Text Sources
