. 2023 Feb;614(7946):118-124.
doi: 10.1038/s41586-022-05637-6. Epub 2023 Jan 25.

Insulin-regulated serine and lipid metabolism drive peripheral neuropathy

Affiliations

Insulin-regulated serine and lipid metabolism drive peripheral neuropathy

Michal K Handzlik et al. Nature. 2023 Feb.

Abstract

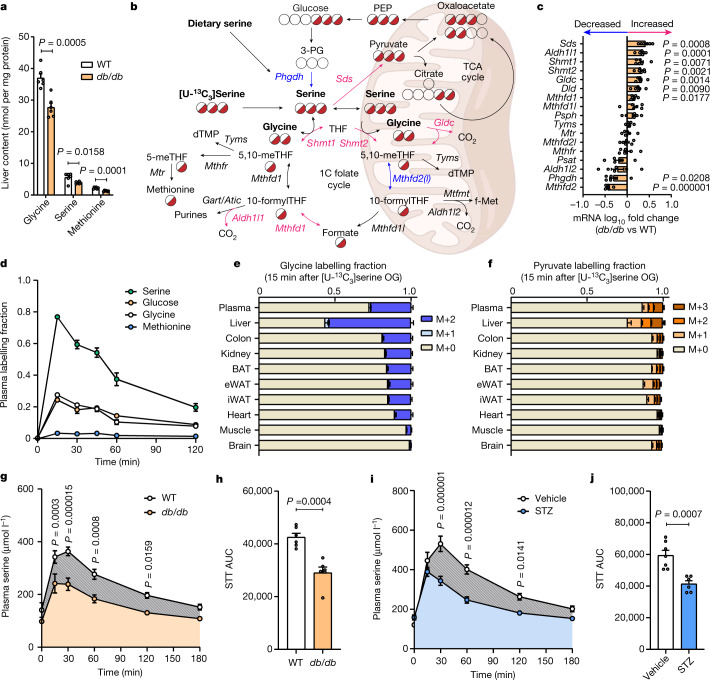
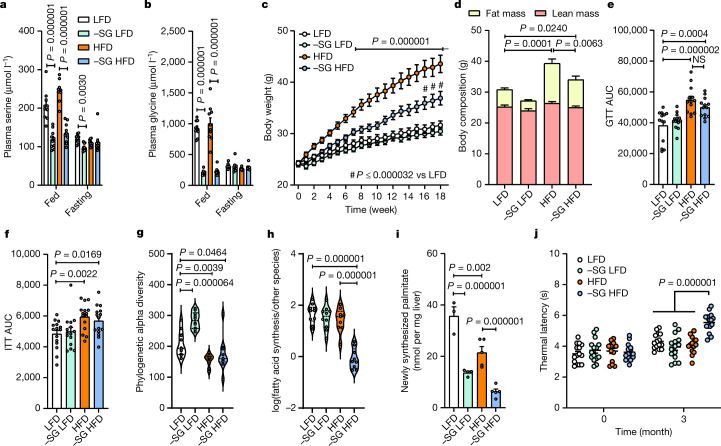
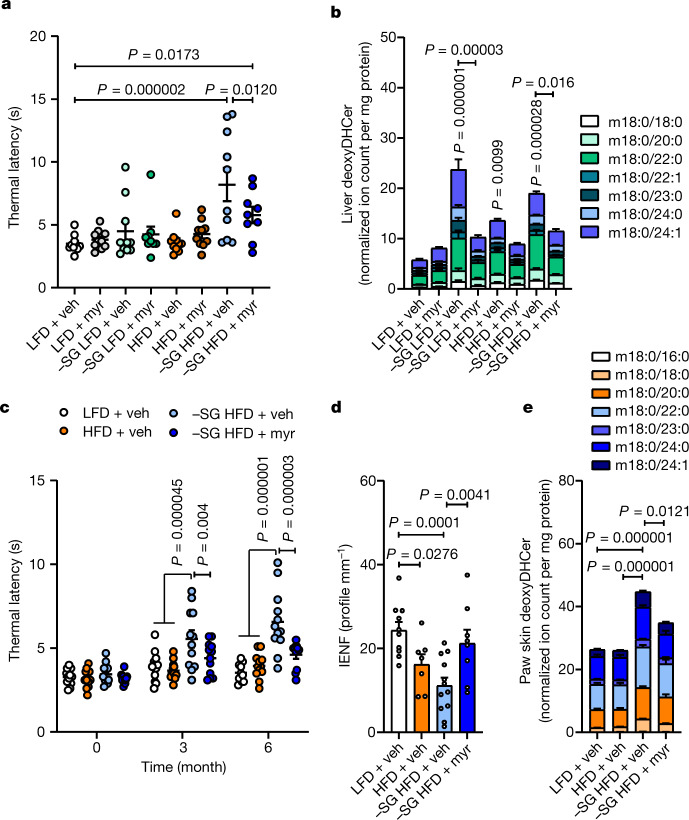
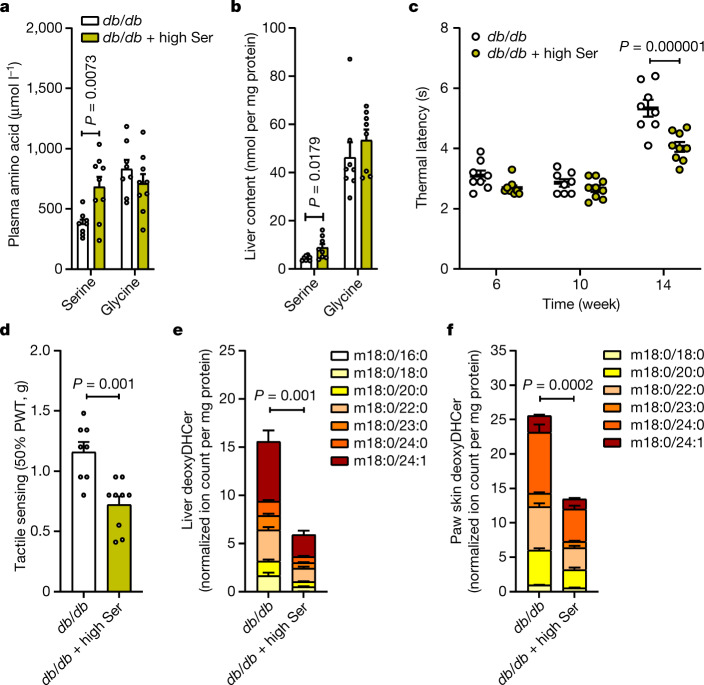
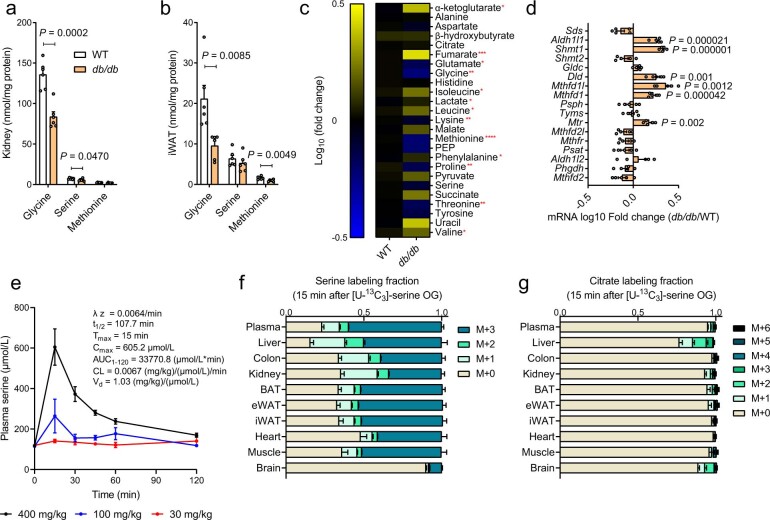
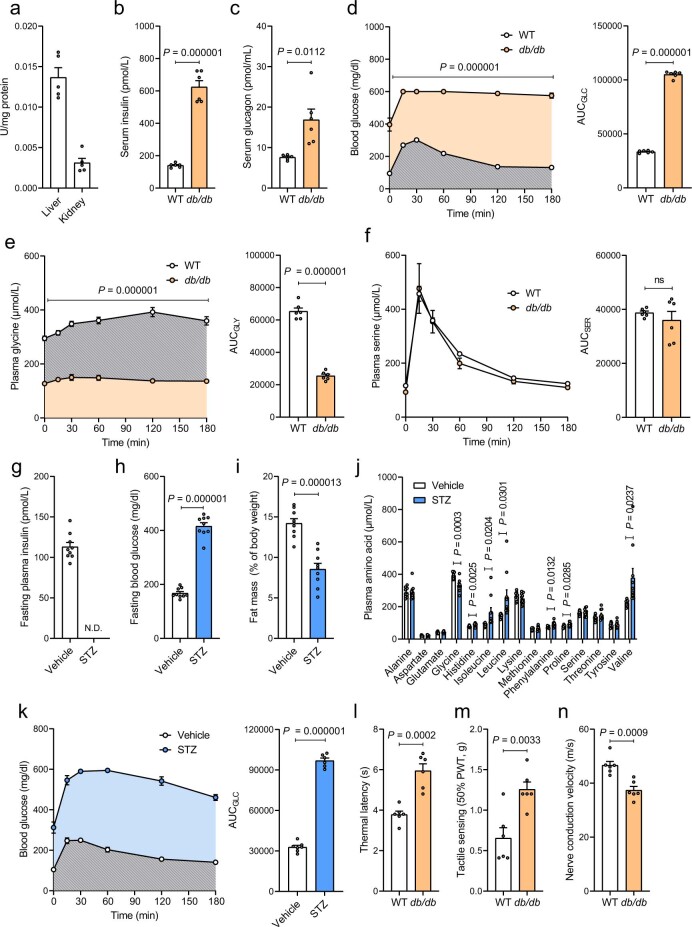
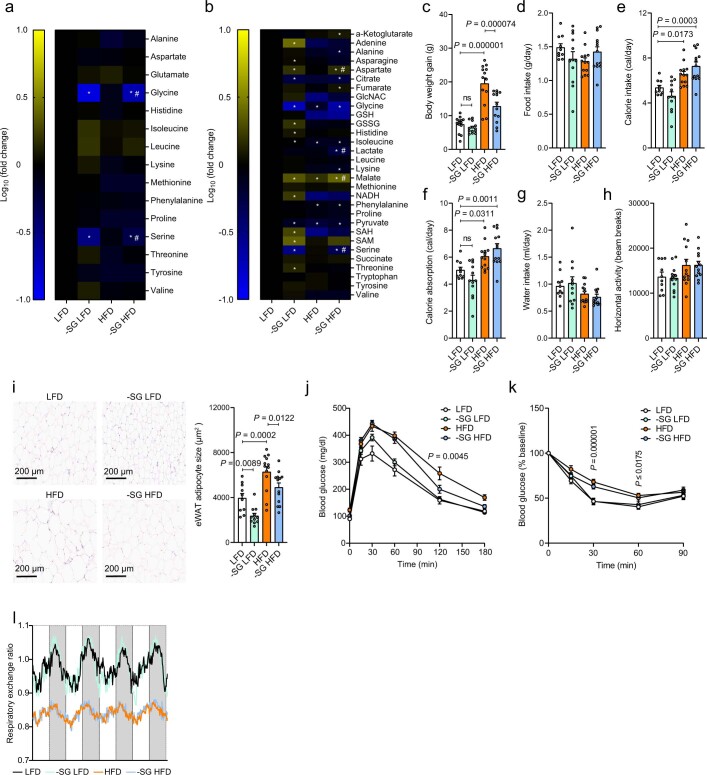
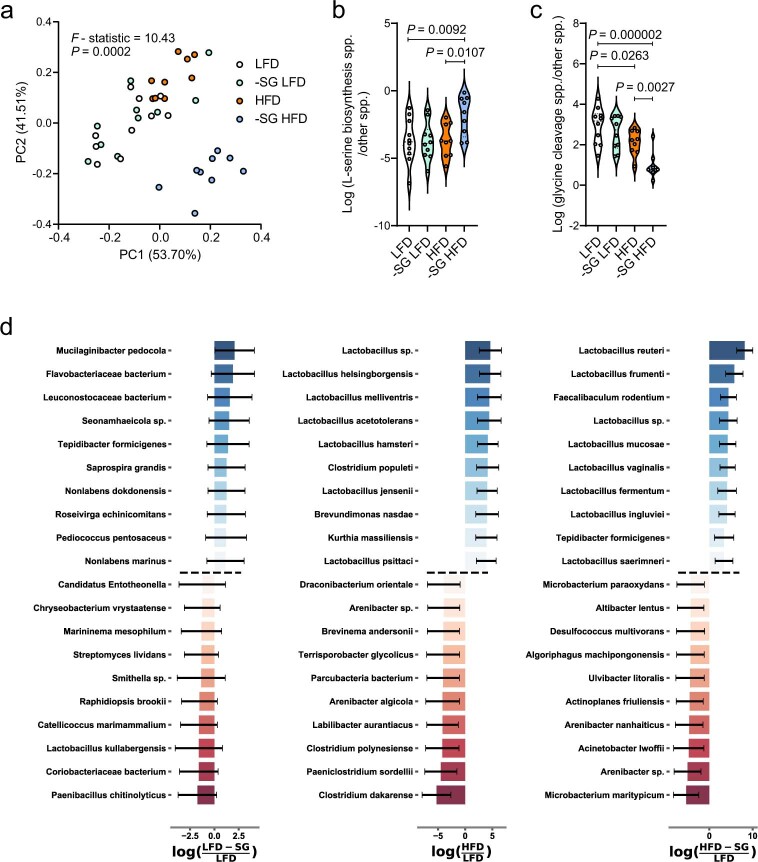
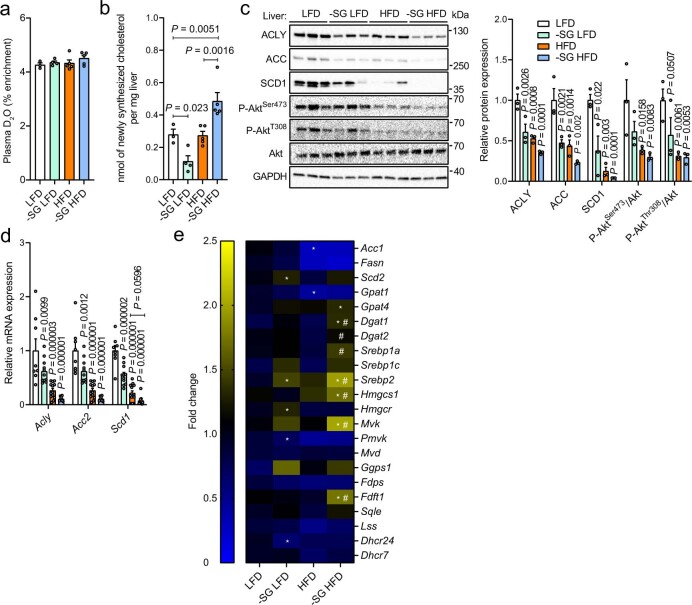
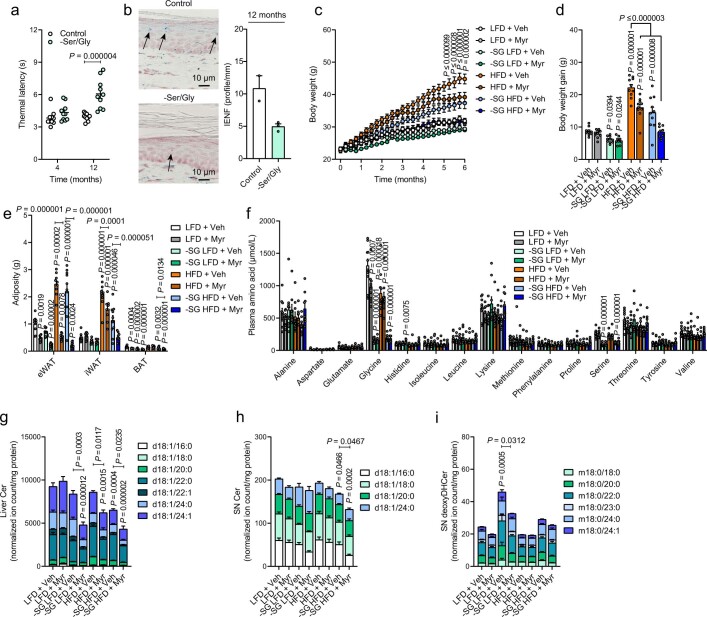
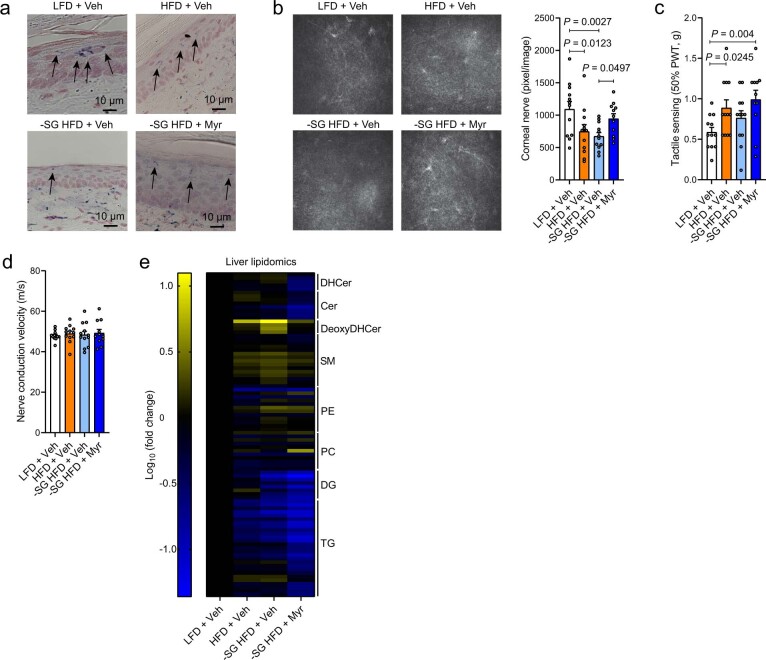
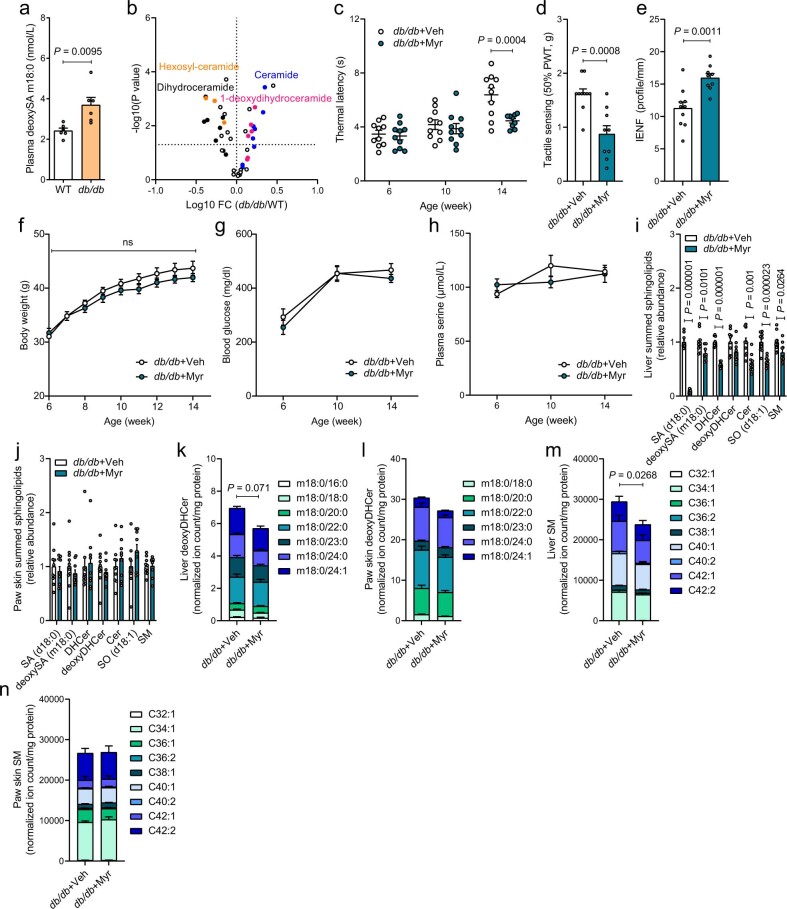
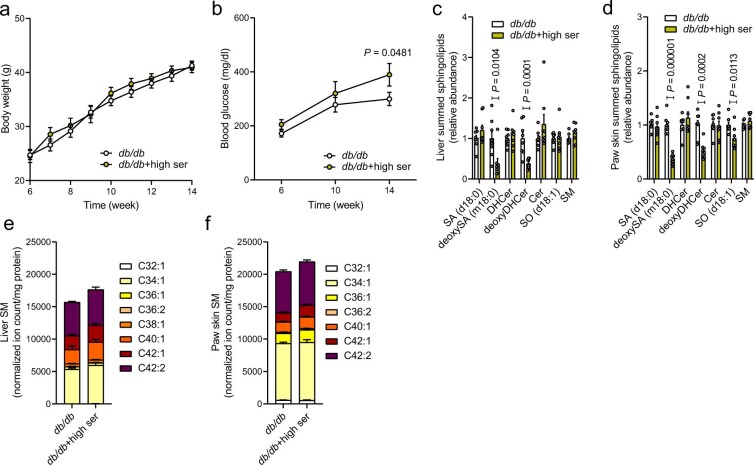
Diabetes represents a spectrum of disease in which metabolic dysfunction damages multiple organ systems including liver, kidneys and peripheral nerves1,2. Although the onset and progression of these co-morbidities are linked with insulin resistance, hyperglycaemia and dyslipidaemia3-7, aberrant non-essential amino acid (NEAA) metabolism also contributes to the pathogenesis of diabetes8-10. Serine and glycine are closely related NEAAs whose levels are consistently reduced in patients with metabolic syndrome10-14, but the mechanistic drivers and downstream consequences of this metabotype remain unclear. Low systemic serine and glycine are also emerging as a hallmark of macular and peripheral nerve disorders, correlating with impaired visual acuity and peripheral neuropathy15,16. Here we demonstrate that aberrant serine homeostasis drives serine and glycine deficiencies in diabetic mice, which can be diagnosed with a serine tolerance test that quantifies serine uptake and disposal. Mimicking these metabolic alterations in young mice by dietary serine or glycine restriction together with high fat intake markedly accelerates the onset of small fibre neuropathy while reducing adiposity. Normalization of serine by dietary supplementation and mitigation of dyslipidaemia with myriocin both alleviate neuropathy in diabetic mice, linking serine-associated peripheral neuropathy to sphingolipid metabolism. These findings identify systemic serine deficiency and dyslipidaemia as novel risk factors for peripheral neuropathy that may be exploited therapeutically.


Conflict of interest statement

C.M.M. is a scientific advisor for Faeth Therapeutics. The other authors declare no competing interests.

Figures

Fig. 1
Fig. 1. Sources and sinks of altered serine metabolism in diabetes.
a, Levels of glycine, serine and methionine in the liver of wild-type and BKS-db/db mice after a 6-h fast (n = 6 per group). b, Schematic of serine and glycine biosynthetic and catabolic pathways. Upregulated hepatic genes in BKS-db/db mice are in purple, and downregulated are genes are in blue. 10-formylTHF, 10-formyltetrahydrofolate; 3-PG, 3-phosphoglycerate; 5,10-meTHF, 5,10-methylenetetrahydrofolate; dTMP, deoxythymidine monophosphate; f-Met, N-formylmethionine; PEP, phosphoenol pyruvate; TCA, tricarboxylic acid; THF, tetrahydrofolate. c, mRNA expression of liver enzyme genes regulating SGOC metabolism in wild-type and BKS-db/db mice (n = 6 per group). d, Plasma serine, glucose, glycine and methionine-labelling fraction (1 − M0) in wild-type mice administered [U-13C3]serine via oral gavage after an overnight fast (n = 4 per time point). e, Tissue glycine labelling fraction in wild-type mice 15 min after [U-13C3]serine administration via oral gavage (n = 4 per tissue) following an overnight fast. f, Tissue pyruvate labelling fraction in wild-type mice 15 min after [U-13C3]serine administration via oral gavage (n = 4 per tissue) after an overnight fast. g, Combined OGTT and STT in wild-type and BKS-db/db mice (n = 6 per group) after an overnight fast. h, STT AUC in wild-type and BKS-db/db mice (n = 6 per group). i, Combined OGTT and STT in vehicle- (n = 7) and STZ-treated (n = 6) C57BL/6J mice after an overnight fast. j, STT AUC in vehicle- (n = 7) and STZ-treated (n = 6) C57BL/6J mice. Data are mean ± s.e.m., and were analysed using two-sided independent t-test (a,c,h,j) and two-way ANOVA with Fisher’s least significant difference post hoc test (g,i). The schematic in Fig. 1b was prepared in BioRender.
Fig. 2
Fig. 2. Dietary serine restriction suppresses fatty acid synthesis and mitigates adiposity.
a, Plasma serine levels in fed and overnight-fasted mice fed with LFD, −SG LFD, HFD or −SG HFD for 18 weeks (n = 10 per group). b, Plasma glycine levels in mice fed with LFD, −SG LFD, HFD or −SG HFD for 18 weeks (n = 10 per group). c, Body weight of mice fed with LFD, −SG LFD, HFD, or −SG HFD (n = 13 per group). d, Body composition in mice 18 weeks after feeding with LFD (n = 10), −SG LFD (n = 12), HFD (n = 13) or −SG HFD (n = 13). e, Glucose tolerance test (GTT) AUC 18 weeks after feeding with LFD, −SG LFD, HFD or −SG HFD (n = 13 per group). f, Insulin tolerance test (ITT) AUC 18 weeks after feeding with LFD, −SG LFD, HFD or −SG HFD (n = 15 per group). g, Phylogenetic alpha diversity in mice fed with LFD, −SG LFD, HFD or −SG HFD (n = 10 per group). h, Log fraction of species from the fatty acid synthesis pathway in mice fed with LFD (n = 10), −SG LFD (n = 10), HFD (n = 9) or −SG HFD (n = 9) for 18 weeks. i, Hepatic de novo palmitate synthesis in mice fed with LFD (n = 3), −SG LFD (n = 4), HFD (n = 5) or −SG HFD (n = 5) for 18 weeks. j, Thermal sensing in mice fed with LFD (n = 15), −SG LFD (n = 15), HFD (n = 14) or −SG HFD (n = 15 per group). Data are mean ± s.e.m. and minimum and maximum (g,h), and were analysed using two-way ANOVA with Fisher’s least significant difference post hoc test (aj).
Fig. 3
Fig. 3. Inhibition of de novo sphingolipid biosynthesis decelerates the kinetics of serine-associated peripheral neuropathy.
a, Thermal latency in mice fed with LFD plus vehicle (veh) (n = 10), LFD plus 0.3 mg kg−1 myriocin (myr) (n = 10), −SG LFD plus vehicle (n = 10), −SG LFD plus myriocin (n = 9), HFD plus vehicle (n = 10), HFD plus myriocin (n = 10), −SG HFD plus vehicle (n = 10) or −SG HFD plus myriocin (n = 9). b, Stack plot of liver deoxyDHCer in mice fed with LFD plus vehicle (n = 10), LFD plus myriocin (n = 10), −SG LFD plus vehicle (n = 10), −SG LFD plus myriocin (n = 9), HFD plus vehicle (n = 10), HFD plus myriocin (n = 10), −SG HFD plus vehicle (n = 10) or −SG HFD plus myriocin (n = 9). c, Thermal latency time course in mice fed with LFD plus vehicle (n = 12), HFD plus vehicle (n = 12), −SG HFD plus vehicle (n = 12) or −SG HFD plus myriocin (n = 11). d, IENF density in mice fed with LFD plus vehicle (n = 10), HFD plus vehicle (n = 7), −SG HFD plus vehicle (n = 12) or −SG HFD plus myriocin (n = 8). e, Paw skin deoxyDHCer distribution in mice fed with LFD plus vehicle (n = 12), HFD plus vehicle (n = 12), −SG HFD plus vehicle (n = 12) or −SG HFD plus myriocin (n = 11). Data are mean ± s.e.m., and were analysed using one-way ANOVA with Fisher’s least significant difference post hoc test (a,b,d,e) or two-way ANOVA with Fisher’s least significant difference post hoc test (c). Statistical analyses in b,e were performed using summed deoxyDHCer abundances.
Fig. 4
Fig. 4. Dietary serine supplementation reduces deoxysphingolipid content and slows down peripheral neuropathy.
a, Plasma amino acid levels in the fed state in BKS-db/db mice fed with either a control (n = 8) or serine-supplemented diet (n = 9) for 8 weeks. b, Liver amino acid content in the fed state in BKS-db/db mice fed with either a control or serine-supplemented diet for 8 weeks (n = 8 per group). c, Thermal latency time course in BKS-db/db mice fed with either a control (n = 8) or serine-supplemented diet (n = 9). d, Tactile sensing 8 weeks after feeding BKS-db/db mice with either a control (n = 8) or serine-supplemented diet (n = 9). e, Levels of deoxyDHCer in the liver in BKS-db/db mice fed with either a control or serine-supplemented diet for 8 weeks (n = 8 per group). f, Levels of deoxyDHCer in the paw skin of BKS-db/db mice fed with either a control or serine-supplemented diet for 8 weeks (n = 8 per group). Data are mean ± s.e.m., and were analysed using a two-sided independent t-test (a,b,df) or two-way ANOVA with Fisher’s least significant difference post hoc test (c). Statistical analyses in e,f were performed using summed deoxyDHCer abundances.
Extended Data Fig. 1
Extended Data Fig. 1. Serine and glycine metabolism in diabetes.
(a) Levels of glycine, serine, and methionine in WT and BKS-db/db mice in the kidney (n = 6 per group). (b) Levels of glycine, serine, and methionine in WT and BKS-db/db mice in the inguinal adipose tissue (iWAT) (n = 6 per group). (c) Plasma metabolite levels in WT and BKS-db/db mice (n = 6 per group). (d) mRNA expression of kidney enzymes regulating serine, glycine, and one-carbon metabolism in WT (n = 6) and BKS-db/db mice (n = 5). (e) Serine tolerance test (STT) in C57BL/6J mice after an overnight fast (n = 4 per dose). (f) Tissue serine labeling fraction in WT mice 15 min after [U-13C3]serine administration via oral gavage (n = 4 per tissues) after an overnight fast. (g) Tissue citrate labeling fraction in WT mice 15 min after [U-13C3]serine administration via oral gavage (n = 4 per tissues) after an overnight fast. Data are mean ± standard error of mean (SEM) and were analyzed using a two-sided independent t-test (a–d). * P < 0.05, ** P < 0.01, *** P < 0.001, **** P < 0.0001 vs. WT group.
Extended Data Fig. 2
Extended Data Fig. 2. Serine tolerance test in type 1 and 2 diabetic mice.
(a) Serine dehydratase activity determined in the liver and kidney in C57BL/6J mice in the fed state (n = 5 per tissues). (b) Serum insulin in WT and BKS-db/db mice quantified after a 6-h fast (n = 6 per group). (c) Serum glucagon in WT (n = 5) and BKS-db/db (n = 6) mice quantified after a 6-h fast. (d) Plasma glucose pharmacokinetics and area under curve (AUCGLC) in WT and BKS-db/db mice following GTT/STT with glucose dosed at 2 g/kg (n = 6 per group) after an overnight fast. (e) Plasma glycine pharmacokinetics and area under curve (AUCGLY) in WT and BKS-db/db mice following GTT/STT with glucose dosed at 2 g/kg (n = 6 per group) after an overnight fast. (f) Serine tolerance test (STT) and area under curve (AUCSER) in WT and BKS-db/db mice (n = 6 per group) dosed with serine (400 mg/kg) only after an overnight fast. (g) Fasting (6-h) plasma insulin level in C57BL/6J mice treated with vehicle or streptozotocin (STZ) 1 week after injection (n = 9 per group). (h) Fasting (6-h) blood glucose in C57BL/6J mice treated with vehicle or streptozotocin (STZ) 1 week after injection (n = 9 per group). (i) Body fat mass content in C57BL/6J mice treated with vehicle or streptozotocin (STZ) 1 week after injection (n = 9 per group). (j) Fasting (6-h) plasma amino acid concentration in C57BL/6J mice treated with vehicle (n = 9) or streptozotocin (STZ, n = 10) 1 week after injection. (k) Plasma glucose pharmacokinetics and area under curve (AUCGLC) after an overnight fast during GTT/STT in C57BL/6J mice treated with vehicle (n = 7) or streptozotocin (STZ, n = 6) 2 weeks after injections with glucose dosed at 2 g/kg. (l) Thermal latency in 14-week-old WT and BKS-db/db mice (n = 6 per group). (m) Tactile sensing in 14-week-old WT and BKS-db/db mice (n = 6 per group). (n) Motor nerve conduction velocity in 14-week-old WT and BKS-db/db mice (n = 6 per group). Data are mean ± standard error of mean (SEM) and were analyzed using a two-sided independent t-test (b–n) and a two-way ANOVA with Fisher’s LSD post hoc test (e–f, k time-course experiments).
Extended Data Fig. 3
Extended Data Fig. 3. Dietary serine restriction and metabolic homeostasis.
(a) Plasma amino acid level in the fed state in mice fed with a low fat diet (LFD, n = 5), serine/glycine-free LFD (-SG LFD, n = 8), high-fat diet (HFD, n = 8), and serine/glycine free HFD (-SG HFD, n = 8) for 18 weeks. (b) Liver metabolite content in mice fed with a low fat diet (LFD, n = 10), serine/glycine-free LFD (-SG LFD, n = 10), high-fat diet (HFD, n = 10), and serine/glycine free HFD (-SG HFD, n = 10) for 18 weeks. (c) Body weight gain 18 weeks after dietary intervention (n = 13 per group). (d) Food intake in response to an 18-week dietary feeding in mice with a low fat diet (LFD, n = 10), serine/glycine-free LFD (-SG LFD, n = 12), high fat diet (HFD, n = 13), and serine/glycine-free HFD (-SG HFD, n =  = 13). (e) Calorie intake in response to an 18-week dietary feeding in mice with a low fat diet (LFD, n = 10), serine/glycine-free LFD (-SG LFD, n = 12), high fat diet (HFD, n = 13), and serine/glycine-free HFD (-SG HFD, n = 13). (f) Calorie absorption in response to an 18-week dietary feeding in mice with a low fat diet (LFD, n = 10), serine/glycine-free LFD (-SG LFD, n = 12), high fat diet (HFD, n = 13), and serine/glycine-free HFD (-SG HFD, n = 13). (g) Water intake in response to an 18-week dietary feeding in mice with a low fat diet (LFD, n = 10), serine/glycine-free LFD (-SG LFD, n = 12), high fat diet (HFD, n = 13), and serine/glycine-free HFD (-SG HFD, n = 13). (h) Physical activity in response to an 18-week dietary feeding in mice with a low fat diet (LFD, n = 10), serine/glycine-free LFD (-SG LFD, n = 12), high fat diet (HFD, n = 13), and serine/glycine-free HFD (-SG HFD, n = 13). (i) Representative images and quantification of adipocyte size in response to an 18-week dietary feeding in mice with a low fat diet (LFD, n = 10), serine/glycine-free LFD (-SG LFD, n =  = 12), high fat diet (HFD, n = 13), and serine/glycine-free HFD (-SG HFD, n = 13). (j) I.P. glucose tolerance test 18 weeks after feeding with a low fat diet (LFD) or high fat diet (HFD) replete or deficient in serine and glycine (n = 13 per group). (k) I.P. insulin tolerance test 18 weeks after feeding with a low fat diet (LFD) or high fat diet (HFD) replete or deficient in serine and glycine (n = 15 per group). (l) Respiratory exchange ratio time course 18 weeks after feeding mice with a low fat diet (LFD, n = 10), serine/glycine-free LFD (-SG LFD, n = 12), high fat diet (HFD, n = 13), and serine/glycine-free HFD (-SG HFD, n =  = 13). Data are mean ± standard error of mean (SEM) and were analyzed using a two-way ANOVA with Fisher’s LSD post hoc test (a–k). * P < 0.05, ** P < 0.01, *** P < 0.001, **** P < 0.0001 vs. LFD. # P < 0.05 vs. HFD group.
Extended Data Fig. 4
Extended Data Fig. 4. The impact of dietary serine restriction on microbiome composition.
(a) Robust principal-component analysis of microbiome beta-diversity 18 weeks after feeding mice with a low fat diet (LFD, n = 10), serine/glycine-free LFD (-SG LFD, n = 10), high fat diet (HFD, n = 9), and serine/glycine-free HFD (-SG HFD, n = 9). (b) Log-ratio of species with complete vs. incomplete pathways for L-serine biosynthesis 18 weeks after feeding mice with a low fat diet (LFD, n = 10), serine/glycine-free LFD (-SG LFD, n = 10), high fat diet (HFD, n = 9), and serine/glycine-free HFD (-SG HFD, n = 9). (c) Log-ratio of species with complete vs. incomplete pathways for glycine cleavage 18 weeks after feeding mice with a low fat diet (LFD, n = 10), serine/glycine-free LFD (-SG LFD, n = 10), high fat diet (HFD, n = 9), and serine/glycine-free HFD (-SG HFD, n = 9). (d) Log fold-change of microbiome species 18 weeks after feeding mice with a low fat diet (LFD, n = 10), serine/glycine-free LFD (-SG LFD, n = 10), high fat diet (HFD, n = 9), and serine/glycine-free HFD (-SG HFD, n = 9). Data are presented as a minimum/maximum (b–c) and were analyzed using a PERMANOVA test (a) and a two-way ANOVA with Fisher’s LSD post hoc test (b–c).
Extended Data Fig. 5
Extended Data Fig. 5. Dietary serine restriction remodels fatty acid and cholesterol synthesis.
(a) Plasma heavy water (D2O) enrichment in mice fed a with low fat diet (LFD, n = 3), serine/glycine-free LFD (-SG LFD, n = 4), high fat diet (HFD, n = 5), and serine/glycine-free HFD (-SG HFD, n = 5). (b) De novo cholesterol synthesis in mice fed with LFD (n = 3), -SG LFD (n = 4), HFD (n = 5), and -SG HFD (n = 5) for 18 weeks. (c) Hepatic protein expression of ATP-citrate lyase (ACLY), acetyl-CoA carboxylase (ACC), and steroyl-CoA desaturase 1 (SCD1), P-AktS473, and P-AktT308 (n = 3 per group). (d) Hepatic mRNA expression of ATP-citrate lyase (Acly), acetyl-CoA carboxylase (Acc2), and steroyl-CoA desaturase 1 (Scd1) in mice fed with a low fat diet (LFD, n = 8), serine/glycine-free LFD (-SG LFD, n = 11), high fat diet (HFD, n = 13), and serine/glycine-free HFD (-SG HFD, n = 10). (e) Hepatic mRNA expression of enzymes involved in fatty acid and cholesterol synthesis in mice fed with a low fat diet (LFD, n = 8), serine/glycine-free LFD (-SG LFD, n = 11), high fat diet (HFD, n = 13), and serine/glycine-free HFD (-SG HFD, n = 10). Data are mean ± standard error of mean (SEM) and were analyzed using a two-way ANOVA with Fisher’s LSD post hoc test (a–e). * P < 0.05, ** P < 0.01, *** P < 0.001, **** P < 0.0001 vs. LFD. # P < 0.05 vs. HFD group.
Extended Data Fig. 6
Extended Data Fig. 6. Myriocin remodels obesity and sphingolipid metabolism in serine-associated peripheral neuropathy.
(a) Thermal latency quantification in C57BL/6J mice fed with either a control diet (n = 10) or serine/glycine-free how (-Ser/Gly, n = 10) for 12 months. (b) Representative images of intraepidermal nerve fiber (IENF) density and quantification of IENF in paw skin in mice fed with either a control (n = 2) or serine/glycine free diet (n = 3) for 12 months. PGP9.5 staining of IENF is shown by arrows. (c) Body weight time course in mice fed with a low fat diet + vehicle (LFD+Veh, n = 10), LFD + 0.3 mg/kg myriocin (LFD+Myr, n = 10), serine/glycine-free LFD + vehicle (-SG LFD+Veh, n = 10), -SG LFD + myriocin (-SG LFD+Myr, n = 9), high fat diet + vehicle (HFD+Veh, n = 10), HFD + myriocin (HFD+Myr, n = 10), serine/glycine-free HFD + vehicle (-SG HFD+Veh, n = 10), and -SG HFD + myriocin (-SG HFD+Myr, n = 9). (d) Body weight gain 6 months after dietary intervention in mice fed with a low fat diet + vehicle (LFD+Veh, n = 10), LFD + 0.3 mg/kg myriocin (LFD+Myr, n = 10), serine/glycine-free LFD + vehicle (-SG LFD+Veh, n = 10), -SG LFD + myriocin (-SG LFD+Myr, n = 9), high fat diet + vehicle (HFD+Veh, n = 10), HFD + myriocin (HFD+Myr, n = 10), serine/glycine-free HFD + vehicle (-SG HFD+Veh, n = 10), and -SG HFD + myriocin (-SG HFD+Myr, n = 9). (e) Adipose tissue size 6 months after dietary intervention in mice fed with a low fat diet + vehicle (LFD+Veh, n = 9), LFD + 0.3 mg/kg myriocin (LFD+Myr, n = 10), serine/glycine-free LFD + vehicle (-SG LFD+Veh, n = 10), -SG LFD + myriocin (-SG LFD+Myr, n = 9), high fat diet + vehicle (HFD+Veh, n = 10), HFD + myriocin (HFD+Myr, n = 10), serine/glycine-free HFD + vehicle (-SG HFD+Veh, n = 10), and -SG HFD + myriocin (-SG HFD+Myr, n = 9). (f) Plasma amino acid concentration 6 months after dietary intervention in mice fed a with low fat diet + vehicle (LFD+Veh, n = 10), LFD + 0.3 mg/kg myriocin (LFD+Myr, n = 10), serine/glycine-free LFD + vehicle (-SG LFD+Veh, n = 10), -SG LFD + myriocin (-SG LFD+Myr, n = 9), high fat diet + vehicle (HFD+Veh, n = 10), HFD + myriocin (HFD+Myr, n = 10), serine/glycine-free HFD + vehicle (-SG HFD+Veh, n = 10), and -SG HFD + myriocin (-SG HFD+Myr, n = 9). (g) Stack plot of liver ceramides in mice fed with a low fat diet + vehicle (LFD+Veh, n = 10), LFD + 0.3 mg/kg myriocin (LFD+Myr, n = 10), serine/glycine-free LFD + vehicle (-SG LFD+Veh, n = 10), -SG LFD + myriocin (-SG LFD+Myr, n = 9), high fat diet + vehicle (HFD+Veh, n = 10), HFD + myriocin (HFD+Myr, n = 10), serine/glycine-free HFD + vehicle (-SG HFD+Veh, n = 10), and -SG HFD + myriocin (-SG HFD+Myr, n = 9). (h) Stack plot of sciatic nerve ceramides in mice fed with a low fat diet + vehicle (LFD+Veh, n = 10), LFD + 0.3 mg/kg myriocin (LFD+Myr, n = 10), serine/glycine-free LFD + vehicle (-SG LFD+Veh, n = 10), -SG LFD + myriocin (-SG LFD+Myr, n = 9), high fat diet + vehicle (HFD+Veh, n = 10), HFD + myriocin (HFD+Myr, n = 10), serine/glycine-free HFD + vehicle (-SG HFD+Veh, n = 10), and -SG HFD + myriocin (-SG HFD+Myr, n = 9). (i) Stack plot of sciatic nerve deoxydihydroceramide (deoxyDHCer) in mice fed a with low fat diet + vehicle (LFD+Veh, n = 10), LFD + 0.3 mg/kg myriocin (LFD+Myr, n = 10), serine/glycine-free LFD + vehicle (-SG LFD+Veh, n = 10), -SG LFD + myriocin (-SG LFD+Myr, n = 9), high fat diet + vehicle (HFD+Veh, n = 10), HFD + myriocin (HFD+Myr, n = 10), serine/glycine-free HFD + vehicle (-SG HFD+Veh, n = 10), and -SG HFD + myriocin (-SG HFD+Myr, n = 9). Data are mean ± standard error of mean (SEM) and were analyzed using a two-way ANOVA with Fisher’s LSD post hoc test (a and c) and a one-way ANOVA with Fisher’s LSD post hoc test (d–i). Statistical analyses in g-i were performed using summed sphingolipid abundances.
Extended Data Fig. 7
Extended Data Fig. 7. Myriocin improves innervation in the context of serine deficiency and alters the hepatic lipidome.
(a) Representative images of intraepidermal nerve fiber (IENF) density in mice fed a with low fat diet + vehicle (LFD+Veh, n = 10), high fat diet + vehicle (HFD+Veh, n = 7), serine/glycine free HFD + vehicle (-SG HFD+Veh, n = 12), and -SG HFD + myriocin (-SG HFD+Myr, n = 8). (b) Representative images and quantification of corneal nerves in mice fed a with low fat diet + vehicle (LFD+Veh, n = 12), high fat diet + vehicle (HFD+Veh, n = 12), serine/glycine-free HFD + vehicle (-SG HFD+Veh, n = 12), and -SG HFD + myriocin (-SG HFD+Myr, n = 11). (c) Tactile sensing in mice fed with a low fat diet + vehicle (LFD+Veh, n = 12), high fat diet + vehicle (HFD+Veh, n = 12), serine/glycine-free HFD + vehicle (-SG HFD+Veh, n = 12), and -SG HFD + myriocin (-SG HFD+Myr, n = 11). (d) Motor nerve conduction velocity in mice fed with a low fat diet + vehicle (LFD+Veh, n = 12), high fat diet + vehicle (HFD+Veh, n = 12), serine/glycine-free HFD + vehicle (-SG HFD+Veh, n = 12), and -SG HFD + myriocin (-SG HFD+Myr, n = 11). (e) Liver high-resolution lipidomics analysis in the fed state in mice fed with a low fat diet + vehicle (LFD+Veh, n = 12), high fat diet + vehicle (HFD+Veh, n = 12), serine/glycine-free HFD + vehicle (-SG HFD+Veh, n = 12), and -SG HFD + myriocin (-SG HFD+Myr, n = 11). Data are mean ± standard error of mean (SEM) and were analyzed using a one-way ANOVA with Fisher’s LSD post hoc test (b–e).
Extended Data Fig. 8
Extended Data Fig. 8. Myriocin slows the progression of peripheral neuropathy in BKS-db/db mice.
a) Hydrolyzed plasma deoxysphinganine (deoxySA) concentration in 16-week-old WT and BKS-db/db mice (n = 6 per group). b) Hepatic targeted sphingolipid determination 16-week-old WT and BKS-db/db mice (n = 6 per group). c) Thermal latency time-course in BKS-db/db mice treated with either vehicle (n = 10) or myriocin (0.3 mg/kg every other day, n = 9) for 8 weeks. d) Tactile sensing in BKS-db/db mice treated with either vehicle (n=10) or myriocin (n = 9) for 8 weeks. e) Intraepidermal nerve fiber density in BKS-db/db mice treated with either vehicle (n = 10) or myriocin (n = 9) for 8 weeks. f) Body weight time-course in BKS-db/db mice treated with either vehicle (n = 10) or myriocin (n = 9) for 8 weeks. g) Fasting (6-h) blood glucose time-course in BKS-db/db mice treated with either vehicle (n = 10) or myriocin (n = 9) for 8 weeks. h) Fasting (6-h) plasma serine time-course in BKS-db/db mice treated with either vehicle (n = 10) or myriocin (n = 8) for 8 weeks. i) Summed hepatic sphingolipids in BKS-db/db mice treated with either vehicle (n = 10) or myriocin (n = 9) for 8 weeks. j) Summed paw skin sphingolipids in BKS-db/db mice treated with either vehicle (n = 10) or myriocin (n = 9) for 8 weeks. k) Stack plot of liver deoxydihydroceramide (deoxyDHCer) species in BKS-db/db mice treated with either vehicle (n = 10) or myriocin (n = 9) for 8 weeks. l) Stack plot of paw skin deoxydihydroceramide (deoxyDHCer) species in BKS-db/db mice treated with either vehicle (n = 10) or myriocin (n = 9) for 8 weeks. m) Stack plot of liver sphingomyelin (SM) species in BKS-db/db mice treated with either vehicle (n = 10) or myriocin (n = 9) for 8 weeks. n) Stack plot of paw skin sphingomyelin (SM) species in BKS-db/db mice treated with either vehicle (n = 10) or myriocin (n = 9) for 8 weeks. Data are mean ± standard error of mean (SEM) and were analyzed using a two-sided independent t-test (a–b,d–e, i–n) and a two-way ANOVA with Fisher’s LSD post hoc test (c,f–h). Statistical analyses in k-n were performed using summed sphingolipid abundances.
Extended Data Fig. 9
Extended Data Fig. 9. Dietary serine supplementation mitigates 1-deoxysphingolipid in BKS-db/db liver and skin.
a) Body weight time-course in BKS-db/db mice fed with either a control (n = 8) or serine supplemented diet (n = 9) for 8 weeks. b) Fasting (6-h) blood glucose time-course in BKS-db/db fed with either a control (n = 8) or serine supplemented diet (n = 9) for 8 weeks. c) Summed hepatic sphingolipids in BKS-db/db mice fed with either a control or serine supplemented diet for 8 weeks (n = 8 per group). d) Summed paw skin sphingolipids in BKS-db/db mice fed with either a control or serine supplemented diet for 8 weeks (n = 8 per group). e) Levels of sphingomyelin species (SM) in the liver in BKS-db/db mice fed with either a control or serine supplemented diet for 8 weeks (n = 8 per group). f) Levels of sphingomyelin species (SM) in the paw skin in BKS-db/db mice fed with either a control or serine supplemented diet for 8 weeks (n = 8 per group). Data are mean ± standard error of mean (SEM) and were analyzed with a two-way ANOVA with Fisher’s LSD post hoc test (a–b) and a two-sided independent t-test (c–f). Statistical analyses in e-f were performed using summed abundances.

Comment in

References

    1. Feldman EL, et al. Diabetic neuropathy. Nat. Rev. Dis. Primers. 2019;5:41. doi: 10.1038/s41572-019-0092-1. - DOI - PubMed
    1. Forbes JM, Cooper ME. Mechanisms of diabetic complications. Physiol. Rev. 2013;93:137–188. doi: 10.1152/physrev.00045.2011. - DOI - PubMed
    1. Newgard CB. Interplay between lipids and branched-chain amino acids in development of insulin resistance. Cell Metab. 2012;15:606–614. doi: 10.1016/j.cmet.2012.01.024. - DOI - PMC - PubMed
    1. Yang Q, Vijayakumar A, Kahn BB. Metabolites as regulators of insulin sensitivity and metabolism. Nat. Rev. Mol. Cell Biol. 2018;19:654–672. doi: 10.1038/s41580-018-0044-8. - DOI - PMC - PubMed
    1. Spiegelman BM, Flier JS. Obesity and the regulation of energy balance. Cell. 2001;104:531–543. doi: 10.1016/S0092-8674(01)00240-9. - DOI - PubMed

Publication types