. 2023 Feb;614(7948):572-579.
doi: 10.1038/s41586-022-05652-7. Epub 2023 Jan 25.

Structure of the lysosomal mTORC1-TFEB-Rag-Ragulator megacomplex

Affiliations

Structure of the lysosomal mTORC1-TFEB-Rag-Ragulator megacomplex

Zhicheng Cui et al. Nature. 2023 Feb.

Abstract

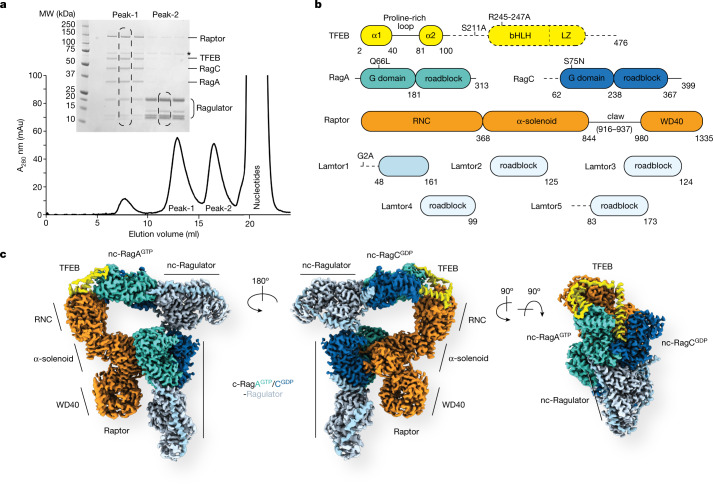
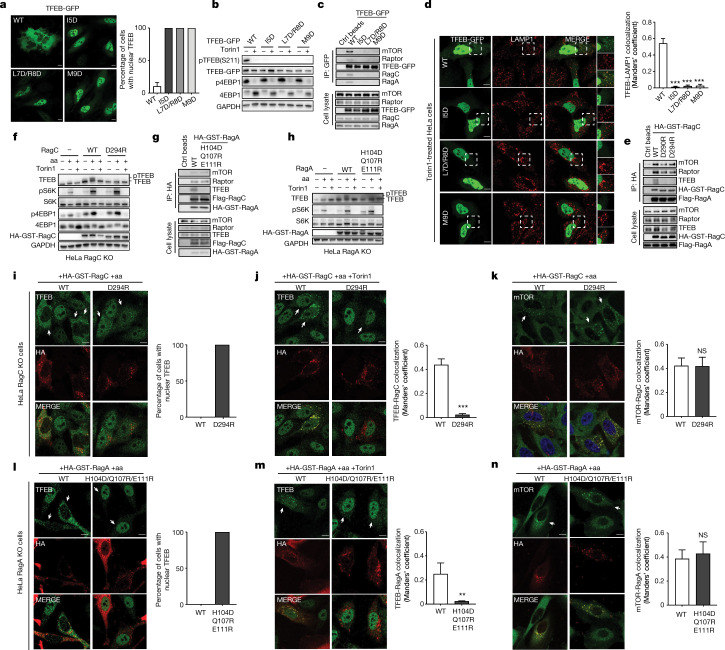
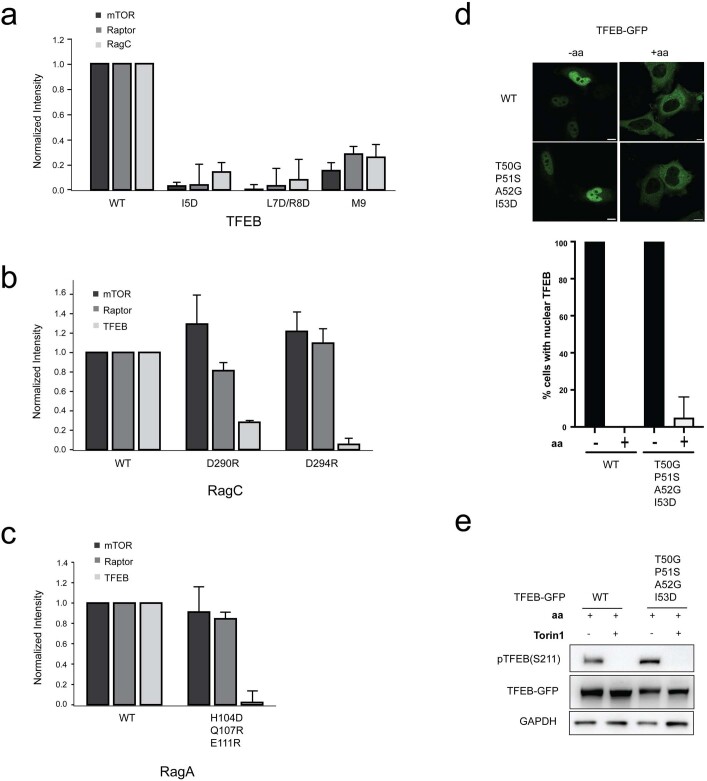
The transcription factor TFEB is a master regulator of lysosomal biogenesis and autophagy1. The phosphorylation of TFEB by the mechanistic target of rapamycin complex 1 (mTORC1)2-5 is unique in its mTORC1 substrate recruitment mechanism, which is strictly dependent on the amino acid-mediated activation of the RagC GTPase activating protein FLCN6,7. TFEB lacks the TOR signalling motif responsible for the recruitment of other mTORC1 substrates. We used cryogenic-electron microscopy to determine the structure of TFEB as presented to mTORC1 for phosphorylation, which we refer to as the 'megacomplex'. Two full Rag-Ragulator complexes present each molecule of TFEB to the mTOR active site. One Rag-Ragulator complex is bound to Raptor in the canonical mode seen previously in the absence of TFEB. A second Rag-Ragulator complex (non-canonical) docks onto the first through a RagC GDP-dependent contact with the second Ragulator complex. The non-canonical Rag dimer binds the first helix of TFEB with a RagCGDP-dependent aspartate clamp in the cleft between the Rag G domains. In cellulo mutation of the clamp drives TFEB constitutively into the nucleus while having no effect on mTORC1 localization. The remainder of the 108-amino acid TFEB docking domain winds around Raptor and then back to RagA. The double use of RagC GDP contacts in both Rag dimers explains the strong dependence of TFEB phosphorylation on FLCN and the RagC GDP state.


Conflict of interest statement

J.H.H. is a cofounder and shareholder of Casma Therapeutics and receives research funding from Casma Therapeutics, Genentech and Hoffmann-La Roche. A.B. is a cofounder and shareholder of Casma Therapeutics and advisory board member of Next Generation Diagnostics, Avilar Therapeutics and Coave. The other authors declare no competing interests.

Figures

Fig. 1
Fig. 1. Reconstitution and structure of the Raptor–TFEB–Rag–Ragulator complex.
a, Size-exclusion chromatography and SDS–PAGE of assembled Raptor–TFEB–Rag–Ragulator complex. Peak-1 corresponds to the fully assembled complex, and peak-2 represents Ragulator alone. All the corresponding bands are labelled, the asterisk indicates HSP70 contamination. MW, molecular weight; A280, absorbance at 280 nm. b, Domain arrangement of all the subunits in the complex. Unresolved domains are indicated by dashed lines. c, A composite cryo-EM density map of the complex, assembled from three focused-refinement maps (Raptor, c-RagAGTP/RagCGDP–Ragulator and TFEB-nc–RagAGTP/RagCGDP–Ragulator). Different contour levels were used for optimal visualization using UCSF ChimeraX. c, canonical; nc, non-canonical.
Fig. 2
Fig. 2. TFEB interacts with both nc-Rag GTPases and Raptor.
a, Overall interaction between TFEB and nc-Rag GTPases is shown as ribbon models from the front view. nc-Ragulator is shown as transparent surfaces. Disordered switches I and II of nc-RagCGDP are shown with dashed lines. b, Interactions between TFEB and inter-Rag G domains at the dimer interface. c, Close-up view of the interaction between TFEB N terminus and α8 of RagCGDP. Hydrogen bonds and salt bridges are labelled and indicated with black and grey dashed lines, respectively. d, Close-up view of the interaction between TFEB and outer-G domain of RagAGTP as outlined in a. e, Ribbon model showing the interactions among TFEB, Raptor and nc-RagAGTP. TFEB bridges the interaction between Raptor and nc-RagAGTP through its Pro-rich loop and α2 region. f, 90°-rotated view of e shows the interaction between the Pro-rich loop of TFEB and RNC domain. g, Close-up view of the interaction between RNC domain and nc-RagAGTP. Ordered switch I of nc-RagAGTP facilitates its interaction with the RNC domain. h, Close-up view as outlined in f shows the residues responsible for the interaction between 50TPAI53 of TFEB and RNC domain. Raptor residues that interact with the RAIP motif of 4E-BP1 are highlighted with boxes.
Fig. 3
Fig. 3. Function of the TFEB-nc-Rag GTPases interface.
a, Cells expressing wild-type (WT) or mutant TFEB-GFP were analysed using immunofluorescence to determine the percentage of cells showing nuclear TFEB, shown as mean ± s.e. throughout; n = 12 independent fields per condition. b, Immunoblot of HeLa cells expressing wild-type or mutant TFEB-GFP. c, Representative co-immunoprecipitation of Flp-In 293 T-REx cells transfected with wild-type or mutant TFEB-GFP. d, Microscopy analysis of Torin1-treated HeLa cells, n ≥ 5 independent fields per condition. ***P ≤ 0.0001 throughout. One-way analysis of variance (ANOVA), Dunnett’s multiple comparisons test. e, Representative co-immunoprecipitation of HeLa RagC KO cells transfected with the indicated constructs. f, Immunoblot of RagC KO HeLa cells transfected with empty vector or wild-type RagC or RagC(D294R). Cells were amino acid starved and refed in the presence or absence of 250 nM Torin1. g, Representative co-immunoprecipitation of HeLa RagA KO cells transfected with the indicated constructs. h, Immunoblot of RagA KO HeLa cells transfected with empty vector or wild-type RagA or RagA(H104D/Q107R/E111R). ik, Cells as in f were analysed using immunofluorescence and the percentage of the cells were determined to show nuclear TFEB (i) (n = 5 fields per condition); TFEB–RagC colocalization (j) (n ≥ 5 fields per condition, ***P ≤ 0.0001, unpaired t-test) and mTOR–RagC colocalization (k) (n ≥ 12 fields per condition, unpaired t-test). ln, Cells as in h were analysed using immunofluorescence and quantified to calculate the percentage of the cells showing nuclear TFEB (l) (n ≥ 4 independent fields per condition), TFEB–RagA colocalization (m) (n ≥ 4 fields per condition, **P ≤ 0.002, unpaired t-test) and mTOR–RagA colocalization (n) (n = 5 independent fields per condition, unpaired t-test). Scale bar, 10 μm. NS, not significant; aa, amino acid; Ctrl, control; HA, haemagglutinin; IP, immunoprecipitation; GST, glutathione S-transferase.
Fig. 4
Fig. 4. Function of the nc-Ragulator and c-RagCGDP interface.
a, Cartoon representation that highlights the interacting subunits at the end with nc-Ragulator. b, Close-up view as outlined in a shows the residues responsible for the interaction between nc-Lamtor1 and c-RagCGDP. c, Representative immunoblot of RagC KO HeLa cells transfected with empty vector or wild-type RagC or RagC mutants (Y150, Y150/R198D or Y150/M151/R198D). Cells were amino acid starved and refed in the presence or absence of 250 nM Torin1. Quantifications are shown with mean ± s.e. throughout; n = 2 experiments. d, Representative co-immunoprecipitation of HeLa RagC KO cells transfected with the indicated constructs; n = 3 experiments. eg, Cells as in c were analysed using immunofluorescence and quantified to calculate the percentage of the cells showing nuclear TFEB (e) (n = 5 independent fields per condition); TFEB–RagC colocalization (f) (n ≥ 5 independent fields per condition, ***P ≤ 0.0001, one-way ANOVA, Dunnett’s multiple comparisons test) and mTOR–RagC colocalization (g) (n ≥ 8 independent fields per condition; NS, not significant; one-way ANOVA, Dunnett’s multiple comparisons test). Scale bar, 10 μm.
Fig. 5
Fig. 5. Structure of the mTORC1–TFEB–Rag–Ragulator megacomplex.
a, Composite cryo-EM density map of the dimeric mTORC1–TFEB–Rag–Ragulator megacomplex shown from top and side views. The active sites of mTOR are labelled with dashed arrows. The twofold axis is labelled as an oval symbol in the top view and a dash line in the side view. Different contour levels were used for optimal visualization using UCSF ChimeraX. b, Atomic model of the dimeric megacomplex shown in the same orientation as in a. c, The ribbon model of an asymmetric unit. The domain organization of mTOR is shown. d, Focused view of the active site of mTOR, the HEAT and FAT domains are omitted for clarity. The ATP binding site is outlined with a dashed line. The distance between Pro66 of TFEB and Lys2166 of mTOR is drawn with a double-headed arrow. The distance between Ile108 of TFEB and the active site of mTOR is calculated on the basis of the distance between Ile108 of TFEB and Asp2338 of mTOR. The inset highlights the distance between TFEB and the hinge loop (residues 2115–2118) at the end of mTOR FRB domain. Distances are calculated on the basis of the Cα atoms.
Extended Data Fig. 1
Extended Data Fig. 1. Purification, reconstitution, and cryo-EM structure determination of the TFEB-Rag-Ragulator complex.
a, Gel filtration chromatography of the TFEB-Rag and TFEB-Rag-Ragulator complexes, using a Superose 6 10/300 GL (GE Healthcare) column. Corresponding peaks are labelled and analyzed by Coomassie blue staining SDS-PAGE in b and c for TFEB-Rag and TFEB-Rag-Ragulator complexes, respectively. d-f, cryo-EM structure determination of TFEB-Rag-Ragulator complex. d, Resolution estimation based on the gold standard FSC. e, Orientation distribution of the reconstructed cryo-EM map. f, Side-by-side view of the cryo-EM density map and atomic model of the TFEB-Rag-Ragulator complex. Cryo-EM density for TFEB is not resolved. Asterisks in (b) and (c) indicate HSP70 contamination. g, Masked 3D classification of TFEB-Rag-Ragulator without alignment using the reconstruction in f. The TFEB mask is shown in grey density. The classification results are shown in blue. Rag-Ragulator is shown in light gray and shown as reference to identify TFEB. Only the least populated class (0.15%) shows density in the TFEB binding site.
Extended Data Fig. 2
Extended Data Fig. 2. Cryo-EM workflow of the Raptor–TFEB-Rag-Ragulator complex.
a, Cryo-EM data processing diagram of the Raptor–TFEB-Rag-Ragulator complex. b, A representative micrograph of the dataset after motion correction. c, Selected 2D class average images showing different orientations of the complex. d, Resolution plots of the cryo-EM reconstructions with different masks. Orientation distribution of reconstructed cryo-EM maps with Raptor, c-Rag-Ragulator, and nc-Rag-Ragulator masks are shown in e, f, and g, respectively. Scale bars in b and c represent 20 nm.
Extended Data Fig. 3
Extended Data Fig. 3. Representative cryo-EM density of the Raptor-TFEB-Rag-Ragulator complex.
a, Cryo-EM density of TFEB (2–105) at contour level 6 (left) and level 4 (right). b, Cryo-EM density of the nucleotides at contour level 8.9.
Extended Data Fig. 4
Extended Data Fig. 4. Interaction surface aera estimation of the Raptor-TFEB-Rag-Ragulator complex and structural comparison between nc-Rag-Ragulator and c-Rag-Ragulator.
a, A cartoon representation of the complex, labelled with red circles indicating different interaction surface. b, A table showing the interaction surface aera labelled in a, estimated by PISA. c, Structures are superimposed based on RagC. The TFEB-nc-Rag-Ragulator are colored as in Fig. 1. The c-Rag-Ragulator is colored in gray.
Extended Data Fig. 5
Extended Data Fig. 5. Assembly of Raptor-TFEB1–109-Rag-Ragulator complex.
a, SDS-PAGE analysis of the purified TFEB1–109-Rag complex before TEV cleavage and gel filtration. b, Gel filtration chromatography of the Raptor-Rag-Ragulator and Raptor-TFEB1–109-Rag-Ragulator complexes, using a Superose 6 10/300 GL (GE Healthcare) column. The peaks corresponding to the largest complex are analyzed by SDS-PAGE and stained by Coomassie blue.
Extended Data Fig. 6
Extended Data Fig. 6. Structural comparison between the active nc-Rag GTPases (RagAGTP-RagCGDP) and RagC in GTP-bound states, and between the nc-RagAGTP and RagA in GDP-bound states at the unique TFEB contact site.
a, Structures are superimposed based on the α8 of RagC. Structures of RagC in GTP-bound states are colored as gray, while the switch I regions are colored as pink. Residues 41–105 of TFEB are omitted. b, Structures are superimposed based on the α4 of RagA. Structures of RagA at GDP-bound states are colored in gray. The TFEB and nc-Rag GTPases are colored as in Fig. 1.
Extended Data Fig. 7
Extended Data Fig. 7. Quantification of the co-immunoprecipitation of mutants in the TFEB-nc-Rag GTPases interface and in cellulo assessment of the TFEB 50TPAI53 mutation.
a-c, Quantifications of TFEB mutants in Fig. 3c, RagC mutants in Fig. 3e, and RagA mutants in Fig. 3g are calculated with mean ± s.e.m.; n = 3 experiments. d, Representative immunofluorescence analysis of cells expressing GFP tagged wild type or 50TPAI53 mutant TFEB, in the presence and absence of amino acids. Quantification on the right shows the percentage of cells with TFEB nuclear localization. Results are mean ± s.e.; n = 5 independent fields per condition. Scale bar, 10 µm. e, TFEB phosphorylation was analyzed by immunoblotting for wild type and 50TPAI53 mutant, in the presence and absence of Torin1.
Extended Data Fig. 8
Extended Data Fig. 8. Cryo-EM workflow of the mTORC1-TFEB-Rag-Ragulator megacomplex.
a, Cryo-EM data processing diagram of the mTORC1-TFEB-Rag-Ragulator megacomplex. b, A representative micrograph of the dataset after motion correction. c, SDS-PAGE of the reconstituted megacomplex stained by Coomassie blue. Asterisk indicates HSP70 contamination. d, Selected 2D class average images showing different orientations of the complex. e, Resolution plots of the asymmetric unit of mTORC1-TFEB-Rag-Ragulator megacomplex after symmetry expansion. f, Orientation distribution of local refinement after symmetry expansion of the mTORC1-TFEB-Rag-Ragulator complex. Scale bars in b and d represent 20 nm.
Extended Data Fig. 9
Extended Data Fig. 9. Cryo-EM map of the active site of mTOR and overlapping between TFEB, S6K and PRAS40.
a, Cryo-EM map in the active site of mTOR is shown as transparent surface. The density is zoned within 3Å of the model. b, The cryo-EM density outside the zone range is shown as solid surface colored in gray. c-d, Superimposed structure of S6K (PDB: 5WBH) and PRAS40 (PDB: 5WBU) with mTORC1-TFEB-Rag-Ragulator based on the FRB domain of mTOR.
Extended Data Fig. 10
Extended Data Fig. 10. Proposed membrane tethering of the mTORC1-TFEB-Rag-Ragulator megacomplex.
The Red dots represent the position of residue 47 of Lamtor 1 subunit. The dashed curved lines indicate the disordered 46 residues of Lamtor1. The long linker of Lamtor 1 at N-terminus could also permit the complex facing toward the lysosomal membrane in an opposite orientation as shown above.

Comment in

References

    1. Sardiello M, et al. A gene network regulating lysosomal biogenesis and function. Science. 2009;325:473–477. doi: 10.1126/science.1174447. - DOI - PubMed
    1. Settembre C, et al. A lysosome-to-nucleus signalling mechanism senses and regulates the lysosome via mTOR and TFEB. EMBO J. 2012;31:1095–1108. doi: 10.1038/emboj.2012.32. - DOI - PMC - PubMed
    1. Roczniak-Ferguson A, et al. The transcription factor TFEB links mTORC1 signaling to transcriptional control of lysosome homeostasis. Sci. Signal. 2012;5:ra42. doi: 10.1126/scisignal.2002790. - DOI - PMC - PubMed
    1. Martina JA, Chen Y, Gucek M, Puertollano R. MTORC1 functions as a transcriptional regulator of autophagy by preventing nuclear transport of TFEB. Autophagy. 2012;8:903–914. doi: 10.4161/auto.19653. - DOI - PMC - PubMed
    1. Vega-Rubin-de-Celis S, Pena-Llopis S, Konda M, Brugarolas J. Multistep regulation of TFEB by MTORC1. Autophagy. 2017;13:464–472. doi: 10.1080/15548627.2016.1271514. - DOI - PMC - PubMed

Publication types

MeSH terms

Substances