. 2023 Feb;614(7946):160-167.
doi: 10.1038/s41586-022-05638-5. Epub 2023 Jan 25.

Visualization of translation and protein biogenesis at the ER membrane

Affiliations

Visualization of translation and protein biogenesis at the ER membrane

Max Gemmer et al. Nature. 2023 Feb.

Abstract

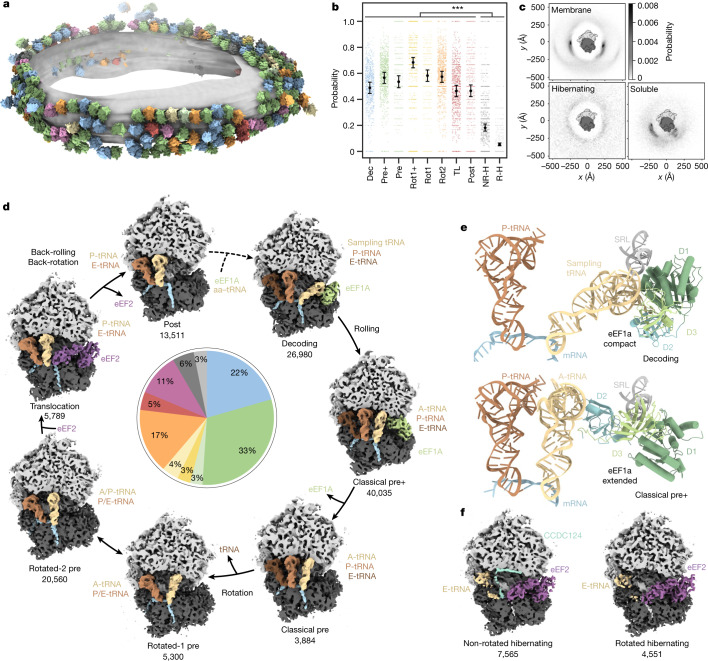
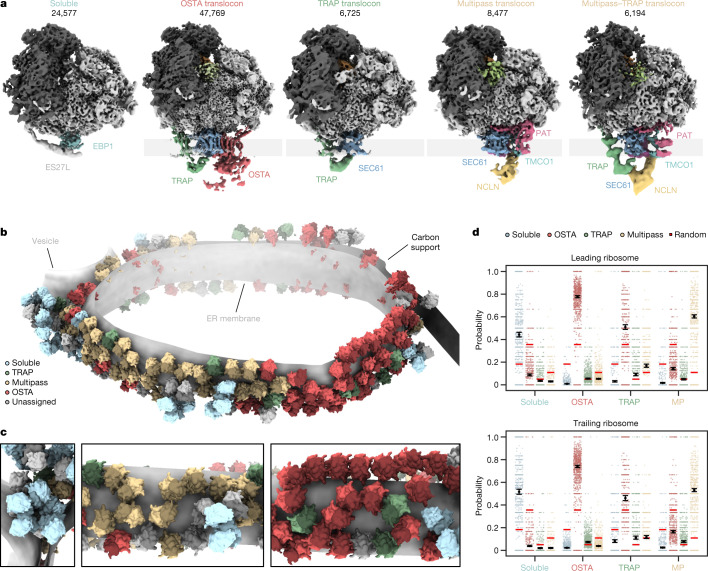
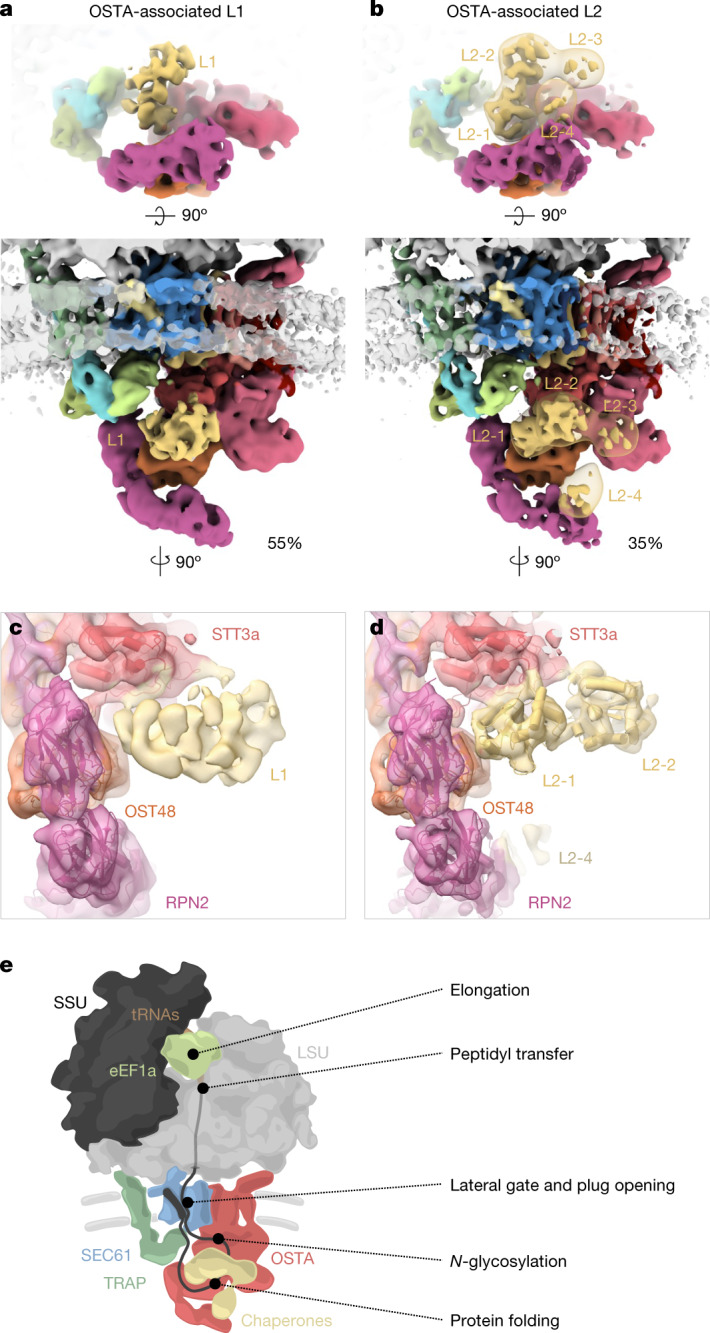
The dynamic ribosome-translocon complex, which resides at the endoplasmic reticulum (ER) membrane, produces a major fraction of the human proteome1,2. It governs the synthesis, translocation, membrane insertion, N-glycosylation, folding and disulfide-bond formation of nascent proteins. Although individual components of this machinery have been studied at high resolution in isolation3-7, insights into their interplay in the native membrane remain limited. Here we use cryo-electron tomography, extensive classification and molecular modelling to capture snapshots of mRNA translation and protein maturation at the ER membrane at molecular resolution. We identify a highly abundant classical pre-translocation intermediate with eukaryotic elongation factor 1a (eEF1a) in an extended conformation, suggesting that eEF1a may remain associated with the ribosome after GTP hydrolysis during proofreading. At the ER membrane, distinct polysomes bind to different ER translocons specialized in the synthesis of proteins with signal peptides or multipass transmembrane proteins with the translocon-associated protein complex (TRAP) present in both. The near-complete atomic model of the most abundant ER translocon variant comprising the protein-conducting channel SEC61, TRAP and the oligosaccharyltransferase complex A (OSTA) reveals specific interactions of TRAP with other translocon components. We observe stoichiometric and sub-stoichiometric cofactors associated with OSTA, which are likely to include protein isomerases. In sum, we visualize ER-bound polysomes with their coordinated downstream machinery.


Conflict of interest statement

A.K. and F.A.K. are employees of Thermo Fisher Scientific. The other authors declare no competing interests.

Figures

Fig. 1
Fig. 1. Captured human ribosomal states and spatial distribution.
a, Different ribosome states mapped back onto one exemplary ER-derived vesicle (n = 869 tomograms from one experiment, two independent replicates; Extended Data Fig. 4). b, Probabilities of ribosome states being present in polysomes. Black circles show the modelled mean and error bars represent the 95% confidence interval (CI) (n = 132,371 ribosomes with the 869 tomograms included as a random effect). Hochberg-adjusted P values were determined using a two-sided Wald-test. P values for comparison between hibernating and elongating states were all smaller than 2 × 10−16. The small scattered points represent the frequencies of events per tomogram. TL, translocation; NR-H, non-rotated hibernating; R-H, rotated hibernating. c, Neighbour distribution of ER membrane-bound, hibernating and soluble ribosome particles. The membrane resides in the plane of the image. d, Observed active intermediates positioned in a model of the human elongation cycle. All reconstructions were filtered to 7 Å resolution. The ribosome is clipped for visualization. The tRNAs are colour-coded with respect to a complete cycle. The abundance of each state is indicated in the pie chart, colour-coded as in a. e, Close-up views of ribosome-bound compact eEF1a in the decoding-sampling state (PDB: 4CXG) and in the classical pre+ state (4C0S). D1 to D3 indicate the extended eEF1a domains 1 to 3. f, Reconstructions of two distinct ribosome states lacking tRNA at the P-site (hibernating states).
Fig. 2
Fig. 2. Organization of soluble and ER membrane-associated ribosome populations.
a, Locally filtered reconstructions of different soluble and ER membrane-associated ribosome populations resulting from 3D classification focused near the exit tunnel. b, Segmented representation of one tomogram of an ER-derived vesicle (n = 869 tomograms from 1 experiment). Populations from a are mapped back into the reconstruction and coloured accordingly. c, Close-up views of the segmentation from b. d, The probability of encountering ER-associated ribosomes from a as leading or trailing neighbour. Black circles show the modelled mean and error bars represent the 95% CI (n = 45,751 ribosomes with the 869 tomograms included as a random effect). The small, scattered points represent the frequencies of events per tomogram. The random association probability (bright red lines) is the overall abundance of the ribosome populations. MP, multipass.
Fig. 3
Fig. 3. Atomic model of the most abundant ER translocon.
a, Top view (top) and side view (bottom) of the translocon-centred reconstruction of SEC61–TRAP–OSTA. b, Atomic model of the ER translocon built from cryo-EM structures (PDB: 3JC2 and 6S7O) and AlphaFold predictions. cf, Close-up views showing the molecular model placed into the segmented density maps. c, The plug helix of SEC61α contacts the SEC61γ C terminus and the luminal OSTC β-hairpin. SEC61α transmembrane helix 4 (TMH4) and SEC61β were removed for clarity. d, The cytosolic TRAPγ domain associates with rRNA expansion segments ES20L and ES26L and the ribosomal protein L35. e, The TRAPγ C terminus contacts the N terminus of SEC61γ. Ct, C terminus; Nt, N terminus. f, The luminal TRAPα domain interacts with a β-hairpin of the SEC61α hinge region and the TRAPα transmembrane helix contacts the second helix of the hinge region. SEC61α TM7 to TM10 were removed for clarity.
Fig. 4
Fig. 4. Co-translational ER biogenesis factors and summary.
a,b, Top view (top) and front view (bottom) of the accessory factors L1 (a) and L2 (b) associated with the SEC61–TRAP–OSTA translocon. The transparent map represents L2 filtered to a resolution of 20 Å. c,d, Close-up view of the interaction site between STT3a and L1 (c) or L2 (d). Domains a and b of the L2 candidate protein PDIR were placed into domain L2-1 and L2-2, respectively. e, Model of the main protein translation and translocation machinery at the ER membrane.
Extended Data Fig. 1
Extended Data Fig. 1. Cryo-ET data analysis workflow.
Template matching in PyTom generates candidates for ribosomal particles, which are further analyzed in RELION and M. Initial coarse 3D classification allowed removal of false positives, poorly aligned particles, and isolated LSUs. (A) The remaining ~135,000 80S ribosome subtomograms were subjected to focused classification on the area at the ribosomal tunnel exit (mask 1). Repeated classification is required to distinguish subtle differences of Sec61-multipass-, Sec61-multipass-TRAP translocon, and Sec61-TRAP. (B) The center of the reconstruction of the ribosome-Sec61-TRAP-OSTA population was shifted to the center of the translocon. After refinement, recentered subtomograms were subjected to 3D classification focused on a luminal mask near OSTA (mask 4). (C) To obtain the best statistics for analysis of ribosomal processing states all subtomograms were pooled again. The particles were hierarchically classified, first according to the rotation state of the SSU (mask 2) and then further focused using masks including the tRNA and eEF binding sites (mask 3). A minor population of <2k particles could not be assigned unambiguously to a translation state (ND = not defined). (D) Previously annotated particles from classification focused on the translocon (A) were extracted from classes obtained by classification of ribosomal intermediate states (C).
Extended Data Fig. 2
Extended Data Fig. 2. Identification of ribosomal intermediate states.
Large ribosomal subunits of models or maps of previously characterized intermediate states were fitted into our reconstructions from Fig. 1A, of which we only show the tRNAs and elongation factors for clarity. Structures of mRNAs, tRNAs, elongation factors and the small ribosomal subunit from the models indicated by their PDB or EMDB codes are superposed onto the respective segmented densities from our reconstructions.
Extended Data Fig. 3
Extended Data Fig. 3. Neighborhood analysis of ER membrane-bound and soluble ribosomes and their intermediate states.
(A) Side view (top panels) and top view (bottom panels) of filtered reconstructions of ER-membrane bound, soluble and hibernating ribosome populations depicted at low contour level. Densities of leading and trailing ribosome neighbors are visible adjacent to the centered ribosome. (B) Neighborhood analysis illustrates the arrangement of ribosomes and is consistent with the subtomogram averages from (A). Neighborhood analysis was performed in 3D, whereas 2D heat maps show the results projected onto a plane parallel to the membrane. (C) Masks were generated in 3D from results of the neighborhood analysis of membrane-bound and soluble populations combined. (D) Columns represent the modelled mean neighbor probability with 95% confidence interval as error bars analysis based on the neighborhood analysis from (B,C) for each ribosomal intermediate state. Statistics determined from n = 132,371 ribosomes with the 869 tomograms included as a random effect. The random association probability (gray hatched bars) is the overall abundance of the ribosome populations. (E) Columns represent the mean logarithmic fold increase of observed vs. random probability with 95% confidence interval as error bars of the data from (D).
Extended Data Fig. 4
Extended Data Fig. 4. Ribosome states in situ and comparison to ex vivo abundances.
(A) Central slice (thickness 1.7 nm) of representative tomograms of cryo-FIB milled HEK293, U2OS and HeLa cells. Scale bar: 100 nm. (B) Segmented representation of tomograms from (A). Subtomogram averages of the ribosome were mapped back into the reconstruction and color-coded according to their ribosomal state. (C) Ribosomal states obtained by 3D classification of in situ data. (D) Neighborhood analysis of the intermediate states from (C). (E) Distribution of ribosomal states from soluble or membrane-bound ribosomes. Statistics determined from n = 132,371 ribosomes with 869 tomograms modeled as random effect. Stacked columns show the modelled mean with the 95% confidence interval as error bars. (F) Distribution of ribosomal states from 3 separate ER vesicles preparations (ex vivo - ER #1-3), in situ data, and cytosolic polysomes from Behrmann et al. n(ER #1) = 132,731 particles in 869 tomograms, n(ER #2) = 6,101 particles in 31 tomograms, n(ER #3) = 3,836 particles in 58 tomograms, each from 1 experiment, n(in situ) = 5,351 (HEK293 = 2,965, U2OS = 374, HeLa = 2,012) particles in 27 tomograms from 3 independent experiments.
Extended Data Fig. 5
Extended Data Fig. 5. Identification of elongation factor-bound ribosomal intermediate states.
(A) Superposition of the decoding-sampling (4CXG+4UJE), decoding-recognition (5LZS) and post-decoding (EMDB-2908) state (dark grey cartoon representations) onto our reconstruction (semi-transparent colored maps) of the ribosome-bound eEF1a-tRNA ternary complex. Arrows indicate structural differences. (B) Close-up of the decoding center of the decoding-recognition state (5LZS) superposed onto our segmented reconstructions (semi-transparent maps) of our decoding state (left) or the subsequent classical pre state (right) for comparison. Densities of the nucleobases A1824 and A1825 are clearly visible in the flipped-out conformation in the classical pre state (right) but flipped-in in the decoding state (left), indicating that tRNA recognition has not yet occurred. tRNA, mRNA, and 18S rRNA segment h44 were segmented and tRNAs were clipped for better overview. (C) Comparison of eEF1a and structurally related candidates fitted into the segmented density of the classical pre+ state. Arrowheads indicate structural differences. (D) Structure of eEF1A in extended conformation (4C0S) fitted into the segmented density of the classical pre+ state. Domain 1, 2 and 3 (D1-3) were fitted individually.
Extended Data Fig. 6
Extended Data Fig. 6. Single particle analysis of the ribosome in the classical pre+ state.
(A) Comparison of cryo-ET and SPA reconstructions of the ribosome in the classical pre+ state filtered to local resolution. Ribosomes were clipped in top views (bottom panels). (B) SPA reconstruction color-coded according to local resolution. (C) Close-up view of eEF1a color-coded according to local resolution explained in the color bar. (D) Refined atomic model of eEF1a placed into the SPA density map. Domains 1-3 (D1-3) are indicated. (E) Segments of eEF1a superposed on density maps with well-resolved side chains. (F) Refined model of eEF1a fitted into the locally refined reconstruction of domain 3. The SRL is not depicted for clarity. (G) Candidate GTPases fitted into the high-resolution density. The SRL binding site of domain 3 is displayed. (H) Interaction site of eEF1a with the SRL of the LSU. (H) Same view as in (H) with the density map.
Extended Data Fig. 7
Extended Data Fig. 7. Neighbor probability analysis of soluble and ER translocon populations.
(A) Central slices from representative filtered tomograms of ER-derived vesicles. ER (endoplasmic reticulum), V (vesicle), C (carbon support). (B) Segmented representation of tomograms from (A), including the ER membrane (grey), carbon support (black) and subtomogram averages of different ribosome populations mapped back into the tomogram. Ribosomes are color-coded according to their binding partners at the exit tunnel: soluble (blue), OSTA-translocon (red), TRAP-translocon (green), multipass-translocon (yellow), unassigned (grey); large ribosomal subunit (LSU, lighter shade), small ribosomal subunit (SSU, darker shade). (C) Probability of encountering soluble or ER-associated ribosomes from as leading or trailing neighbor. The black circles show the modelled mean with the 95% confidence interval as error bars fitted to n = 134,350 ribosomes with the 869 tomograms included as a random effect. The small scattered points represents the frequencies of events per tomogram. The random association probability (bright red lines) is the overall abundance of the ribosome populations corrected for unoccupied positions. Neighbors are defined as ‘unoccupied’ if there is no particle in the defined neighborhood mask or its potential neighbor (e.g., a particle must have a trailing neighbor, which has this particle as a leading neighbor). (D) Columns represent the mean fold increase of observed vs random probability with 95% confidence interval as error bars of the data from (C).
Extended Data Fig. 8
Extended Data Fig. 8. Reconstruction of the Sec61-TRAP-OSTA-translocon.
(A) Ribosome- and translocon-centered reconstruction of the ribosome-Sec61-TRAP-OSTA-translocon color-coded by local resolution (color bar in Å). Centers of the respective reconstructions are indicated. (B) FSC curves of the ribosome- and translocon-centered reconstructions of the ribosome-Sec61-TRAP-OSTA-translocon. (C) Examples of 60S ribosomal proteins and 28S rRNA fitted into the ribosome-centered reconstruction filtered to local resolution of up to 3.5-Å. (D) Cryo-EM structures of Sec61 (3JC2) fitted into the translocon-centered reconstruction. (E) Density of the nascent chain (NC, light-yellow) is visible at the ribosomal tunnel exit, the Sec61 pore and in the lateral gate as signal peptide (SP, light-yellow). The front side of the ribosome and membrane were clipped for visualization purposes. (F) Close-up of the Sec61 plug placed into the density of the translocon-centered reconstruction. (G) Superposition of the plug in the closed (cyan, 3J7Q) and open (blue) conformation.
Extended Data Fig. 9
Extended Data Fig. 9. Model building of the TRAP complex.
(A) Prediction model of TRAP (P43307, P43308, Q9UNL2, P51571) obtained by Colabfold (v1.4) using MMseqs2 and Alphafold2-multimer (v2) color-coded according to predicted local distance difference test (pLDDT) score. Signal peptides were removed prior to prediction. (B) Sequence coverage obtained by sequence alignments generated by MMseqs2. (C) pLDDT scores per position of five model predictions. (D) Predicted aligned error (PAE) of five model predictions. (E) Prediction models of TRAPαβδ placed into the density of the locally filtered translocon-centered reconstruction. (F) Alphafold models of TRAPβγδ placed into the segmented density of the locally filtered ribosome-centered reconstruction. (G) Additional densities which are not explained by the prediction models reside near disordered terminal regions (white arrowhead) or glycosylation sites of TRAPαβ indicating partially ordered glycans (black arrowheads). Asparagine residues are displayed as ball/stick models and annotated according to residue number. (H) Sequence conservation score plotted onto the surface of TRAP subunits (blue: high conservation, orange: low conservation). Evolutionary conserved residues reside primarily at the interface areas, whereas peripheral residues are variable. The luminal TRAPα, TRAPβ, and TRAPδ domains possess large interaction interfaces (TRAPα-TRAPβ: 695 Å2, TRAPβ-TRAPδ: 985 Å2). (I) Top, back and side view of the reconstruction of the Sec61-TRAP-OSTA-translocon (top panels). Semi-transparent densities originate from residual membrane signal. Models generated from the density map at the same view (bottom panels).
Extended Data Fig. 10
Extended Data Fig. 10. Native OSTA and its accessory factors.
(A) View from cytosol (top) and side view (bottom) of the OSTA complex (PDB 6S7O, AlphaFold P04844) fitted into the segmented map of the translocon-centered reconstruction of the OSTA-translocon. (B) AlphaFold model of RPN2 (P04844). The model is color-coded according to confidence score as indicated. (C) Close-up view of the N-terminal domain (NTD) of the RPN2 prediction model fitted into the reconstruction as in (A). (D) Side view of the OSTA-translocon opposite to the lateral gate. (E,F) Close-up side view (E) and top view from the cytosol (F) of T1 intercalated between TMHs of STT3a and TRAPα. (G,H) Membrane-resident translocon components (same view as in (F)) of the ribosome-centered reconstructions of the Sec61-TRAP-OSTA-translocon (G) and the Sec61-TRAP-translocon (H) filtered to a resolution of 15 Å. (I–K) Reconstructions of the OSTA-translocon without (I) or with accessory factor L1 (J) or L2 (K) color-coded according to local resolution as indicated. (L) FSC curves of the reconstructions from (I–K). (M) Models of L2-candidate proteins PDIA3 (6ENY) and PDIA5 (Q14554). Catalytic (a, a’) and non-catalytic (b, b’) thioredoxin domains are indicated. (N,O) PDI domains a and b fitted into the reconstruction of OSTA-L2. (P) Sequence conservation plotted onto the surface model of the RPN2 NTD. Highly conserved residues reside at the binding site of the a’-domain of PDI or other OST subunits. (Q) Close-up view of the interaction site of STT3A and L2-1.

References

    1. Voorhees RM, Hegde RS. Toward a structural understanding of co-translational protein translocation. Curr. Opin. Cell Biol. 2016;41:91–99. - PubMed
    1. Gemmer M, Förster F. A clearer picture of the ER translocon complex. J. Cell Sci. 2020;133:jcs231340. - PubMed
    1. Voorhees RM, Ramakrishnan V. Structural basis of the translational elongation cycle. Annu. Rev. Biochem. 2013;82:203–236. - PubMed
    1. Ramirez AS, Kowal J, Locher KP. Cryo-electron microscopy structures of human oligosaccharyltransferase complexes OST-A and OST-B. Science. 2019;366:1372–1375. - PubMed
    1. Van den Berg B, et al. X-ray structure of a protein-conducting channel. Nature. 2004;427:36–44. - PubMed

Publication types

MeSH terms