. 2023 Mar;20(2):578-601.
doi: 10.1007/s13311-022-01336-2. Epub 2023 Jan 25.

Anti-inflammatory Therapy Protects Spiral Ganglion Neurons After Aminoglycoside Antibiotic-Induced Hair Cell Loss

Affiliations

Anti-inflammatory Therapy Protects Spiral Ganglion Neurons After Aminoglycoside Antibiotic-Induced Hair Cell Loss

Muhammad T Rahman et al. Neurotherapeutics. 2023 Mar.

Abstract

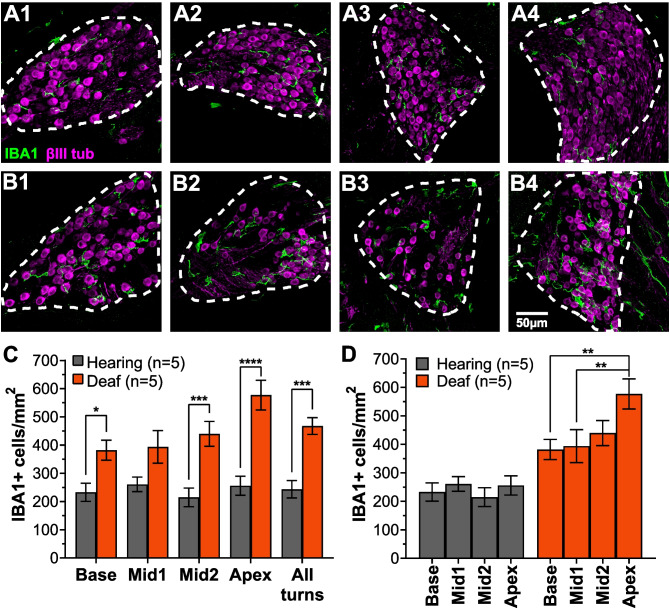
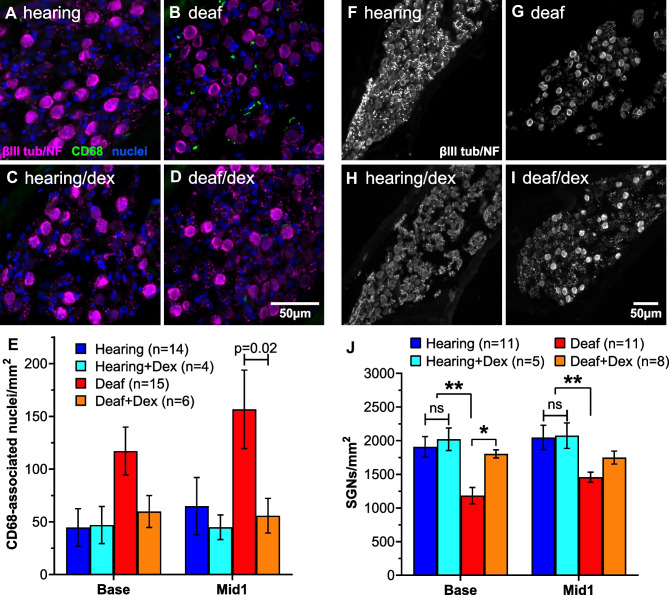
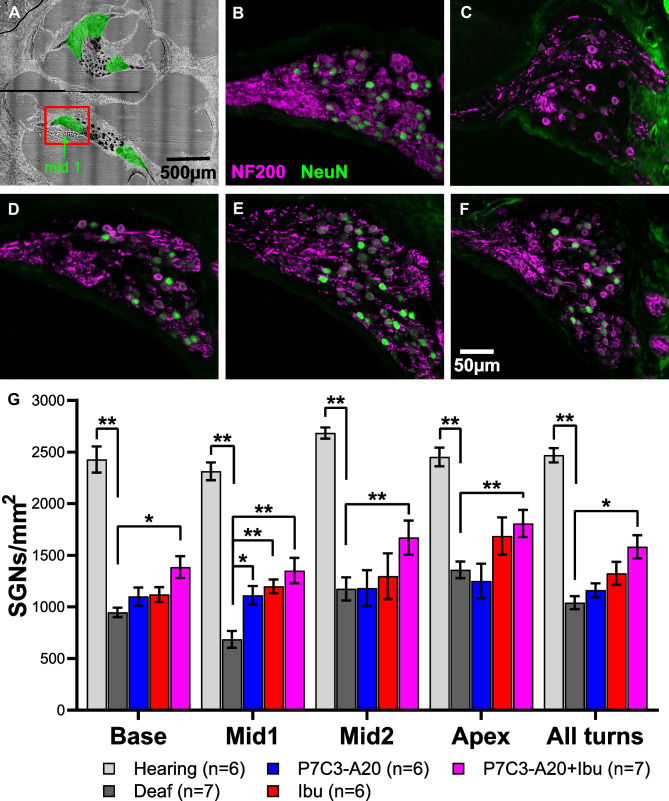
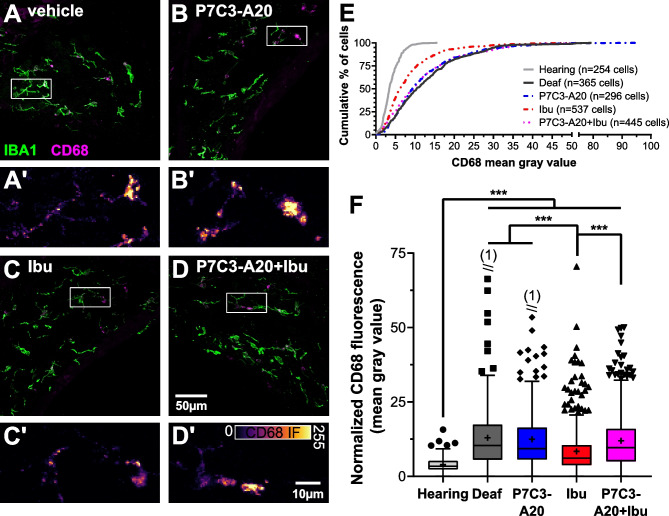
Destruction of cochlear hair cells by aminoglycoside antibiotics leads to gradual death of the spiral ganglion neurons (SGNs) that relay auditory information to the brain, potentially limiting the efficacy of cochlear implants. Because the reasons for this cochlear neurodegeneration are unknown, there are no neuroprotective strategies for patients. To investigate this problem, we assessed transcriptomic changes in the rat spiral ganglion following aminoglycoside antibiotic (kanamycin)-induced hair cell destruction. We observed selectively increased expression of immune and inflammatory response genes and increased abundance of activated macrophages in spiral ganglia by postnatal day 32 in kanamycin-deafened rats, preceding significant SGN degeneration. Treatment with the anti-inflammatory medications dexamethasone and ibuprofen diminished long-term SGN degeneration. Ibuprofen and dexamethasone also diminished macrophage activation. Efficacy of ibuprofen treatment was augmented by co-administration of the nicotinamide adenine dinucleotide-stabilizing agent P7C3-A20. Our results support a critical role of neuroinflammation in SGN degeneration after aminoglycoside antibiotic-mediated cochlear hair cell loss, as well as a neuroprotective strategy that could improve cochlear implant efficacy.

Keywords: Deafening; Dexamethasone; Ibuprofen; Inflammation; Neurodegeneration; P7C3-A20.


Figures

Fig. 1
Fig. 1
Microarray gene expression profiling reveals differential gene expression in the spiral ganglion of deafened rats. A Rats were injected daily with kanamycin from P8-P16. At P21, ABRs were performed to ensure that kanamycin-injected animals were deafened. For additional microarray analysis, normal-hearing and deafened rats were euthanized at P32 or at P60, as indicated, to collect RNA for microarray analysis. For histological studies, normal-hearing and deafened rats were euthanized at P60 or P70. B–D As described in Methods, normalized signal intensities of all expressed genes in all conditions were used as input to the GSEA software and the GSEA results were used as input to Cytoscape for network generation. Each node is a Gene Ontology (GO) category, the size of the node is a measure of how many genes are in the category, and edges (lines) indicated that genes are shared between the two connected terms. Nodes were organized into clusters based on similarity (genes shared and category name). B Network showing the overall comparison of normal-hearing vs. deaf, not considering age or cochlear location. Red nodes are categories enriched in deafened while blue nodes are enriched in hearing. B’ The number of GO terms in each identified cluster. C Heatmap of normalized signal intensity (further normalized by row) of the 500 genes with largest fold changes (either increase or decrease). D Network showing maturational changes that occur from P32 to P60. Blue nodes indicate that the terms were reduced at P60 relative to P32
Fig. 2
Fig. 2
Gene set enrichment analysis (GSEA) of normal-hearing vs. deafened rats at P32 and P60. A GSEA network showing terms enriched when comparing P32H to P32D. Red nodes indicate enrichment in P32D compared to P32, and blue nodes indicate the opposite. B GSEA network showing terms enriched when comparing P60H to P60D. Note that gene expression changes prominent at P60 are already evident by P32
Fig. 3
Fig. 3
Immune response genes are upregulated after deafening. Heatmap showing normalized expression of genes in the GO category GO:0006955 (immune response) (A) indicating that immune/inflammatory response genes are upregulated in the spiral ganglion of neonatally deafened rats. B–E Graphs of microarray signal intensity (B, D) and qPCR relative expression (C, E) of select immune response-related genes in the apex (B–C) or base (D–E) across all conditions. F-G) Graphs of microarray signal intensity (F) and qPCR relative expression (G) of two key apoptotic regulator genes and the neurotrophic factor CNTF in the apex and base across all conditions. Three biological replicates for all microarray data (B, D, F). One-way ANOVA, *p < 0.05, **p < 0.01, ***p < 0.001; n = # of biological replicates for qPCR data (C, E, G). In F and G there were no significant differences in gene expression across all conditions.
Fig. 4
Fig. 4
The number of macrophages increases significantly in the spiral ganglion post-deafening. A1-4, B1-4 Representative images of 25-µm-thick cochlear cryosections immunolabeled to show macrophages (Iba1-immunoreactive/Iba1 + ve cells, green) and neurons (beta3-tubulin–immunoreactive cells, magenta) from normal-hearing control and deafened rats. Rats were deafened P8-P16 and euthanized at P70 as described in Methods. All images are two-dimensional projections of three-dimensional confocal image stacks. Images from P70 normal-hearing (A) or deafened (B) rats from the basal turn (1), basal portion of middle turn (Mid1, 2), apical portion of middle turn (Mid2, 3), and apical turn (4). Dashed lines indicate the outline of Rosenthal’s canal, the border of the spiral ganglion used to determine cross-sectional area in this and all subsequent figures. The number of Iba1+ve cells within Rosenthal’s canal in each turn in each section was counted and normalized to the cross-sectional area. C–D Quantitation of the Iba1-immunopositive cell density (2-way ANOVA, Tukey’s multiple comparisons. *p < 0.05, **p < 0.01, ***p < 0.001, ****p < 0.0001; n = # of animals), either comparing hearing to deafened rats at each turn (C) or comparing cochlear locations in hearing or deafened cochlea (D)
Fig. 5
Fig. 5
The number of CD68+ve cells increases significantly in the spiral ganglion post-deafening. A, B Representative projection images of confocal stacks from the mid 1 turn in spiral ganglia from P70 normal-hearing (A) and deafened (B) rats showing Iba1 (green) and CD68 (magenta, inferno) labeling. Scale bar for insets in A and B = 20 µm. Iba1+ve cells were identified, and the mean gray value of CD68 immunofluorescence in each Iba1 + ve cell was measured using an ImageJ macro as described in Materials and Methods. A histogram showing the cumulative percentage of Iba1+ve cells with a CD68 mean gray value at or above the values on the x-axis is shown in (C). Note the rightward shift in the curve for the ganglia from deafened rats, indicating a higher frequency of Iba1+ve cells with higher CD68 immunoreactivity. D–K Time course of appearance of Iba1+ve cells in the spiral ganglion post-deafening. Rats, deafened with kanamycin P8-P16, were euthanized at P16 (D–E), P23 (F–G), P32 (H–I), or P60 (J–K). Six-µm-thick cryosections were labeled with the neuronal mix (magenta) and anti-CD68 (green) as described in Materials and Methods. The number of CD68-associated nuclei/mm2 in Rosenthal’s canal was calculated and is shown for each timepoint in (L). The density of CD68-associated nuclei was compared between normal-hearing and deafened at each timepoint and across the timepoints, within normal-hearing or deafened. A 2-way ANOVA, Tukey’s multiple comparisons. *p < 0.05, **p < 0.01, ***p < 0.001, ****p < 0.0001; n = # of animals
Fig. 6
Fig. 6
Dexamethasone treatment improves SGN survival in the cochlear base after deafening. Normal-hearing and deafened rats received dexamethasone in their drinking water as described in Materials and Methods. Rats were euthanized at P60 and cryosections prepared and immunolabeled. A–D Representative images of the basal turn labeled to detect SGNs (magenta), nuclei (blue), and CD68 (green) scale bar for FI = 50 µm. E Graph showing quantitation of CD68-immunopositive cells/mm2 in the spiral ganglion of rats with the indicated experimental conditions. Significance determined by Welch’s t-test. n = # of animals. F–I Representative images of the basal turn labeled with the neuronal mix antibodies (β III-tubulin + NF200) to detect SGNs. Scale bar for AD = 50 µm. J Graph showing quantitation of SGNs/mm2 in the spiral ganglion of rats with the indicated experimental conditions. *p < 0.05, **p < 0.01, 2-way ANOVA, Tukey’s multiple comparisons, n = # of animals
Fig. 7
Fig. 7
SGN cell density in spiral ganglia from control, ibuprofen-, and P7C3-A20-treated P70 rats. Six-µm-thick cryosections were labeled with anti-NeuN (green) to label SGN nuclei and anti-NF200 (magenta) to label SGN somata and axons. B–F Representative images of the middle 2 cross-section (indicated in A) of normal-hearing rats (B), or deafened rats treated with vehicle (C), P7C3-A20 (D), ibuprofen (E), or P7C3-A20 + ibuprofen (F). Scale bar shown in (F) is for panels (BF). Quantitation of SGNs/mm2 across all conditions and all cochlear turns is shown in (G): 2-way ANOVA, Tukey’s multiple comparisons. *p < 0.05, **p < 0.01, n = # of animals
Fig. 8
Fig. 8
Macrophage number in spiral ganglia of deafened rats treated with ibuprofen and/or P7C3-A20. A–D Representative images of macrophages (Iba1+ve, green) and SGNs (β-III-tubulin, magenta) from the basal (1), mid1 (2), mid2 (3), and apical (4) cross-sections of the spiral ganglion from deafened rats treated with vehicle (A1-4), P7C3-A20 (B1-4), ibuprofen (C1-4), or P7C3-A20 + ibuprofen (D1-4). Dashed lines indicate the outline of Rosenthal’s canal/border of the spiral ganglion. All images are projections of confocal stacks. E, F Quantitation of the Iba1+ve cell density comparing across conditions (treatments) at each turn (E) or comparing, within treatment groups, across cochlear location (F). A 2-way ANOVA, Tukey’s multiple comparisons. *p < 0.05, **p < 0.01; n = # of animals
Fig. 9
Fig. 9
Activated macrophages in spiral ganglia of normal-hearing rats or deafened rats treated with ibuprofen and/or P7C3-A20. A–D Representative images showing Iba1 (magenta) and CD68 (green) immunoreactivity in deafened rats treated with vehicle (A), P7C3-A20 (B), ibuprofen (C), or P7C3-A20 + ibuprofen (D). The white rectangles are the areas shown at higher magnification in (A’–D’). E Histogram showing the cumulative percentage of Iba1+ve cells with a mean IF intensity of CD68 at or above the level on the x-axis. F Tukey’s boxplot showing an increase in CD68 IF in all deafened conditions relative to hearing. Ibuprofen significantly reduced CD68 immunoreactivity. Boxes show interquartile range (IQR) with median (line), and mean ( +); whiskers extend 1.5 times the IQR. Values above 1.5 times the IQR are plotted individually. Numbers in parentheses indicate the number of values above the axis. One-way ANOVA, Tukey’s multiple comparisons, ****p < 0.0001

References

    1. Spoendlin H. Retrograde degeneration of the cochlear nerve. Acta Otolaryngol. 1975;79:266–275. doi: 10.3109/00016487509124683. - DOI - PubMed
    1. Green SH, Altschuler RA, Miller JM. Cell death and cochlear protection. In: Schacht J, Popper AN, Fay RR, editors. Auditory Trauma, Protection and Repair. Springer Handbook of Auditory Research. New York: Springer-Verlag; 2008.
    1. Alam SA, Robinson BK, Huang J, Green SH. Prosurvival and proapoptotic intracellular signaling in rat spiral ganglion neurons in vivo after the loss of hair cells. J Comp Neurol. 2007;503:832–852. doi: 10.1002/cne.21430. - DOI - PubMed
    1. Bailey EM, Green SH. Postnatal expression of neurotrophic factors accessible to spiral ganglion neurons in the auditory system of adult hearing and deafened rats. J Neurosci. 2014;34:13110–13126. doi: 10.1523/JNEUROSCI.1014-14.2014. - DOI - PMC - PubMed
    1. Hurley PA, Crook JM, Shepherd RK. Schwann cells revert to non-myelinating phenotypes in the deafened rat cochlea. Eur J Neurosci. 2007;26:1813–1821. doi: 10.1111/j.1460-9568.2007.05811.x. - DOI - PubMed

Publication types