

Cerebrovascular Pressure Reactivity According to Long-Pressure Reactivity Index During Spreading Depolarizations in Aneurysmal Subarachnoid Hemorrhage
- PMID: 36697998
- PMCID: PMC10499750
- DOI: 10.1007/s12028-022-01669-y
Cerebrovascular Pressure Reactivity According to Long-Pressure Reactivity Index During Spreading Depolarizations in Aneurysmal Subarachnoid Hemorrhage
Abstract
Background: Spreading depolarization (SD) has been linked to the impairment of neurovascular coupling. However, the association between SD occurrence and cerebrovascular pressure reactivity as a surrogate of cerebral autoregulation (CA) remains unclear. Therefore, we analyzed CA using the long-pressure reactivity index (L-PRx) during SDs in patients with aneurysmal subarachnoid hemorrhage (aSAH).
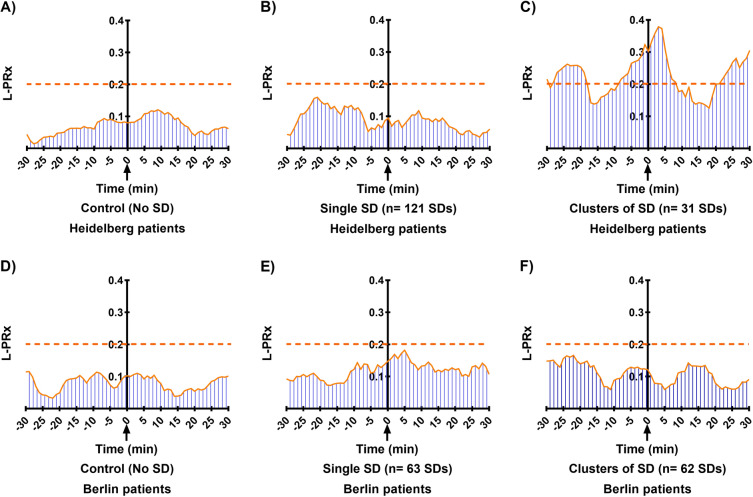
Methods: A retrospective study of patients with aSAH who were recruited at two centers, Heidelberg (HD) and Berlin (BE), was performed. Continuous monitoring of mean arterial pressure (MAP) and intracranial pressure (ICP) was recorded. ICP was measured using an intraparenchymal probe in HD patients and was measure in BE patients through external ventricular drainage. Electrocorticographic (ECoG) activity was continuously recorded between 3 and 13 days after hemorrhage. Autoregulation according to L-PRx was calculated as a moving linear Pearson's correlation of 20-min averages of MAP and ICP. For every identified SD, 60-min intervals of L-PRx were averaged, plotted, and analyzed depending on SD occurrence. Random L-PRx recording periods without SDs served as the control.
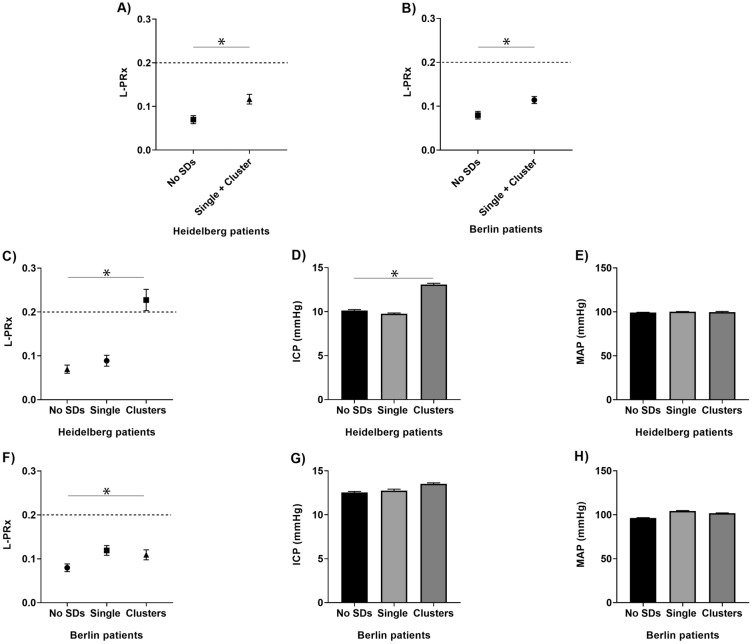
Results: A total of 19 patients (HD n = 14, BE n = 5, mean age 50.4 years, 9 female patients) were monitored for a mean duration of 230.4 h (range 96-360, STD ± 69.6 h), during which ECoG recordings revealed a total number of 277 SDs. Of these, 184 represented a single SD, and 93 SDs presented in clusters. In HD patients, mean L-PRx values were 0.12 (95% confidence interval [CI] 0.11-0.13) during SDs and 0.07 (95% CI 0.06-0.08) during control periods (p < 0.001). Similarly, in BE patients, a higher L-PRx value of 0.11 (95% CI 0.11-0.12) was detected during SDs than that during control periods (0.08, 95% CI 0.07-0.09; p < 0.001). In a more detailed analysis, CA changes registered through an intraparenchymal probe (HD patients) revealed that clustered SD periods were characterized by signs of more severely impaired CA (L-PRx during SD in clusters: 0.23 [95% CI 0.20-0.25]; single SD: 0.09 [95% CI 0.08-0.10]; control periods: 0.07 [95% CI 0.06-0.08]; p < 0.001). This group also showed significant increases in ICP during SDs in clusters compared with single SD and control periods.
Conclusions: Neuromonitoring for simultaneous assessment of cerebrovascular pressure reactivity using 20-min averages of MAP and ICP measured by L-PRx during SD events is feasible. SD occurrence was associated with significant increases in L-PRx values indicative of CA disturbances. An impaired CA was found during SD in clusters when using an intraparenchymal probe. This preliminary study validates the use of cerebrovascular reactivity indices to evaluate CA disturbances during SDs. Our results warrant further investigation in larger prospective patient cohorts.
Keywords: Aneurysmal subarachnoid hemorrhage; Cerebrovascular autoregulation; Cerebrovascular reactivity; Long-pressure reactivity index; Spreading depolarization.
© 2023. The Author(s).
Conflict of interest statement
The authors declare no conflicts of interest.
Figures
Similar articles
-
Oxygen-Based Autoregulation Indices Associated with Clinical Outcomes and Spreading Depolarization in Aneurysmal Subarachnoid Hemorrhage.Neurocrit Care. 2025 Apr;42(2):521-531. doi: 10.1007/s12028-024-02088-x. Epub 2024 Aug 27. Neurocrit Care. 2025. PMID: 39192101 Free PMC article.
-
Cerebral Autoregulation Correlation With Outcomes and Spreading Depolarization in Aneurysmal Subarachnoid Hemorrhage.Stroke. 2022 Jun;53(6):1975-1983. doi: 10.1161/STROKEAHA.121.037184. Epub 2022 Feb 24. Stroke. 2022. PMID: 35196873 Free PMC article.
-
ICP Monitoring by Open Extraventricular Drainage: Common Practice but Not Suitable for Advanced Neuromonitoring and Prone to False Negativity.Acta Neurochir Suppl. 2018;126:281-286. doi: 10.1007/978-3-319-65798-1_55. Acta Neurochir Suppl. 2018. PMID: 29492575
-
Alternative continuous intracranial pressure-derived cerebrovascular reactivity metrics in traumatic brain injury: a scoping overview.Acta Neurochir (Wien). 2020 Jul;162(7):1647-1662. doi: 10.1007/s00701-020-04378-7. Epub 2020 May 8. Acta Neurochir (Wien). 2020. PMID: 32385635 Review.
-
Correlation of clinical outcome with pressure-, oxygen-, and flow-related indices of cerebrovascular reactivity in patients following aneurysmal SAH.Neurocrit Care. 2010 Apr;12(2):234-43. doi: 10.1007/s12028-009-9287-8. Neurocrit Care. 2010. PMID: 19816810 Review.
Cited by
-
Multimodal monitoring: practical recommendations (dos and don'ts) in challenging situations and uncertainty.Front Neurol. 2023 May 3;14:1135406. doi: 10.3389/fneur.2023.1135406. eCollection 2023. Front Neurol. 2023. PMID: 37206910 Free PMC article. Review.
-
Cerebral autoregulation, spreading depolarization, and implications for targeted therapy in brain injury and ischemia.Rev Neurosci. 2024 Apr 8;35(6):651-678. doi: 10.1515/revneuro-2024-0028. Print 2024 Aug 27. Rev Neurosci. 2024. PMID: 38581271 Free PMC article. Review.
-
Oxygen-Based Autoregulation Indices Associated with Clinical Outcomes and Spreading Depolarization in Aneurysmal Subarachnoid Hemorrhage.Neurocrit Care. 2025 Apr;42(2):521-531. doi: 10.1007/s12028-024-02088-x. Epub 2024 Aug 27. Neurocrit Care. 2025. PMID: 39192101 Free PMC article.
References
-
- Riemann L, Beqiri E, Smielewski P, Czosnyka M, Stocchetti N, Sakowitz O, et al. Low-resolution pressure reactivity index and its derived optimal cerebral perfusion pressure in adult traumatic brain injury: a CENTER-TBI study. Crit Care. 2020;24:266. doi: 10.1186/s13054-020-02974-8. - DOI - PMC - PubMed
Publication types
MeSH terms
LinkOut - more resources
Full Text Sources
Research Materials
