

Unraveling the COVID-19 hospitalization dynamics in Spain using Bayesian inference
- PMID: 36698070
- PMCID: PMC9875773
- DOI: 10.1186/s12874-023-01842-7
Unraveling the COVID-19 hospitalization dynamics in Spain using Bayesian inference
Abstract
Background: One of the main challenges of the COVID-19 pandemic is to make sense of available, but often heterogeneous and noisy data. This contribution presents a data-driven methodology that allows exploring the hospitalization dynamics of COVID-19, exemplified with a study of 17 autonomous regions in Spain from summer 2020 to summer 2021.
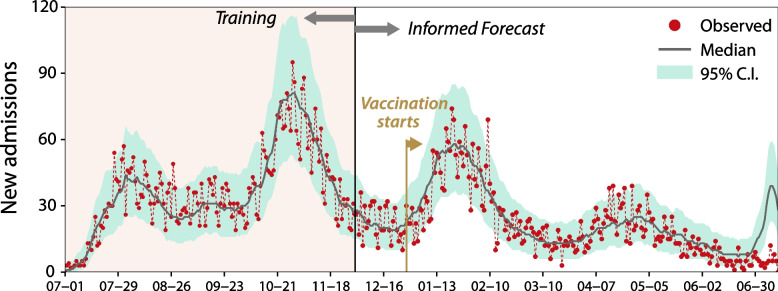
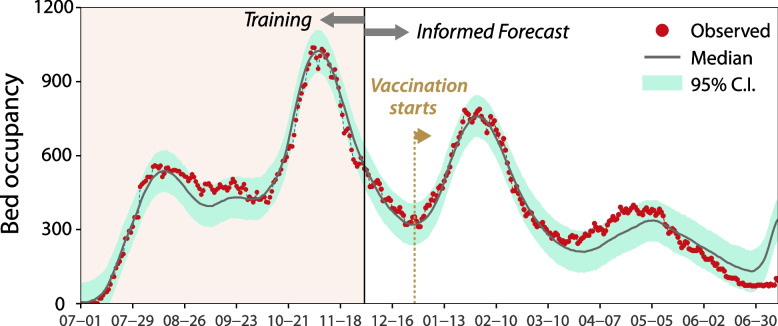
Methods: We use data on new daily cases and hospitalizations reported by the Spanish Ministry of Health to implement a Bayesian inference method that allows making short-term predictions of bed occupancy of COVID-19 patients in each of the autonomous regions of the country.
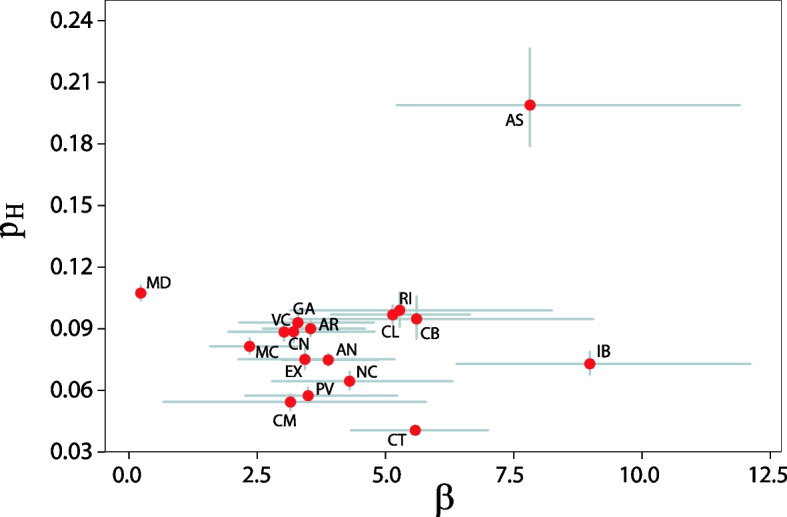
Results: We show how to use the temporal series for the number of daily admissions and discharges from hospital to reproduce the hospitalization dynamics of COVID-19 patients. For the case-study of the region of Aragon, we estimate that the probability of being admitted to hospital care upon infection is 0.090 [0.086-0.094], (95% C.I.), with the distribution governing hospital admission yielding a median interval of 3.5 days and an IQR of 7 days. Likewise, the distribution on the length of stay produces estimates of 12 days for the median and 10 days for the IQR. A comparison between model parameters for the regions analyzed allows to detect differences and changes in policies of the health authorities.
Conclusions: We observe important regional differences, signaling that to properly compare very different populations, it is paramount to acknowledge all the diversity in terms of culture, socio-economic status, and resource availability. To better understand the impact of this pandemic, much more data, disaggregated and properly annotated, should be made available.
Keywords: Bayesian inference; Covid-19; Hospitalization dynamics; Public health; Regional differences.
© 2023. The Author(s).
Conflict of interest statement
The authors declare no competing interests.
Figures

Similar articles
-
The Economic Impact of the SARS-COV-2 (COVID-19) Pandemic in Spain.Int J Environ Res Public Health. 2021 Apr 28;18(9):4708. doi: 10.3390/ijerph18094708. Int J Environ Res Public Health. 2021. PMID: 33925185 Free PMC article.
-
Real-time estimation and forecasting of COVID-19 cases and hospitalizations in Wisconsin HERC regions for public health decision making processes.BMC Public Health. 2023 Feb 17;23(1):359. doi: 10.1186/s12889-023-15160-6. BMC Public Health. 2023. PMID: 36803324 Free PMC article.
-
Hospitalization burden and epidemiology of the COVID-19 pandemic in Spain (2020-2021).BMC Infect Dis. 2023 Jul 18;23(1):476. doi: 10.1186/s12879-023-08454-y. BMC Infect Dis. 2023. PMID: 37464303 Free PMC article.
-
Worldwide differences of hospitalization for ST-segment elevation myocardial infarction during COVID-19: A systematic review and meta-analysis.Int J Cardiol. 2022 Jan 15;347:89-96. doi: 10.1016/j.ijcard.2021.10.156. Epub 2021 Nov 2. Int J Cardiol. 2022. PMID: 34740717 Free PMC article.
-
Hospitalizations from covid-19: a health planning tool.Rev Saude Publica. 2022 Jun 13;56:51. doi: 10.11606/s1518-8787.2022056004315. eCollection 2022. Rev Saude Publica. 2022. PMID: 35703605 Free PMC article. Review.
References
Publication types
MeSH terms
Grants and funding
LinkOut - more resources
Full Text Sources
Medical
