

A multi-omic analysis reveals the esophageal dysbiosis as the predominant trait of eosinophilic esophagitis
- PMID: 36698146
- PMCID: PMC9875471
- DOI: 10.1186/s12967-023-03898-x
A multi-omic analysis reveals the esophageal dysbiosis as the predominant trait of eosinophilic esophagitis
Abstract
Background: Eosinophilic esophagitis (EoE) is a chronic immune-mediated rare disease, characterized by esophageal dysfunctions. It is likely to be primarily activated by food antigens and is classified as a chronic disease for most patients. Therefore, a deeper understanding of the pathogenetic mechanisms underlying EoE is needed to implement and improve therapeutic lines of intervention and ameliorate overall patient wellness.
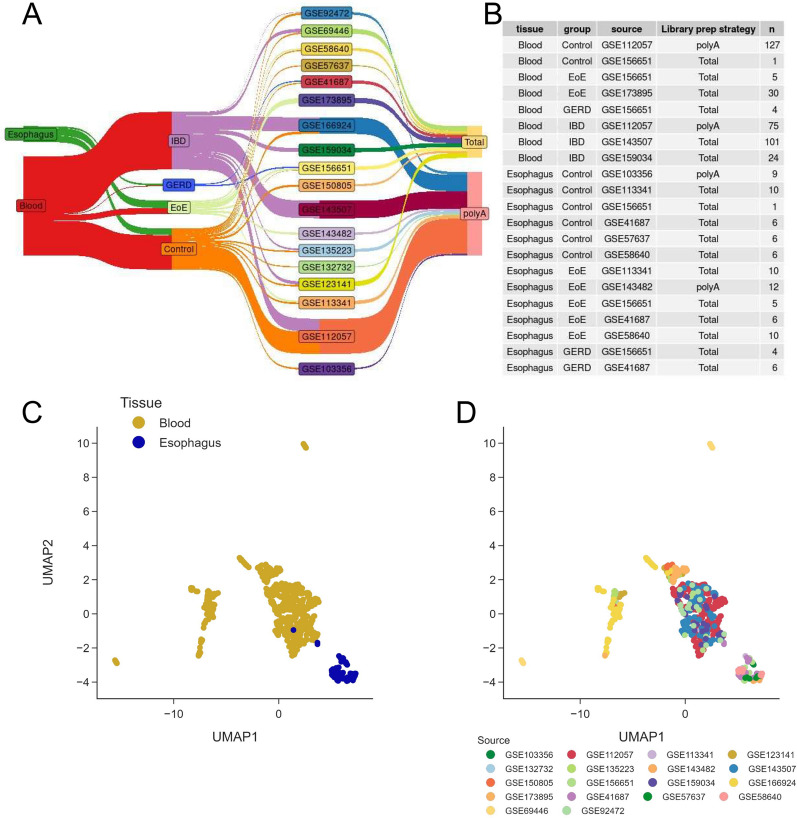
Methods: RNA-seq data of 18 different studies on EoE, downloaded from NCBI GEO with faster-qdump ( https://github.com/ncbi/sra-tools ), were batch-corrected and analyzed for transcriptomics and metatranscriptomics profiling as well as biological process functional enrichment. The EoE TaMMA web app was designed with plotly and dash. Tabula Sapiens raw data were downloaded from the UCSC Cell Browser. Esophageal single-cell raw data analysis was performed within the Automated Single-cell Analysis Pipeline. Single-cell data-driven bulk RNA-seq data deconvolution was performed with MuSiC and CIBERSORTx. Multi-omics integration was performed with MOFA.
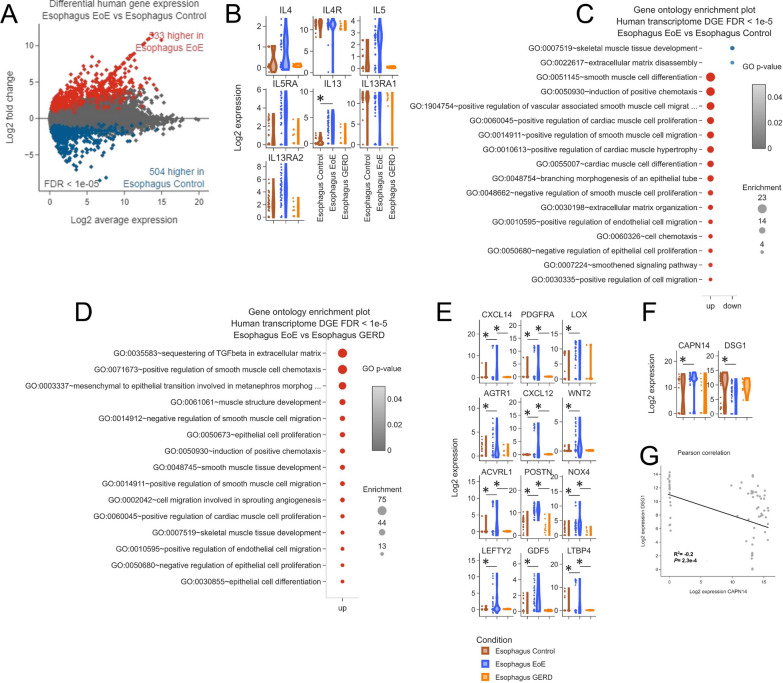
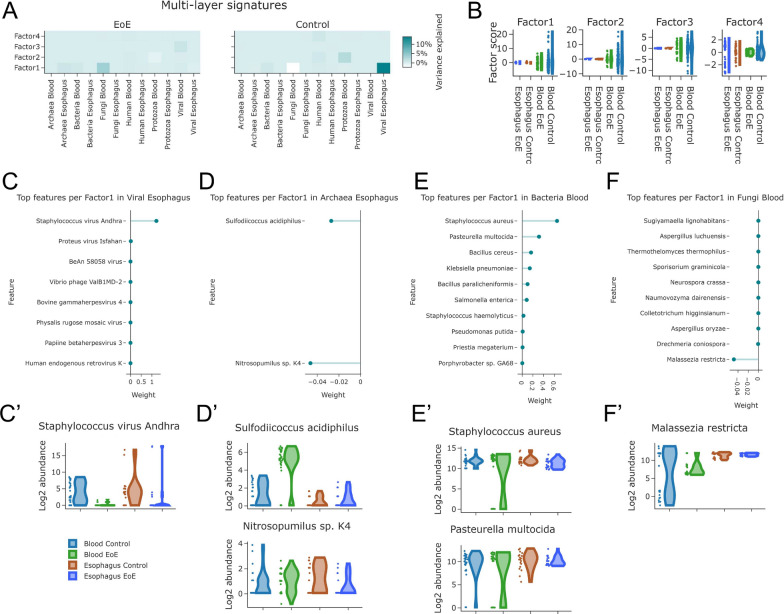
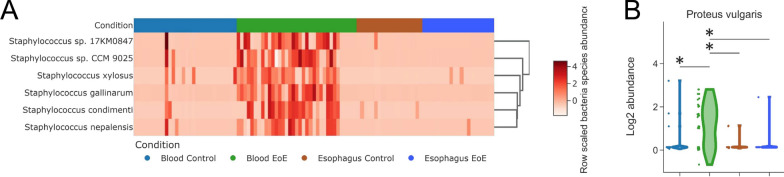
Results: The EoE TaMMA framework pointed out disease-specific molecular signatures, confirming its reliability in reanalyzing transcriptomic data, and providing new EoE-specific molecular markers including CXCL14, distinguishing EoE from gastroesophageal reflux disorder. EoE TaMMA also revealed microbiota dysbiosis as a predominant characteristic of EoE pathogenesis. Finally, the multi-omics analysis highlighted the presence of defined classes of microbial entities in subsets of patients that may participate in inducing the antigen-mediated response typical of EoE pathogenesis.
Conclusions: Our study showed that the complex EoE molecular network may be unraveled through advanced bioinformatics, integrating different components of the disease process into an omics-based network approach. This may implement EoE management and treatment in the coming years.
Keywords: Esophagus; Microbiota; Transcriptomics; Web app.
© 2023. The Author(s).
Conflict of interest statement
SD has served as a speaker, consultant, and advisory board member for Schering Plough, Abbott (AbbVie) Laboratories, Merck and Co, UCB Pharma, Ferring, Cellerix, Millenium Takeda, Nycomed, Pharmacosmos, Actelion, Alfa Wasserman, Genentech, Grunenthal, Pfizer, AstraZeneca, Novo Nordisk, Vifor, and Johnson and Johnson. LPB has served as consultant for Merck, Abbvie, Janssen, Genentech, Ferring, Tillots, Vifor, Pharmacosmos, Celltrion, Takeda, Biogaran, Boerhinger-lngelheim, Lilly, Pfizer, Jndex Pharmaceuticals, Amgen, Sandoz, Celgene, Biogen, Samsung Bioepis, Alma, Sterna, Nestlé, Enterome, Mylan, HAC-Pharma, Tigenix, and has served as speaker for Merck, Abbvie, Janssen, Genentech, Ferring, Tillots, Vifor, Pharmacosmos, Celltrion, Takeda, Boerhinger-lngelheim, Pfizer, Amgen, Biogen, Samsung Bioepis. ES declares lecture fees from Takeda, Janssen, MSD, Abbvie, Malesci, Sofar, and consulting fees from BMS, Gilead, Takeda, Janssen, MSD, Reckitt Benckiser, Sofar, Unifarco, SILA, Oftagest, Diadema. VJ has received consulting/advisory board fees from AbbVie, Alimentiv Inc (formerly Robarts Clinical Trials), Arena pharmaceuticals, Asieris, Bristol Myers Squibb, Celltrion, Eli Lilly, Ferring, Fresenius Kabi, Galapagos, GlaxoSmithKline, Genetech, Gilead, Janssen, Merck, Mylan, Pandion, Pendopharm, Pfizer, Reistone Biopharma, Roche, Sandoz, Takeda, Teva, and Topivert; speaker's fees from AbbVie, Ferring, Galapagos, Janssen Pfizer Shire, and Takeda. The other authors declare no conflicts of interest.
Figures


Similar articles
-
Advances in omics data for eosinophilic esophagitis: moving towards multi-omics analyses.J Gastroenterol. 2024 Nov;59(11):963-978. doi: 10.1007/s00535-024-02151-6. Epub 2024 Sep 19. J Gastroenterol. 2024. PMID: 39297956 Free PMC article. Review.
-
Assessment of local and systemic signature of eosinophilic esophagitis (EoE) in children through multi-omics approaches.Front Immunol. 2023 Mar 15;14:1108895. doi: 10.3389/fimmu.2023.1108895. eCollection 2023. Front Immunol. 2023. PMID: 37006253 Free PMC article.
-
Host-Microbiota Interactions in the Esophagus During Homeostasis and Allergic Inflammation.Gastroenterology. 2022 Feb;162(2):521-534.e8. doi: 10.1053/j.gastro.2021.10.002. Epub 2021 Oct 8. Gastroenterology. 2022. PMID: 34627858 Free PMC article.
-
A synthesis and subgroup analysis of the eosinophilic esophagitis tissue transcriptome.J Allergy Clin Immunol. 2024 Mar;153(3):759-771. doi: 10.1016/j.jaci.2023.10.002. Epub 2023 Oct 17. J Allergy Clin Immunol. 2024. PMID: 37852329 Free PMC article.
-
Eosinophilic esophagitis and esophageal microbiota.Front Cell Infect Microbiol. 2023 Aug 3;13:1206343. doi: 10.3389/fcimb.2023.1206343. eCollection 2023. Front Cell Infect Microbiol. 2023. PMID: 37600943 Free PMC article. Review.
Cited by
-
Focus on Achalasia in the Omics Era.Int J Mol Sci. 2024 Sep 21;25(18):10148. doi: 10.3390/ijms251810148. Int J Mol Sci. 2024. PMID: 39337632 Free PMC article. Review.
-
Causal relationship between eosinophilic esophagitis and inflammatory bowel disease: a bidirectional two-sample Mendelian randomization study.Front Immunol. 2024 Apr 24;15:1374107. doi: 10.3389/fimmu.2024.1374107. eCollection 2024. Front Immunol. 2024. PMID: 38720886 Free PMC article.
-
Development and dysfunction of structural cells in eosinophilic esophagitis.J Allergy Clin Immunol. 2024 Jun;153(6):1485-1499. doi: 10.1016/j.jaci.2024.04.006. J Allergy Clin Immunol. 2024. PMID: 38849184 Free PMC article. Review.
-
Unraveling the pathogenesis of Barrett's esophagus and esophageal adenocarcinoma: the "omics" era.Front Oncol. 2025 Jan 30;14:1458138. doi: 10.3389/fonc.2024.1458138. eCollection 2024. Front Oncol. 2025. PMID: 39950103 Free PMC article. Review.
-
The Overlap of Allergic Disorders and Upper Gastrointestinal Symptoms: Beyond Eosinophilic Esophagitis.Nutrients. 2025 Apr 16;17(8):1355. doi: 10.3390/nu17081355. Nutrients. 2025. PMID: 40284218 Free PMC article.
References
Publication types
MeSH terms
Substances
LinkOut - more resources
Full Text Sources
Medical
Miscellaneous
