. 2023 Jan 25;21(1):29.
doi: 10.1186/s12951-023-01788-4.

Exosomes derived from human adipose mesenchymal stem cells ameliorate hepatic fibrosis by inhibiting PI3K/Akt/mTOR pathway and remodeling choline metabolism

Affiliations

Exosomes derived from human adipose mesenchymal stem cells ameliorate hepatic fibrosis by inhibiting PI3K/Akt/mTOR pathway and remodeling choline metabolism

Zilong Zhang et al. J Nanobiotechnology. .

Abstract

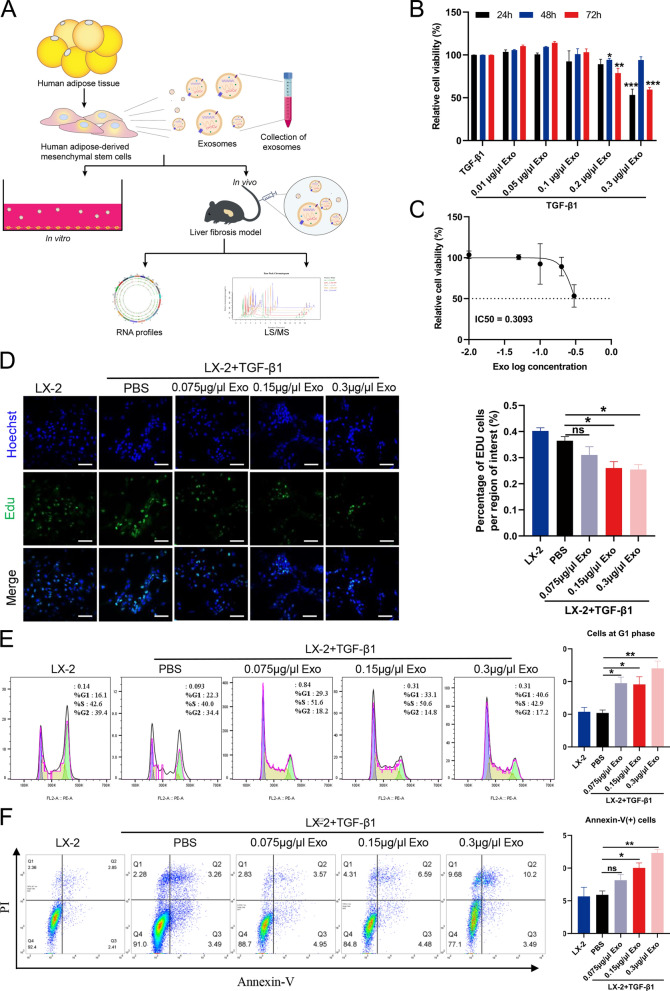
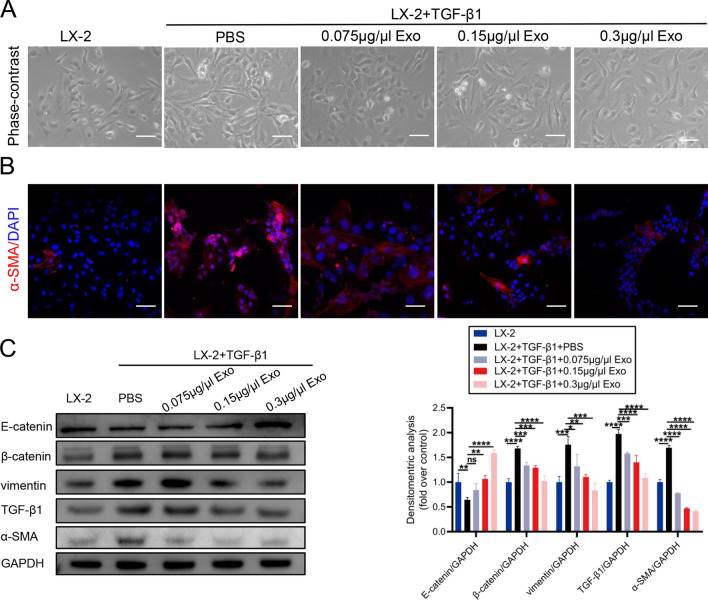
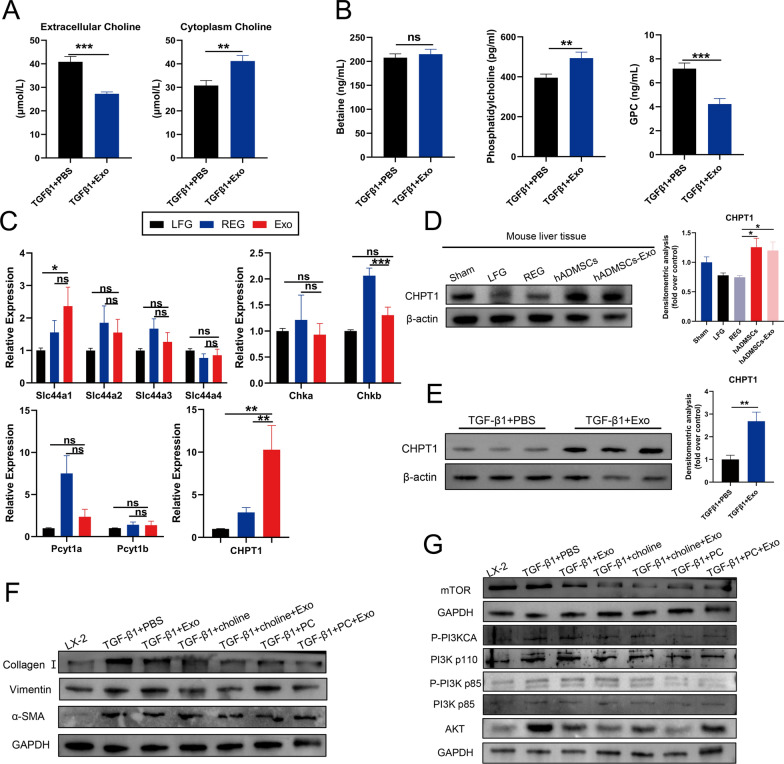
Liver fibrosis is a chronic liver disease with the presence of progressive wound healing response caused by liver injury. Currently, there are no approved therapies for liver fibrosis. Exosomes derived from human adipose mesenchymal stem cells (hADMSCs-Exo) have displayed a prominent therapeutic effect on liver diseases. However, few studies have evaluated therapeutic effect of hADMSCs-Exo in liver fibrosis and cirrhosis, and its precise mechanisms of action remain unclear. Herein, we investigated anti-fibrotic efficacy of hADMSCs-Exo in vitro and in vivo, and identified important metabolic changes and the detailed mechanism through transcriptomic and metabolomic profiling. We found hADMSCs-Exo could inhibit the proliferation of activated hepatic stellate cells through aggravating apoptosis and arresting G1 phase, effectively inhibiting the expression of profibrogenic proteins and epithelial-to-mesenchymal transition (EMT) in vitro. Moreover, it could significantly block collagen deposition and EMT process, improve liver function and reduce liver inflammation in liver cirrhosis mice model. The omics analysis revealed that the key mechanism of hADMSCs-Exo anti-hepatic fibrosis was the inhibition of PI3K/AKT/mTOR signaling pathway and affecting the changes of metabolites in lipid metabolism, and mainly regulating choline metabolism. CHPT1 activated by hADMSCs-Exo facilitated formation and maintenance of vesicular membranes. Thus, our study indicates that hADMSCs-Exo can attenuate hepatic stellate cell activation and suppress the progression of liver fibrosis, which holds the significant potential of hADMSCs-Exo for use as extracellular nanovesicles-based therapeutics in the treatment of liver fibrosis and possibly other intractable chronic liver diseases.

Keywords: Choline; Exosomes; Human adipose mesenchymal stem cells; Liver fibrosis; Metabolomics.


Conflict of interest statement

The authors declare no competing interests.

Figures

Fig. 1
Fig. 1
Characterization of and hADMSCs and hADMSCs-Exo. A Morphological appearance of cultured hADMSCs (bar = 100 μm). B Representative TEM images of hADMSCs-Exo (bar = 500 nm and 100 nm). C Flow cytometry for nanoparticle analysis of hADMSCs-Exo. D Size distribution measurements of hADMSCs-Exo by NTA under flow conditions. E Western blot analysis of TSG101, CD63, CD81 and GAPDH in hADMSCs-Exo and whole-cell lysis of hADMSCs. F CLSM images of hADMSCs-Exo labeled with PKH26. Red: PKH26-Exo. Blue: DAPI. Scale bar, 40 μm
Fig. 2
Fig. 2
hADMSCs-Exo inhibits hepatic stellate cell proliferation by impeding cell cycle progression and inducing apoptosis. A A schematic representation of the experimental design. B In vitro cell viabilities of activated LX-2 cells incubated with hADMSCs-Exo at the indicated concentration in the presence of TGF-β1 (10 ng/ml) for 24 h, 48 h or 72 h, (n = 5). C IC50 were analysed in activated LX-2 cells exposed to hADMSCs-Exo for 24 h. D Edu assay showed that HSCs proliferation was suppressed by hADMSCs-Exo in a concentration-dependent manner. EdU% is used as an approximation for proliferation rate. E Cell cycle analysis showed an increase in the sub-G1 subpopulation and cell cycle arrest after hADMSCs-Exo. F The quantitative analysis of the apoptosis was performed using the Annexin-FITC staining based flow cytometry. Exo, exosome. Data are presented as means with SEM (n = 3 independent experiments). ns, not significant, *p < 0.05, **p < 0.01 and ***p < 0.001
Fig. 3
Fig. 3
hADMSCs-Exo internalized by LX2 cells exhibit antifibrotic and anti-EMT effect in vitro. A Representative phase-contrast images of quiescent HSCs and aHSCs were treated with hADMSCs-Exo at the indicated concentration in the presence of TGF-β1 (10 ng/ml). Analyses were conducted 24 h after the indicated treatments. Scale bars, 100 mm. B Representative immunofluorescence images of α-SMA (red) and DAPI (blue) of aHSCs were treated with hADMSCs-Exo. Scale bars, 100 mm. C Western blot analysis of LX-2 cell incubated with hADMSCs-Exo for 24 h in the presence of TGF-β1 (10 ng/ml). Data expressed as the mean ± SEM (n = 3 independent experiments). ns, not significant, *p < 0.05, **p < 0.01, ***p < 0.001 and ****p < 0.0001
Fig. 4
Fig. 4
hADMSCs-Exo could alleviate CCl4-induced mice liver fibrosis in vivo A Diagram of experimental scheme. B Elastograms obtained using shear wave elastrography (reliable images were obtained when uniform colour filled > 90% of the sampling area) and liver stiffness quantification. C Body weight changes during treatment. D Representative photographs of lives from mice in each group and histopathological images of liver sections were evaluated using H&E, Masson trichrome staining and Sirius red staining in animals with CCl4-induced cirrhosis. Liver histopathology grading was evaluated by necro-inflammatory scoring and Ishak (modified Knodell) scoring system after treatment. E Images of immunohistochemistry staining of extracellular matrix (ECM) proteins (collagen I and α-SMA). F The protein levels of ECM and EMT-related proteins in the liver tissues of the mice with different treatments. SWE, shear wave elastrography. LFG, liver fibrosis group, REG, regression group. Data are expressed as mean ± SEM (n = 6), ns, not significant, *p < 0.05, **p < 0.01, ***p < 0.001 and ****p < 0.0001
Fig. 5
Fig. 5
hADMSCs-Exo treatment improves liver function and regeneration, reduces liver inflammation and apoptosis. A The Hyp and MDA levels of normal mice (Sham), fbrotic mouse model and the mice injected with PBS, hADMSCs or hADMSCs-Exo were measured with corresponding test kit B Serum levels of AST, ALT, ALP in different groups. C The relative inflammatory gene expression for IL-1β, IL-6, IL-10 and TNF-α. D Immunohistochemical staining was performed to detect the protein expressions of Ki67, HNF-4α and caspase 3 in the injured liver of mice treated with hADMSCs and hADMSCs-Exo. Scale bar, 40 μm. AST, aspartate aminotransferase, ALT, alanine aminotransferase, ALP, alkaline phosphatease. LFG, liver fibrosis group, REG, regression group. Data are expressed as mean ± SEM (n = 4), ns, not significant, *p < 0.05, **p < 0.01 and ***p < 0.001
Fig. 6
Fig. 6
hADMSCs-Exo inhibited HSCs activation and liver fibrosis through PI3K/AKT/mTOR signaling pathway. A Heatmap of differential expression analysis of RNA-sequencing data from LFG, REG and hADMSCs-Exo. B Venn diagram of LFG vs REG, LFG vs hADMSCs-Exo and REG vs hADMSCs-Exo. C GO analysis results of the DEGs between REG and hADMSCs-Exo, including cell component (CC), molecular function (MF) and biological process (BP). Red represents CC, green represents MF, blue represents BP. D The top 10 significant GO terms of DEGs. E KEGG analysis of significant pathway of DEGs. F Volcano plot and significantly DEGs in PI3K/AKT pathway. Red represents up-regulated, blue represents down-regulated genes. G The mRNA levels of significantly DEGs in PI3K/AKT pathway were determined by qRT–PCR. H Fibronectin and AKT protein levels in LX-2 or treated with pbs, hADMSCs-Exo in the presence of TGF-β1 (10 ng/ml) for 24 h were measured by immunofluorescence staining. I Western blot assay for AKT, mTOR and phosphorylated and total PI3K p85 and PI3K p110 in mouse liver issue. J Quantification of AKT and mTOR by qRT–PCR. K The expression level of AKT, mTOR and phosphorylated and total PI3K p85 and PI3K p110 after HSCs were incubated with hADMSCs-Exo. LFG, liver fibrosis group, REG, regression group. Data are presented as means with SEM (n = 3 independent experiments). ns, not significant, *p < 0.05, **p < 0.01, ***p < 0.001 and ****p < 0.0001
Fig. 7
Fig. 7
hADMSCs-Exo inhibits liver fibrosis by regulating choline metabolism. A Score plots from the PCA model derived from the UPLC-MS profile of liver obtained from mice in different groups. B Score plots from the OPLS-DA model from metabolic profiles of different groups. C Venn diagram of differential metabolites between LFG, REG, hADMSCs and hADMSCs-Exo-treated group. D The hierarchical clustering heatmap of the top 30 metabolites between different groups. E Summary of pathway analysis of differential metabolites between REG and hADMSCs-Exo-treated group. F Summary of pathway analysis of differential metabolites between LFG and hADMSCs-Exo-treated group. G The quantitative analysis of the key metabolites in choline metabolism based on metabolic profiles. H Quantitative analyses of the key metabolites in choline metabolism by ELISA. LFG, liver fibrosis group, REG, regression group. Data expressed as the mean ± SEM. ns, not significant, *p < 0.05, **p < 0.01, ***p < 0.001 and ****p < 0.0001
Fig. 8
Fig. 8
hADMSCs-Exo regulates the choline metabolism, which involved in PI3K/AKT/mTOR signaling pathway to anti-liver fibrosis. A Quantitative analyses of extracellular and intracellular choline content in activated LX-2 cells or incubated with hADMSCs-Exo. B Quantitative analyses of total intracellular betaine, phosphatidylcholine and glycerophosphocholine content. C The mRNA levels of choline metabolism related genes were determined by qRT–PCR in livers of mice. D, E The protein levels of CHPTI were determined by western blotting in the liver tissues of the mice with different treatments and HSCs incubated with hADMSCs-Exo. F, G The expression level of profibrogenic markers (Collagen I, Vimentin and α-SMA) and PI3K/AKT signalling pathway proteins were determined by western blotting in activated LX-2 cells incubated with hADMSCs-Exo and treated (or not treated) with choline or phosphorylcholine. GAPDH was used as a loading control. Exo, exosomes. LFG, liver fibrosis group, REG, regression group. Slc44a1-4, Solute Carrier Family 44 Member. Chka, Choline Kinase Alpha. Chkb, Choline Kinase beta. Pcyt1a, Phosphate Cytidylyltransferase 1A. Pcyt1a, Phosphate Cytidylyltransferase 1B. CHPT1, Choline Phosphotransferase 1. CHPT1, diacylglycerol cholinephosphotransferase 1. PC, phosphorylcholine. Data expressed as the mean ± SEM (n = 3 independent experiments). ns, not significant, *p < 0.05, **p < 0.01, ***p < 0.001 and ****p < 0.0001

Similar articles

Cited by

References

    1. Asrani SK, Devarbhavi H, Eaton J, Kamath PS. Burden of liver diseases in the world. J Hepatol. 2019;70(1):151–171. doi: 10.1016/j.jhep.2018.09.014. - DOI - PubMed
    1. Bataller R, Brenner DA. Liver fibrosis. J Clin Investig. 2005;115(2):209–218. doi: 10.1172/JCI24282. - DOI - PMC - PubMed
    1. Jiang JX, Torok NJ. Liver Injury and the Activation of the Hepatic Myofibroblasts. Curr Pathobiol Rep. 2013;1(3):215–223. doi: 10.1007/s40139-013-0019-6. - DOI - PMC - PubMed
    1. Mazza G, Al-Akkad W, Rombouts K. Engineering in vitro models of hepatofibrogenesis. Adv Drug Deliv Rev. 2017;121:147–157. doi: 10.1016/j.addr.2017.05.018. - DOI - PubMed
    1. Hou W, Syn WK. Role of metabolism in hepatic stellate cell activation and fibrogenesis. Front Cell Dev Biol. 2018;6:150. doi: 10.3389/fcell.2018.00150. - DOI - PMC - PubMed

LinkOut - more resources