. 2023 Jan 25;16(1):4.
doi: 10.1186/s13072-023-00478-7.

Dynamic changes in whole genome DNA methylation, chromatin and gene expression during mouse lens differentiation

Affiliations

Dynamic changes in whole genome DNA methylation, chromatin and gene expression during mouse lens differentiation

William Chang et al. Epigenetics Chromatin. .

Abstract

Background: Cellular differentiation is marked by temporally and spatially coordinated gene expression regulated at multiple levels. DNA methylation represents a universal mechanism to control chromatin organization and its accessibility. Cytosine methylation of CpG dinucleotides regulates binding of methylation-sensitive DNA-binding transcription factors within regulatory regions of transcription, including promoters and distal enhancers. Ocular lens differentiation represents an advantageous model system to examine these processes as lens comprises only two cell types, the proliferating lens epithelium and postmitotic lens fiber cells all originating from the epithelium.

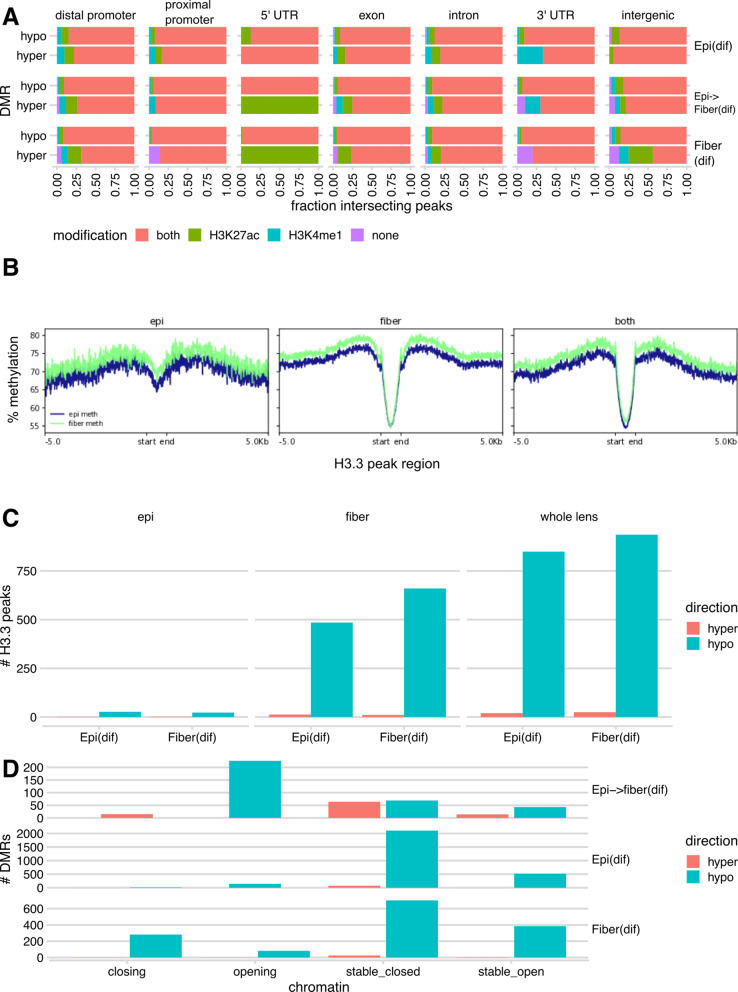
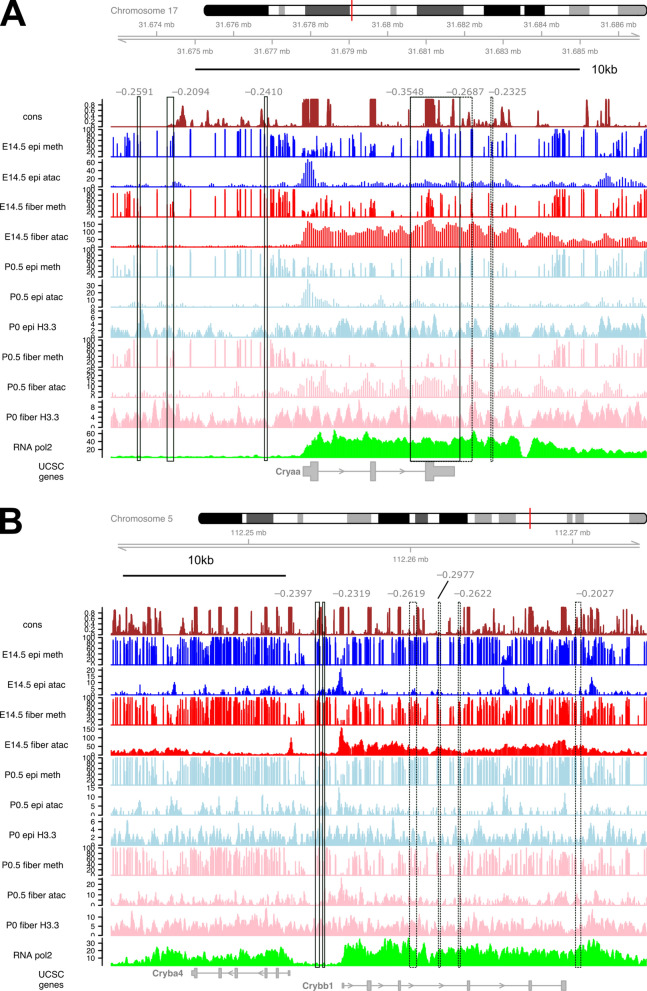
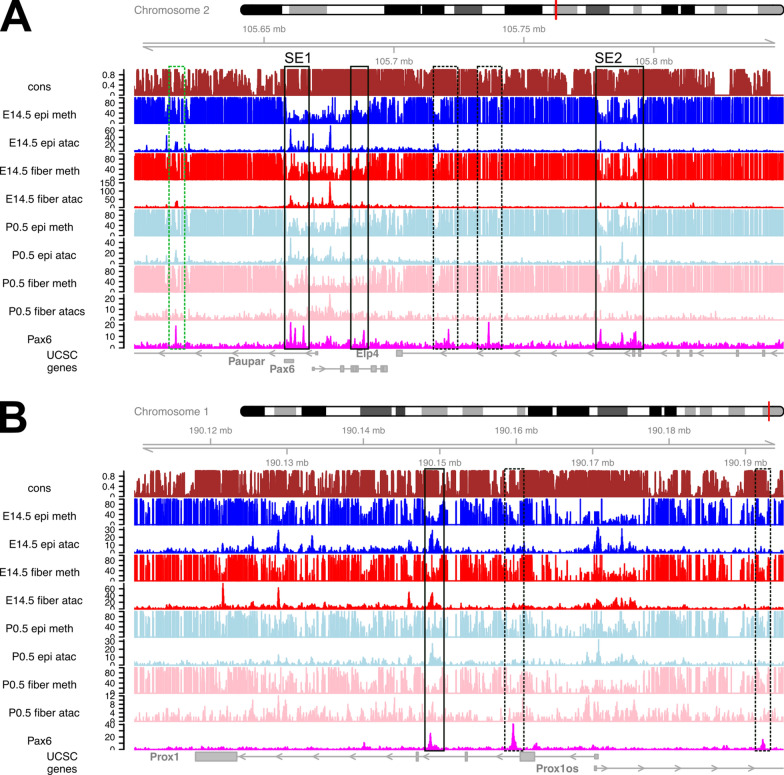
Results: Using whole genome bisulfite sequencing (WGBS) and microdissected lenses, we investigated dynamics of DNA methylation and chromatin changes during mouse lens fiber and epithelium differentiation between embryos (E14.5) and newborns (P0.5). Histone H3.3 variant chromatin landscapes were also generated for both P0.5 lens epithelium and fibers by chromatin immunoprecipitation followed by next generation sequencing (ChIP-seq). Tissue-specific features of DNA methylation patterns are demonstrated via comparative studies with embryonic stem (ES) cells and neural progenitor cells (NPCs) at Nanog, Pou5f1, Sox2, Pax6 and Six3 loci. Comparisons with ATAC-seq and RNA-seq data demonstrate that reduced methylation is associated with increased expression of fiber cell abundant genes, including crystallins, intermediate filament (Bfsp1 and Bfsp2) and gap junction proteins (Gja3 and Gja8), marked by high levels of histone H3.3 within their transcribed regions. Interestingly, Pax6-binding sites exhibited predominantly DNA hypomethylation in lens chromatin. In vitro binding of Pax6 proteins showed Pax6's ability to interact with sites containing one or two methylated CpG dinucleotides.

Conclusions: Our study has generated the first data on methylation changes between two different stages of mammalian lens development and linked these data with chromatin accessibility maps, presence of histone H3.3 and gene expression. Reduced DNA methylation correlates with expression of important genes involved in lens morphogenesis and lens fiber cell differentiation.

Keywords: ATAC-seq; DNA methylation; Differentiation; Gene regulation; Histone H3.3; Lens; Open chromatin; Pax6; RNA-seq.


Conflict of interest statement

The authors declare no competing interests.

Figures

Fig. 1
Fig. 1
Experimental model and clustering of samples based on DNA methylation patterns using 100,000 randomly sampled CpGs. A Schematic illustration of lens epithelial and fiber cells compartments. B Violin plots showing distribution of CpG methylation scores across genomic features for all four groups lens samples and representative non-lens cells, including NPC and ES cells. Bottom panel: schematic of genomic feature annotations. C Left: PCA showing distinction in methylation patterns of sampled CpGs among lens samples and representative non-lens cells. Right: magnification of inset from left panel showing the three developmental path segments, path “epithelial” differentiation, Epi(dif), path “epithelial to fiber cell” differentiation at E14.5, EpiFiber(dif), and path “fiber cell” differentiation, Fiber(dif), respectively. The color codes of each sample are shown on the right
Fig. 2
Fig. 2
Comparison of methylation between lens and non-lens cells at the Nanog, Pou5f1, and Sox2 loci encoding the core pluripotency GRN in the ES cells. A Nanog locus. We marked ~ 8 kb region of demethylation, including both the distal and proximal promoter regions and extending into the 5′-portion of intron 2 in ES cells (boxed). Gain of methylation in other cell types is also shown (dotted boxes). B Pou5f1 locus. We marked ~ 6.5 kb of demethylated/low-methylated DNA that includes 5′-promoter flanking region extending towards intron 4 in ES cells (boxed). Major gain of DNA methylation is found in other samples (boxed). C Sox2 locus. We show ~ 60 kb of Sox2 locus as this region contains multiple distal enhancers active during chicken lens placode formation [60]. Note that low methylation region (~ 8 kb) include upstream region of its promoter and the entire coding region of the Sox2 locus
Fig. 3
Fig. 3
Comparison of methylation between lens and non-lens cells at Pax6 and Six3 loci. A Pax6 locus including Pax6os1. All lens and NPC samples exhibit a broad continuous ~ 38 kb domain of reduced DNA methylation (boxed in the NPC track) in all four lens samples with the lowest signal across this region in E14.5 lens epithelium. B Six3 locus including Six3os1. The region of low methylation in NPC is boxed. The individual tracks include evolutionarily conserved regions and DNA methylation in E14.5 lens epithelium (epi), E14.5 lens fibers, P0.5 lens epithelium (epi), P0.5 lens fibers, NPC and ES cells
Fig. 4
Fig. 4
Identification and quantitative analyses of UMRs and LMRs in four lens samples. A Distributions of median methylation and number of CpGs in un- or low-methylated regions. Solid horizontal line within boxes: median of median per-region methylation scores. Bottom and top box edges: first and third quartiles, respectively. Bottom and top whiskers: data no smaller than 1.5× the interquartile range from the bottom edge and no greater than 1.5 × the interquartile range from the top edge, respectively. Points: outliers exceeding whisker values. B Log2 enrichment of both UMR and LMR regions across genomic features compared to 20 random shuffles of regions
Fig. 5
Fig. 5
GO enrichment of reproducible UMRs and LMRs across four lens cell types. The figure shows the top 10 biological process terms in each cell type
Fig. 6
Fig. 6
Regions of differential DNA methylation between three lens differentiation pathways: Epi(dif), EpiFiber(dif) and Fiber(dif). A Log2 enrichment of DMRs at different genomic features compared to 20 iterations of randomly shuffled regions for each differentiation path across genomic features. For details on the boxplot representation, see Fig. 3 caption. No enrichment (identical to random) is indicated with a dashed line. B GO enrichment of DMRs in each three individual paths
Fig. 7
Fig. 7
Global analysis of histone H3.3 variant in lens cell chromatin. A Aggregated histone H3.3 ChIP-seq read densities within ± 5 kb of called peaks for all four samples (two replicates each). B Numbers of histone H3.3 ChIP-seq peaks in newborn lens by genomic feature (see Fig. 1B), categorized as lens epithelium-specific, fiber-specific, or shared. C Top enriched GO biological process terms for three categories of histone H3.3 peaks
Fig. 8
Fig. 8
Relationships between DNA methylation, histone H3K27ac and H3K4me1 modifications, and H3.3. A Fractions of DMRs intersecting with H3K27ac or H3K4me1 ChIP-seq peaks from whole newborn lens chromatin [31]. B % methylation within ± 5 kb of newborn epithelium-specific, fiber-specific, and shared H3.3 peaks. C Counts of DMRs intersecting H3.3 peaks across the Epi(dif) and Fiber(dif) paths. D Counts of DMRs intersecting chromatin states across all paths
Fig. 9
Fig. 9
DNA methylation and chromatin accessibility profiles in the Cryaa and Cryab4-Crybb1 loci. A Cryaa locus (chromosome 17). B Cryba4-Crybb1 loci expressed in opposite directions (chromosome 5). In addition to four DNA methylation tracks (see Fig. 2), two H3.3 ChIP-seq and four ATAC-seq tracks are shown. The bottom track shows RNA polymerase II ChIP-seq data (whole lens) [79]. Boxes denote DMRs: solid lines: path Epi(dif); dashed lines: path EpiFiber(dif).
Fig. 10
Fig. 10
Differential DNA methylation, chromatin accessibility, and gene expression between in lens differentiation paths Epi(dif), EpiFiber(dif), and Fiber(dif). A Numbers of differentially methylated and accessible regions (DMARs) associated with DEGs for each path segment. B Numbers of DEGs associated with differentially methylated and accessible regions for each path segment. C Enriched GO terms of differentially methylated and accessible regions. Figure shows top 10 biological processes from each path segment
Fig. 11
Fig. 11
DNA Methylation and chromatin accessibility in Pax6 ChIP-seq peaks. A Profiles of DNA methylation in lens samples and chromatin accessibility via ATAC-seq in Pax6 peaks in newborn, sorted by regions of open chromatin in either epithelium or fiber and closed chromatin in both lens samples. Pax6 peaks appear in both open and closed chromatin, with the center of open chromatin regions showing demethylation overall. B Mean methylation within Pax6 peaks in representative epithelium and fiber samples. DNA Methylation within Pax6 peaks in the whole lens strongly correlated between epithelium and fiber. While Pax6 peaks concentrate towards regions showing low methylation in both epithelium and fiber, a significant number of peaks occupy regions with high methylation in both cell types
Fig. 12
Fig. 12
DNA methylation, chromatin accessibility and Pax6-binding at the Pax6 and Prox1 loci in lens chromatin. A Pax6 locus, including Paupar (Pax6os1) and portion of Elp4. Two super-enhancer regions SE1 and SE2 are marked. Three regions of Pax6 binding, reduced methylation and open chromatin (boxed), 5′-distal region of Pax6 binding, high methylation and open chromatin of unknown function (green box), two regions of Pax6 binding, high methylation and closed chromatin (dashed boxes). B Prox1 locus. A region of Pax6 binding, reduced methylation and open chromatin (boxed), two regions of Pax6 binding, mostly closed chromatin and presence of DNA methylation (dashed boxes). The individual tracks include evolutionary conservation (cons) and DNA methylation (see Fig. 1), ATAC-seq (see Fig. 9) and Pax6-binding (newborn whole lens chromatin)
Fig. 13
Fig. 13
In vitro Pax6 binding to sites with a single unmethylated and methylated CpG dinucleotide. A The consensus motif 1–1 [86] is shown followed by individual binding sites with C residues methylated marked by asterisks (red). B EMSA results using Pax6 PD/HD and PD(5a)/HD proteins. The specificity of the complexes is demonstrated by competition with cold oligonucleotides containing consensus Pax6 binding sites (P6CON) and unlabeled self-oligonucleotide. The autoradiography of experiments with PD/HD and PD(5a)/HD proteins were 6 and 16 h, respectively
Fig. 14
Fig. 14
In vitro Pax6 binding to sites with two unmethylated and methylated CpG dinucleotides. A The consensus motif 3–3 [86] is shown followed by individual binding sites with two or four C residues methylated marked by asterisks (red). B EMSA results using Pax6 PD/HD and PD(5a)/HD proteins. The specificity of the complexes is demonstrated by competition with cold oligonucleotides containing consensus Pax6 binding sites (P6CON) and unlabeled self-oligonucleotide. The autoradiography of experiments with PD/HD and PD(5a)/HD proteins were 6 and 16 h, respectively.
Fig. 15
Fig. 15
Direct comparison of differential methylation and chromatin accessibility between E14.5 embryonic epithelium and newborn P0.5 fibers. A Numbers of differentially methylated and accessible regions and their associations with DEGs. B The top 20 gene ontology terms obtained from differentially methylated-accessible regions. C Five selected de novo enriched motifs in this differentiation path, hypomethylated DMRs, best match results for transcription factors recognizing these motifs, and enrichment p-values (brackets). For the full results of the de novo enriched motif analysis, see Additional file 9: Table S7. No significantly enriched de novo motifs were found for hypermethylated DMRs

References

    1. Voigt P, Tee W-W, Reinberg D. A double take on bivalent promoters. Genes Dev. 2013;27:1318–1338. doi: 10.1101/gad.219626.113. - DOI - PMC - PubMed
    1. Berson A, Nativio R, Berger SL, Bonini NM. Epigenetic regulation in neurodegenerative diseases. Trends Neurosci. 2018;41:587–598. doi: 10.1016/j.tins.2018.05.005. - DOI - PMC - PubMed
    1. Zaret KS, Mango SE. Pioneer transcription factors, chromatin dynamics, and cell fate control. Curr Opin Genet Dev. 2016;37:76–81. doi: 10.1016/j.gde.2015.12.003. - DOI - PMC - PubMed
    1. Clark SJ, Argelaguet R, Kapourani C-A, Stubbs TM, Lee HJ, Alda-Catalinas C, Krueger F, Sanguinetti G, Kelsey G, Marioni JC, Stegle O, Reik W. scNMT-seq enables joint profiling of chromatin accessibility DNA methylation and transcription in single cells. Nat Commun. 2018;9:781. doi: 10.1038/s41467-018-03149-4. - DOI - PMC - PubMed
    1. Argelaguet R, Clark SJ, Mohammed H, Stapel LC, Krueger C, Kapourani CA, Imaz-Rosshandler I, Lohoff T, Xiang Y, Hanna CW, Smallwood S, Ibarra-Soria X, Buettner F, Sanguinetti G, Xie W, Krueger F, Göttgens B, Rugg-Gunn PJ, Kelsey G, Dean W, Nichols J, Stegle O, Marioni JC, Reik W. Multi-omics profiling of mouse gastrulation at single-cell resolution. Nature. 2019;2019(576):487–491. doi: 10.1038/s41586-019-1825-8. - DOI - PMC - PubMed

Publication types